. 2024 Feb 22:15:1304375.
doi: 10.3389/fphys.2024.1304375. eCollection 2024.

β3-Adrenoceptor as a new player in the sympathetic regulation of the renal acid-base homeostasis

Affiliations

β3-Adrenoceptor as a new player in the sympathetic regulation of the renal acid-base homeostasis

Serena Milano et al. Front Physiol. .

Abstract

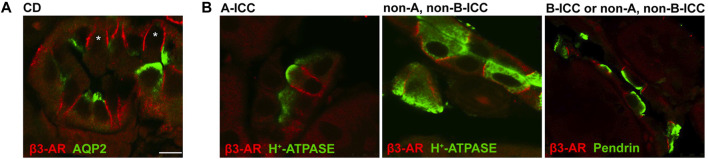
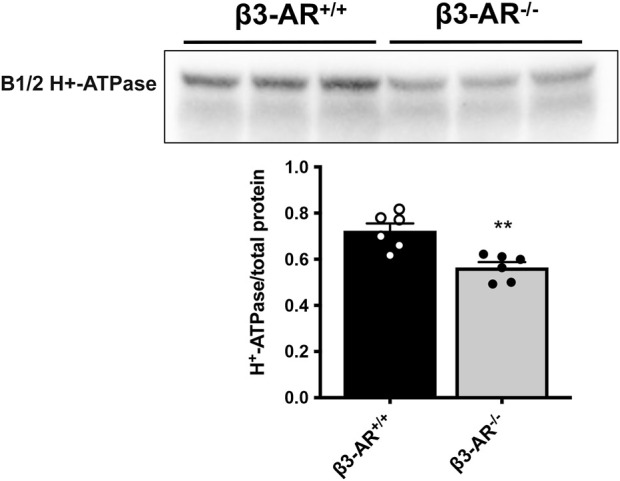
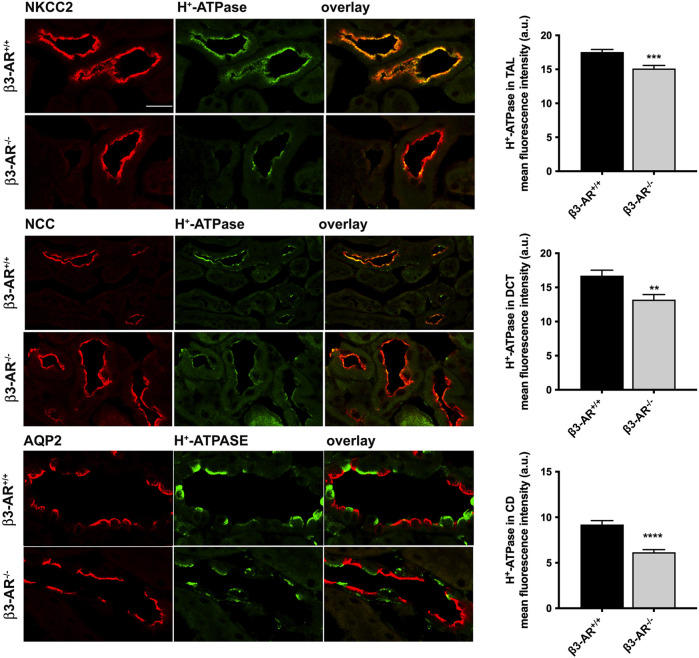
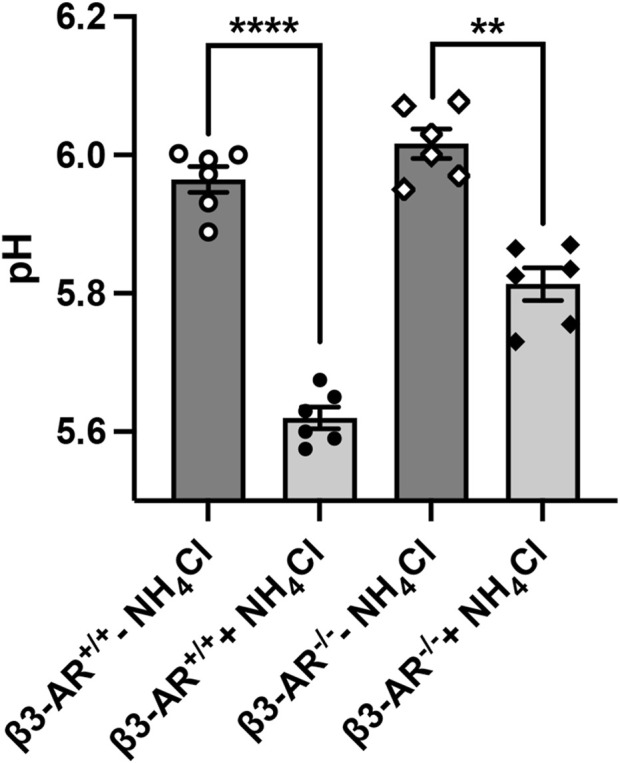
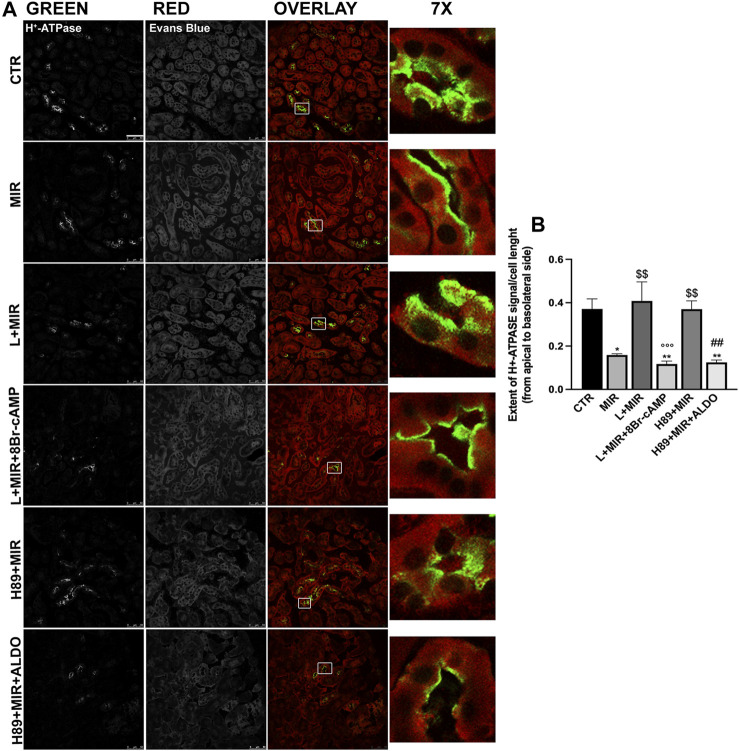
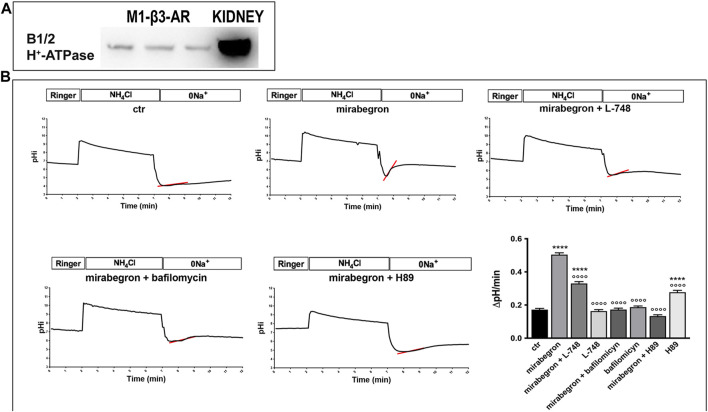
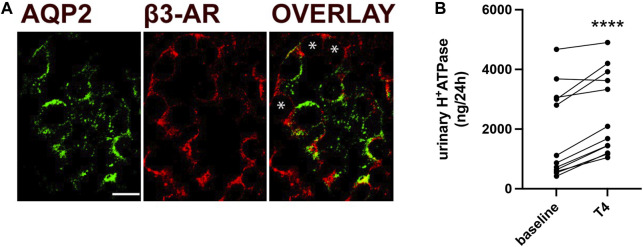
Efferent sympathetic nerve fibers regulate several renal functions activating norepinephrine receptors on tubular epithelial cells. Of the beta-adrenoceptors (β-ARs), we previously demonstrated the renal expression of β3-AR in the thick ascending limb (TAL), the distal convoluted tubule (DCT), and the collecting duct (CD), where it participates in salt and water reabsorption. Here, for the first time, we reported β3-AR expression in the CD intercalated cells (ICCs), where it regulates acid-base homeostasis. Co-localization of β3-AR with either proton pump H+-ATPase or Cl-/HCO3 - exchanger pendrin revealed β3-AR expression in type A, type B, non-A, and non-B ICCs in the mouse kidney. We aimed to unveil the possible regulatory role of β3-AR in renal acid-base homeostasis, in particular in modulating the expression, subcellular localization, and activity of the renal H+-ATPase, a key player in this process. The abundance of H+-ATPase was significantly decreased in the kidneys of β3-AR-/- compared with those of β3-AR+/+ mice. In particular, H+-ATPase reduction was observed not only in the CD but also in the TAL and DCT, which contribute to acid-base transport in the kidney. Interestingly, we found that in in vivo, the absence of β3-AR reduced the kidneys' ability to excrete excess proton in the urine during an acid challenge. Using ex vivo stimulation of mouse kidney slices, we proved that the β3-AR activation promoted H+-ATPase apical expression in the epithelial cells of β3-AR-expressing nephron segments, and this was prevented by β3-AR antagonism or PKA inhibition. Moreover, we assessed the effect of β3-AR stimulation on H+-ATPase activity by measuring the intracellular pH recovery after an acid load in β3-AR-expressing mouse renal cells. Importantly, β3-AR agonism induced a 2.5-fold increase in H+-ATPase activity, and this effect was effectively prevented by β3-AR antagonism or by inhibiting either H+-ATPase or PKA. Of note, in urine samples from patients treated with a β3-AR agonist, we found that β3-AR stimulation increased the urinary excretion of H+-ATPase, likely indicating its apical accumulation in tubular cells. These findings demonstrate that β3-AR activity positively regulates the expression, plasma membrane localization, and activity of H+-ATPase, elucidating a novel physiological role of β3-AR in the sympathetic control of renal acid-base homeostasis.

Keywords: H+-ATPase; PKA; acid loading; acid–base balance; β3-adrenoceptor.


Conflict of interest statement

The authors declare that the research was conducted in the absence of any commercial or financial relationships that could be construed as a potential conflict of interest. The author(s) declared that they were an editorial board member of Frontiers, at the time of submission. This had no impact on the peer review process and the final decision.

Figures

FIGURE 1
FIGURE 1
Immunolocalization of β3-AR in mouse kidney intercalated cells. (A) Kidney cryosections from wild-type mice were immunostained with anti-β3-AR (red) and anti-AQP2 (green) antibodies. Confocal microscopy showed that the β3-AR receptor was expressed not only in the AQP2-positive principal cells, as we previously reported, but also in the AQP2-negative intercalated cells. (B) Kidney cryosections from wild-type mice were immunostained with antibodies against β3-AR (red), H+-ATPase, or pendrin (green), which were used as markers of ICC subtypes. Immunofluorescence analysis revealed that β3-AR was expressed at basolateral membrane in A-ICC, identified by the apical expression of H+-ATPase, in B-ICC identified by the apical expression of Pendrin, and in nonA, non B cells characterized by apical and diffuse vesicular H+-ATPase staining and by pendrin at luminal side. The same results were obtained in five different animals. Scale bar = 8 μm.
FIGURE 2
FIGURE 2
Effect of β3-AR knockout on the H+-ATPase expression level in the kidneys. Western blotting with anti-H+-ATPase antibodies was carried out using homogenates prepared from whole kidneys of β3-AR+/+ (n = 6) and β3-AR−/− (n = 6) mice. Representative lanes are reported in the figure. The H+-ATPase expression levels were normalized to the total protein content using the Stain-free™ gel technology. Densitometric analysis showed a 22% decrease in H+-ATPase in β3-AR−/− mice compared to that in β3-AR+/+ mice (β3-AR+/+: 0.72 ± 0.032 SEM vs. β3-AR−/−: 0.56 ± 0.023 SEM). In the plot, each dot corresponds to a mouse, and the bars indicate the SEM. The experiment was repeated three times with comparable results. **p < 0.01 with two-tailed unpaired Student’s t-test.
FIGURE 3
FIGURE 3
H+-ATPase expression level in the thick ascending limb, distal convoluted tubule, and the collecting ducts of β3-AR−/− mice. To evaluate the effect of the β3-AR absence on the H+-ATPase expression in the β3-AR-expressing nephron segments, the kidneys from β3-AR+/+ and β3-AR−/− mice (n = 6 each) were subjected to immunofluorescence experiments using anti-H+-ATPase (in green) and anti-NKCC2/NCC/AQP2 (in red) as specific markers of the TAL, DCT, and CD, respectively. Representative images are shown. The experiment was repeated three times, and comparable results were obtained. Scale bar = 25 μm. The analysis of the mean fluorescence intensity (FI) of H+-ATPase showed that it was reduced by approximately 20% in the TAL (β3-AR+/+FI: 17.55 ± 0.37 SEM vs. β3-AR−/− FI: 15.13 ± 0.44 SEM) and the DCT (β3-AR+/+FI: 16.72 ± 0.80 SEM vs. β3-AR−/− FI: 13.2 ± 0.76 SEM) and by approximately 30% in the CD of β3-AR−/− mice compared to that expressed in β3-AR+/+ mice (β3-AR+/+FI: 9.21 ± 0.42 SEM vs. β3-AR−/− FI: 6.16 ± 0.28 SEM). ***p < 0.001, **p < 0.01, ****p < 0.0001 with two-tailed unpaired Student’s t-test.
FIGURE 4
FIGURE 4
H+-ATPase mice exhibit an attenuated response to the acid challenge. β3-AR−/− mice (n = 12) and their wild-type β3-AR+/+ (n = 12) mice were placed in metabolic cages and monitored for 5 days. For each genotype, half of the mice were provided with water (−NH4Cl, n = 6) and half were provided with a drinking solution containing 280 mM NH4Cl for 5 days to induce acid loading (+NH4Cl, n = 6). The pH of urine, collected over 24 h on the fifth day of treatment, was analyzed and reported in the plot. In both β3-AR+/+ and β3-AR−/− mice, the 24-h urine pH decreased after the acid challenge; however, this reduction was blunted in β3-AR−/− mice. For β3-AR+/+: ****p < 0.001; for β3-AR−/−: ##p < 0.01. The graph shows mean ± SEM; each dot represents each animal, and significant differences were calculated with two-tailed paired Student’s t-test. Data were analyzed also by one-way ANOVA performing pairwise comparison between groups: β3-AR+/+: ***p < 0.01; for β3-AR−/−: ##p < 0.01.
FIGURE 5
FIGURE 5
Ex vivo β3-AR stimulation promotes H+-ATPase apical expression in the kidney slices. (A) Freshly isolated kidney slices (250 μm thick) from six WT mice were left untreated (CTR) or incubated for 40 min in a complete culture medium with the β3-AR agonist mirabegron (10–8 M) alone or after 30 min of preincubation with either the β3-AR antagonist (L748,337, 10–7 M) or the PKA inhibitor (H89, 10–5 M). As positive controls of the cell responsiveness, 8-bromo-cAMP (5 × 10⁻⁴ M) or aldosterone (ALDO, 2 × 10⁻⁷ M) were used to activate H+-ATPase regardless of the β3-AR/PKA pathway. Slices were then fixed, and ultrathin cryosections (7 μm) were stained with antibodies against H+-ATPase (green), counterstained with Evans blue (red), and analyzed by confocal microscopy. MIR promoted H+-ATPase accumulation at the apical plasma membrane of renal tubular cells compared with the punctate intracellular staining of H+-ATPase observed in untreated samples (CTR) or slices stimulated with MIR after preincubation with L748,337 or H89. Images are representative of three independent experiments. Scale bar = 50 μm. (B) Histogram summarizes the effects of the treatments on the extent of the H+-ATPase signal from the apical to the basolateral side. For each experimental condition, at least 30 cells were blindly analyzed. The graph shows mean ± SEM, and significant differences were calculated with respect to the control condition by ordinary one-way ANOVA and Tukey’s multiple comparison test. *: vs. CTR, *p < 0.05; **p < 0.01; $ vs. MIR: $$p < 0.01; °L + MIR vs. L + MIR + 8Br-cAMP: °°°p < 0.001; #H89 + MIR vs. H89 + MIR + ALDO: ##p < 0.01.
FIGURE 6
FIGURE 6
In vitro β3-AR activation promotes H+-ATPase activity in mouse renal epithelial cells. (A) M1-β3-AR cells, stably transfected with human β3-AR, express endogenous H+-ATPase, as indicated by the Western blotting experiments. Total kidney lysate was used as the positive control. (B) M1-β3-AR cells, loaded with the ratiometric pH-sensitive dye BCECF, were acidified using ammonium chloride prepulse. The rate of H+-ATPase activity was determined as the alkalinization rate of the intracellular pH in the absence of sodium. Treatment with mirabegron, a human β3-AR agonist, increased the intracellular pH recovery rate by approximately 2.5-fold compared to that of untreated cells. This effect was either prevented by the β3-AR antagonist L-748 or by the PKA inhibitor H89, which block the cAMP-mediated pathway coupled with β3-AR. The pH recovery rate was attributable to H+-ATPase since it was abolished by its inhibitor bafilomycin. ****p < 0.001 vs. CTR, °°°°p < 0.001 vs. mirabegron. The graph shows mean values ± SEM, and significant differences were calculated by ordinary one-way ANOVA and Dunnett’s multiple comparison test.
FIGURE 7
FIGURE 7
In humans, β3-AR stimulation increases urinary H+-ATPase excretion. (A) Human kidney sections were stained with antibodies against β3-AR (red) and AQP2 (green), which were used as markers of CD principal cells. The overlay shows the expression of β3-AR at the basolateral membrane of AQP2-positive principal cells and AQP2-negative ICCs, indicated by asterisks. Scale bar = 10 μm. (B) ELISA measurements of H+-ATPase excreted in 24-h urine samples collected from patients treated with the β3-AR agonist mirabegron for the treatment of overactive bladder syndrome. Analysis was performed at baseline (T1 and T0 before the treatment) and after 4 weeks of treatment. Data were normalized to the 24-h urine volume. Urinary H+-ATPase excreted showed an increase of approximately 35%. N = 12 patients. The values obtained were compared using the paired t-test. Data are reported as mean ± SEM. ****p < 0.0001.

References

    1. Amlal H., Sheriff S., Soleimani M. (2004). Upregulation of collecting duct aquaporin-2 by metabolic acidosis: role of vasopressin. Am. J. Physiol. Cell Physiol. 286, C1019–C1030. 10.1152/ajpcell.00394.2003 - DOI - PubMed
    1. Berthelot (1859). Violet d’aniline. Rep. Chim. App. 1, 284.
    1. Boivin V., Jahns R., Gambaryan S., Ness W., Boege F., Lohse M. J. (2001). Immunofluorescent imaging of beta 1- and beta 2-adrenergic receptors in rat kidney. Kidney Int. 59, 515–531. 10.1046/j.1523-1755.2001.059002515.x - DOI - PubMed
    1. Boss O., Bachman E., Vidal-Puig A., Zhang C. Y., Peroni O., Lowell B. B. (1999). Role of the beta(3)-adrenergic receptor and/or a putative beta(4)-adrenergic receptor on the expression of uncoupling proteins and peroxisome proliferator-activated receptor-gamma coactivator-1. Biochem. Biophys. Res. Commun. 261, 870–876. 10.1006/bbrc.1999.1145 - DOI - PubMed
    1. Brown D., Hirsch S., Gluck S. (1988). Localization of a proton-pumping ATPase in rat kidney. J. Clin. Invest. 82, 2114–2126. 10.1172/JCI113833 - DOI - PMC - PubMed