. 2023 Mar 9;9(3):665-681.
doi: 10.1016/j.chempr.2022.11.018.

Connecting single-nucleotide polymorphisms, glycosylation status, and interactions of plasma serine protease inhibitors

Affiliations

Connecting single-nucleotide polymorphisms, glycosylation status, and interactions of plasma serine protease inhibitors

Di Wu et al. Chem. .

Abstract

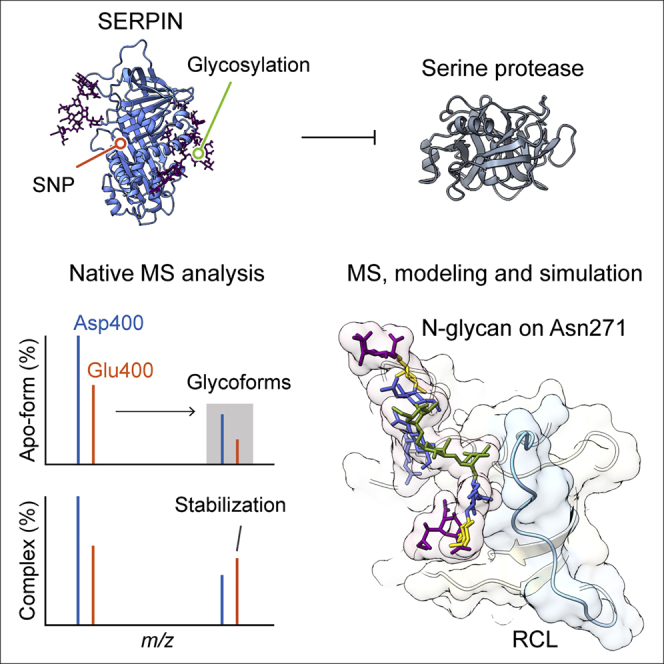
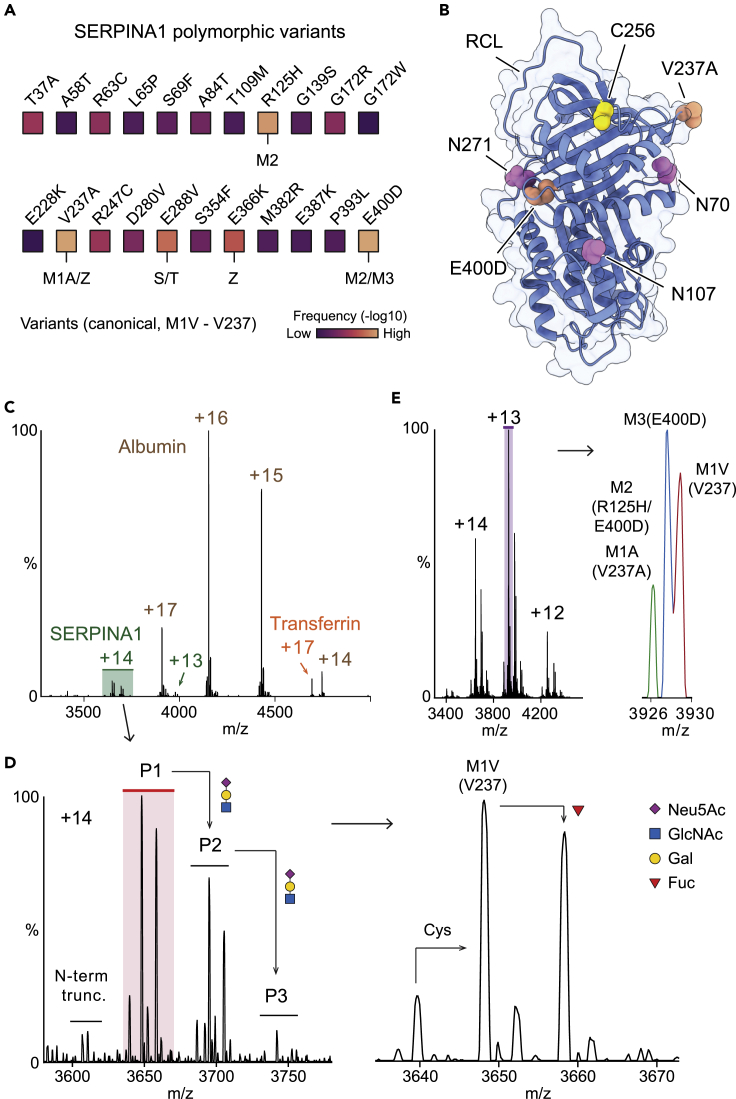
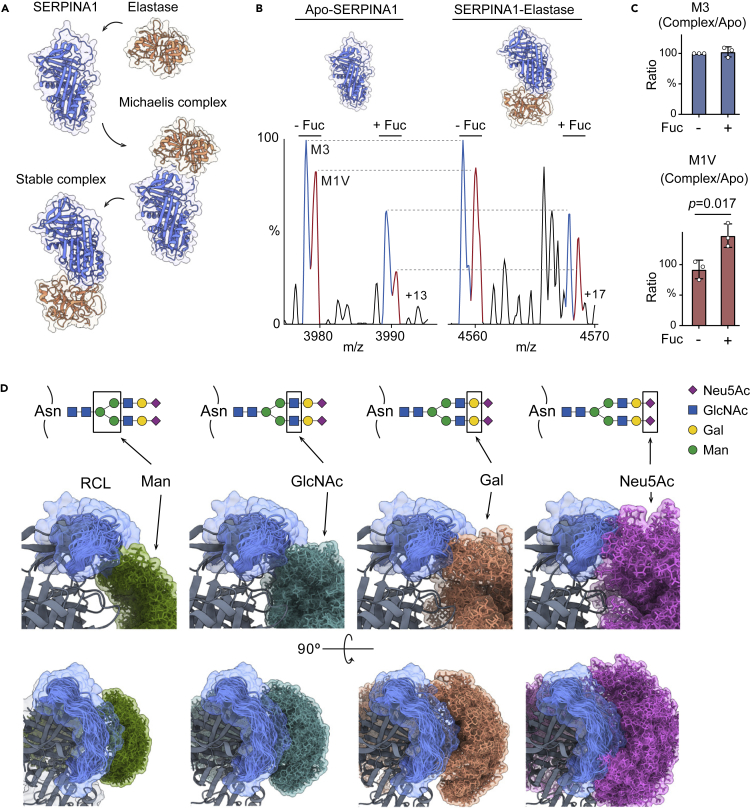
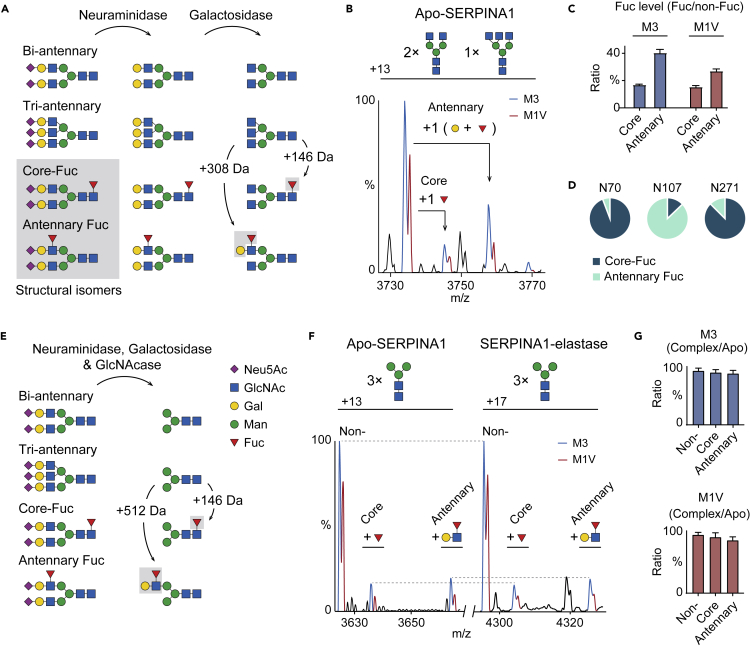
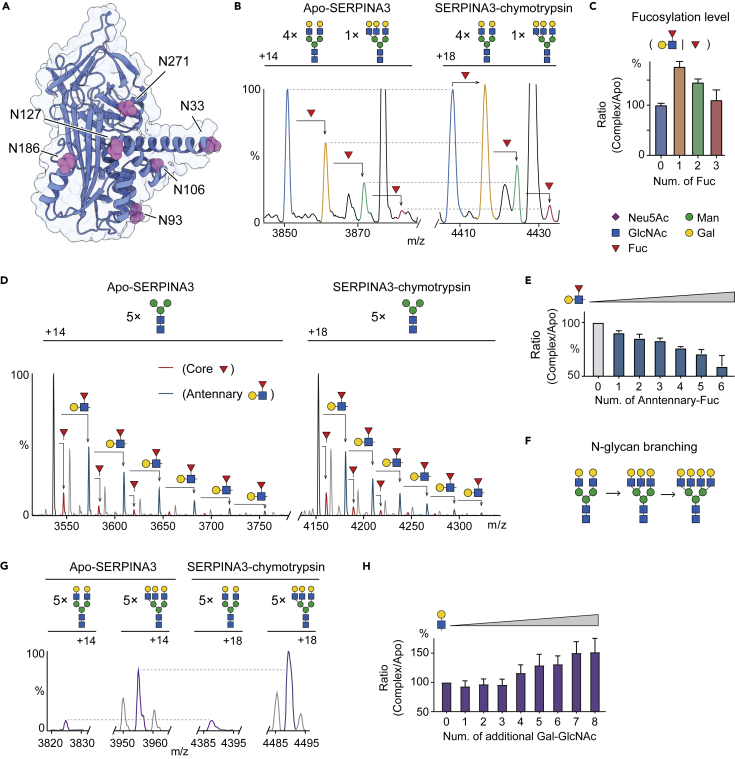
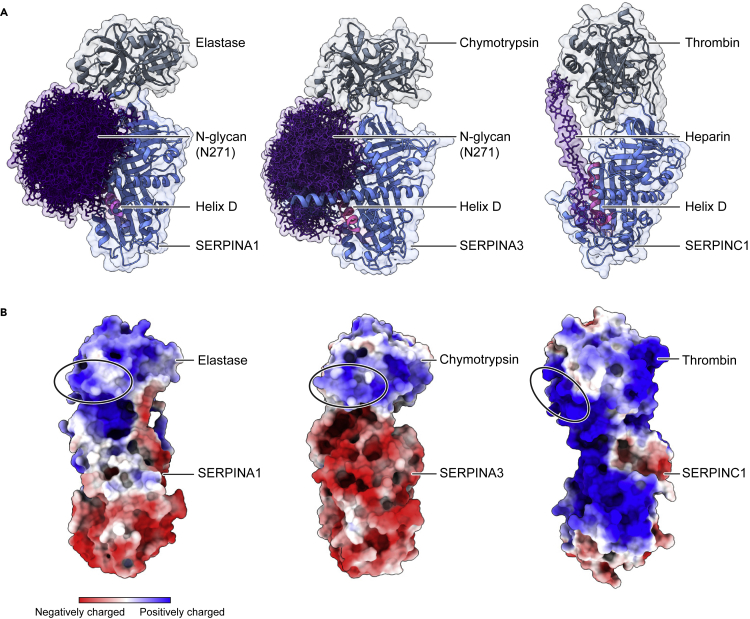
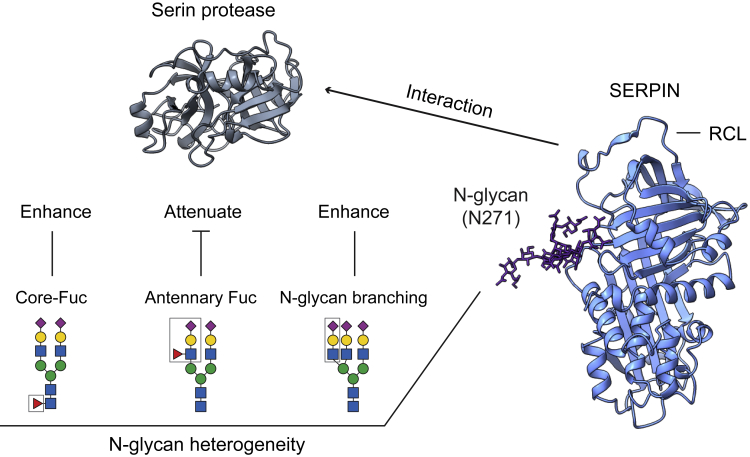
Understanding the combined impacts of genetic variances and post-translational modifications requires new approaches. Here, we delineate proteoforms of plasma serine protease inhibitors and relate specific proteoforms to their interactions in complexes through the use of native mass spectrometry (MS). First, we dissect the proteoform repertoire of an acute-phase plasma protein, serine protease inhibitor A1 (SERPINA1), resolving four SERPINA1 variants (M1V, M1A, M2, and M3) with common single-nucleotide polymorphisms (SNPs). Investigating the glycosylation status of these variants and their ability to form complexes with a serine protease, elastase, we find that fucosylation stabilizes the interaction of the SERPINA1 M1V variant through its core fucosylation on Asn271. In contrast, antennary fucosylation on Asn271 destabilizes SERPINA1-elastase interactions. We unveil the same opposing effects of core and antennary fucosylation on SERPINA3 interactions with chymotrypsin. Together, our native MS results highlight the modulating effects of fucosylation with different linkages on glycoprotein interactions.

Keywords: glycosylation; interaction; proteoform; serine protease inhibitors; single-nucleotide polymorphism.


Conflict of interest statement

The authors declare no competing interests.

Figures

None
Graphical abstract
Figure 1
Figure 1
Probing SERPINA1 heterogeneity using native MS (A) The frequency of common SERPINA1 polymorphisms. The M1A, M1V, M2, and M3 variants are the four most abundant isoforms encoded by the wild-type SERPINA1 sequence. S, T, and Z are pathogenic variants related to alpha-1 antitrypsin deficiency. (B) SERPINA1 carries three N-glycosylation sites on Asn70, Asn107, and Asn271 (highlighted in pink) and one cysteinylation site on C256 (highlighted in yellow). Two mutations (Val237Ala and Glu400Asp) are highlighted in orange. (C) Native MS of an undepleted human plasma sample from an individual donor. Albumin, SERPINA1, and transferrin peaks are labeled with the corresponding charge states. The albumin peaks with charge state +17 overlap with the SERPINA1 peaks with charge states +13. (D) SERPINA1 peaks with charge state +14. Three main peak series, namely P1, P2, and P3 are observed that correspond to additions of Neu5Ac-Gal-GlcNAc units. Within those series, further heterogeneity is assigned to cysteinylation (Cys) and fucosylation. An N-terminal truncated form (N-term trunc.) missing Asp25 to Gly29 was also detected. (E) Native mass spectrum of SERPINA1 from pooled plasma with peaks assigned to single amino acid mutations. Three peaks are annotated to M2/M1A, M3, and M1V variants, respectively. The mass spectra in (C) and (D) were acquired with R values of 30,000 and R = 25,000 for (E).
Figure 2
Figure 2
Analysis of SERPINA1-elastase complexes using native MS and MD simulations (A) Illustrative mechanism of the SERPINA1-elastase interaction. Elastase recognizes the RCL and forms a Michaelis-Menten complex with SERPINA1. After hydrolysis of the enzymatic cleavage sites, elastase and SERPINA1 form a stable complex. (B) Mass spectra of the SERPINA1 variants M3 and M1V in apo forms and in complex with elastase. The N-glycan composition and variants are labeled. (C) Bar graphs of the ratio of the SERPINA1-elastase complex to apo-SERPINA1, with and without fucosylation. Bars show mean ± standard deviation with dots from three independent experiments. A Student’s t test was performed to calculate the p value. (D) Stereoview of the superimposed conformers of four different monosaccharide residues on Asn271 and the RCL from the 150 ns MD simulation trajectory. The snapshots of the monosaccharide residues and RCL conformations are extracted (one frame ns−1) and overlayed.
Figure 3
Figure 3
Analysis of core and antennary fucosylation on SERPINA1 and SERPINA1-elastase complexes (A) Schematic illustration of neuraminidase and galactosidase digestion of N-glycans. Core-fucosylated and antennary fucosylated N-glycans are structural isomers. After double exoglycosidase digestion, the isomeric fucosylated N-glycans are transformed into two different structures with a mass difference of 162 Da (a galactose residue). (B) Native mass spectrum of SERPINA1 digested with neuraminidase and galacosidase. (C) Core- and antennary fucosylation levels of double exoglycosidase digested M3 and M1V variants. Bars show mean ± standard deviation. (D) Quantification of site-specific core- and antennary fucosylation on Asn70, Asn107, and Asn271. (E) Schematic illustration of triple exoglycosidase digestion for N-glycans using neuraminidase, galactosidase and GlcNAcase. The triple exoglycosidase digestion removes all non-fucosylated N-glycan antennae. (F) Native mass spectra of triple exoglycosidase treated apo-SERPINA1 and SERPINA1-elastase complexes. (G) Bar graphs of the ratios of the triple exoglycosidase treated SERPINA1 (M3 and M1V variants)-elastase complex to apo-SERPINA1. The ratios for non-, core- and antennary fucosylated forms are plotted. Bars show mean ± standard deviation.
Figure 4
Figure 4
Probing N-glycan heterogeneity on SERPINA3-chymotrypsin complexes using native MS analysis (A) Structure of SERPINA3. Six potential N-glycosylation sites, including Asn33, Asn93, Asn106, Asn127, Asn186, and Asn271 are highlighted in pink. (B and C) (B) Native MS analysis of the desialylated SERPINA3-chymotrypsin complexes. Native mass spectra show the fucosylation status (0 to 3 fucose residues) of apo-form SERPINA3 and SERPINA3-chymotrypsin complexes. The ratios of their relative abundances are plotted as a bar graph in (C). Error bars represent the standard deviation of three individual replicates. (D) Native MS analysis of triple exoglycosidase treated SERPINA3-chymotrypsin complexes reveals the stoichiometry and relative abundances of core- and antennary fucosylation on apo-SERPINA3 and SERPINA3-chymotrypsin complexes. (E) The ratio shown in a bar graph of the triple exoglycosidase treated SERPINA3-chymotrypsin complex to apo-SERPINA3 with different numbers of antennary fucose residues. Bars show mean ± standard deviation from three independent experiments. (F) Illustration of N-glycan branching events on SERPINA3. (G and H) (G) Native MS analysis shows the N-glycan branching status on apo-SERPINA3 and SERPINA3-chymotrypsin complexes. The ratios of the relative abundances for the corresponding proteoforms (same numbers of additional Gal-GlcNAc units) are plotted as a bar graph in (H). Bars show mean ± standard deviation from three independent experiments.
Figure 5
Figure 5
Structural analysis of SERPIN-protease complexes (A) Structural comparison of SERPINA1-elastase, SERPINA3-chymotrypsin, and SERPINC1-thrombin-heparin complexes (PDB:1TB6). N-glycan on Asn271 is modeled on SERPINA1/A3. The positively charged helix D in SERPINA1/A3 and SERPINC1 are highlighted in pink. (B) The surface electrostatic potential of SERPINA1-elastase, SERPINA3-chymotrypsin, and SERPINC1-thrombin complexes. The loop 3 and 6 of proteases at the interfacial domain are highlighted in black circles.
Figure 6
Figure 6
A general model for N-glycan regulation of SERPIN-serine protease interactions The N-glycan on Asn271 plays a regulatory role for SERPIN-protease interactions. Core fucosylation and N-glycan branching enhance SERPIN-protease complex formation while antennary fucosylation attenuates the interactions.

Similar articles

Cited by

References

    1. Aebersold R., Agar J.N., Amster I.J., Baker M.S., Bertozzi C.R., Boja E.S., Costello C.E., Cravatt B.F., Fenselau C., Garcia B.A., et al. How many human proteoforms are there? Nat. Chem. Biol. 2018;14:206–214. doi: 10.1038/nchembio.2576. - DOI - PMC - PubMed
    1. Chen L., Liu S., Tao Y. Regulating tumor suppressor genes: post-translational modifications. Signal Transduct. Target. Ther. 2020;5:90. doi: 10.1038/s41392-020-0196-9. - DOI - PMC - PubMed
    1. Rodriguez H., Zenklusen J.C., Staudt L.M., Doroshow J.H., Lowy D.R. The next horizon in precision oncology: proteogenomics to inform cancer diagnosis and treatment. Cell. 2021;184:1661–1670. doi: 10.1016/j.cell.2021.02.055. - DOI - PMC - PubMed
    1. Geyer P.E., Holdt L.M., Teupser D., Mann M. Revisiting biomarker discovery by plasma proteomics. Mol. Syst. Biol. 2017;13:942. doi: 10.15252/msb.20156297. - DOI - PMC - PubMed
    1. Sun B.B., Maranville J.C., Peters J.E., Stacey D., Staley J.R., Blackshaw J., Burgess S., Jiang T., Paige E., Surendran P., et al. Genomic atlas of the human plasma proteome. Nature. 2018;558:73–79. doi: 10.1038/s41586-018-0175-2. - DOI - PMC - PubMed