. 2024 Feb 20;27(3):109281.
doi: 10.1016/j.isci.2024.109281. eCollection 2024 Mar 15.

The decreased astrocyte-microglia interaction reflects the early characteristics of Alzheimer's disease

Affiliations

The decreased astrocyte-microglia interaction reflects the early characteristics of Alzheimer's disease

Kefu Liu et al. iScience. .

Abstract

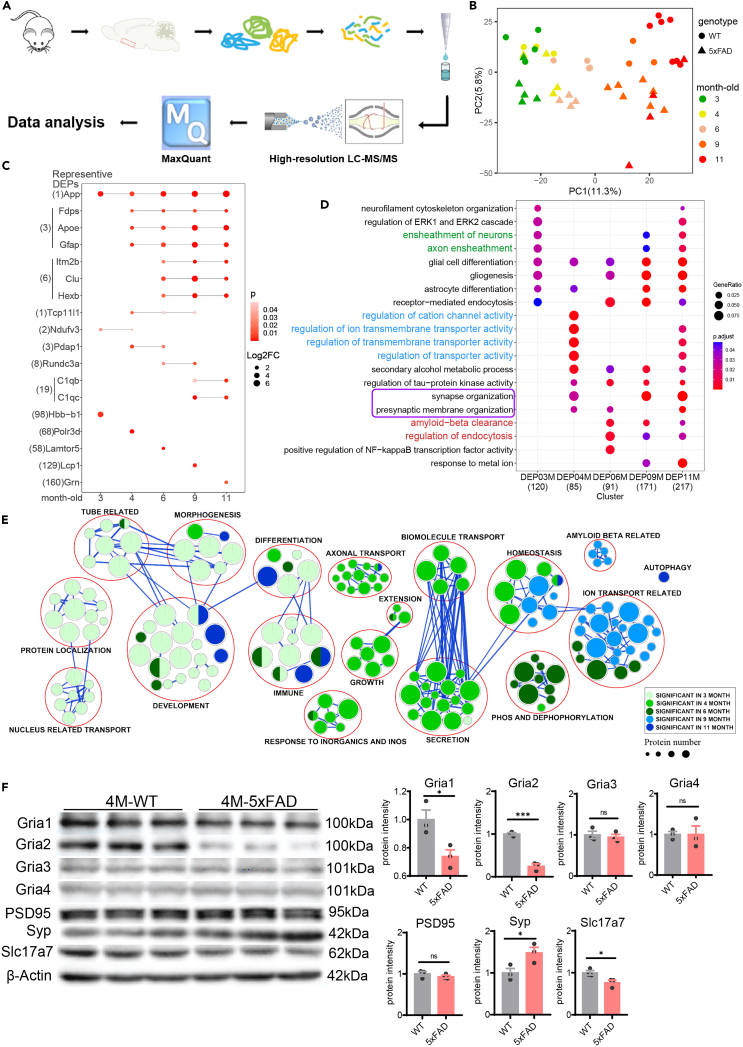
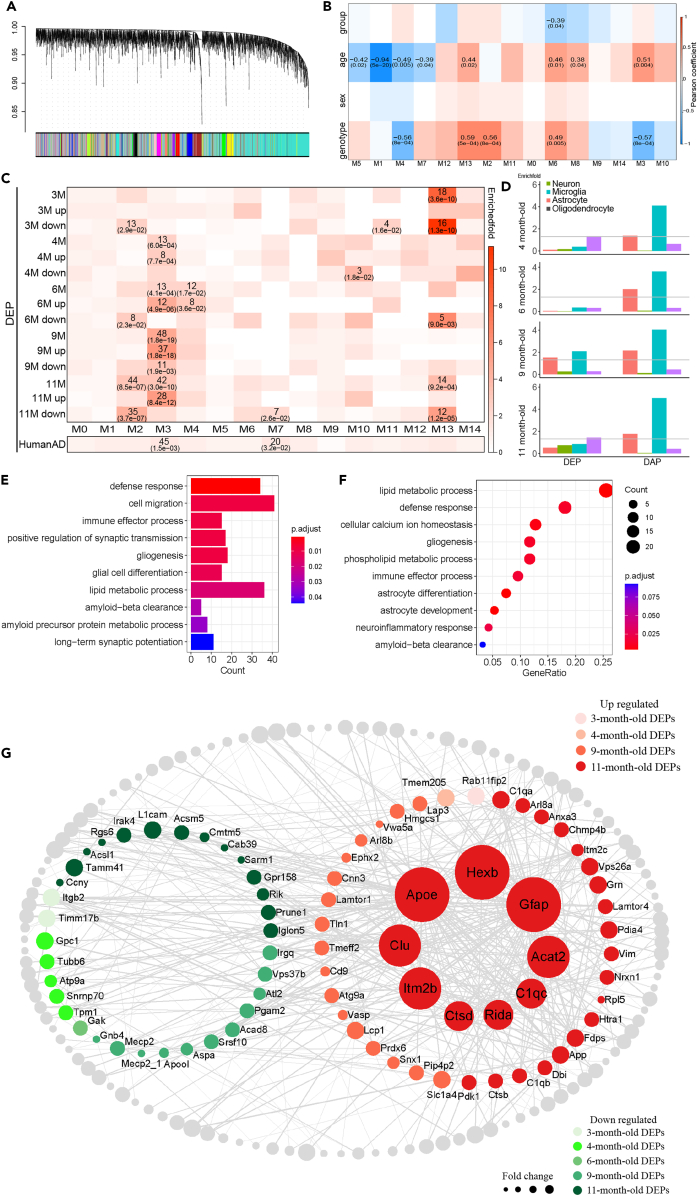
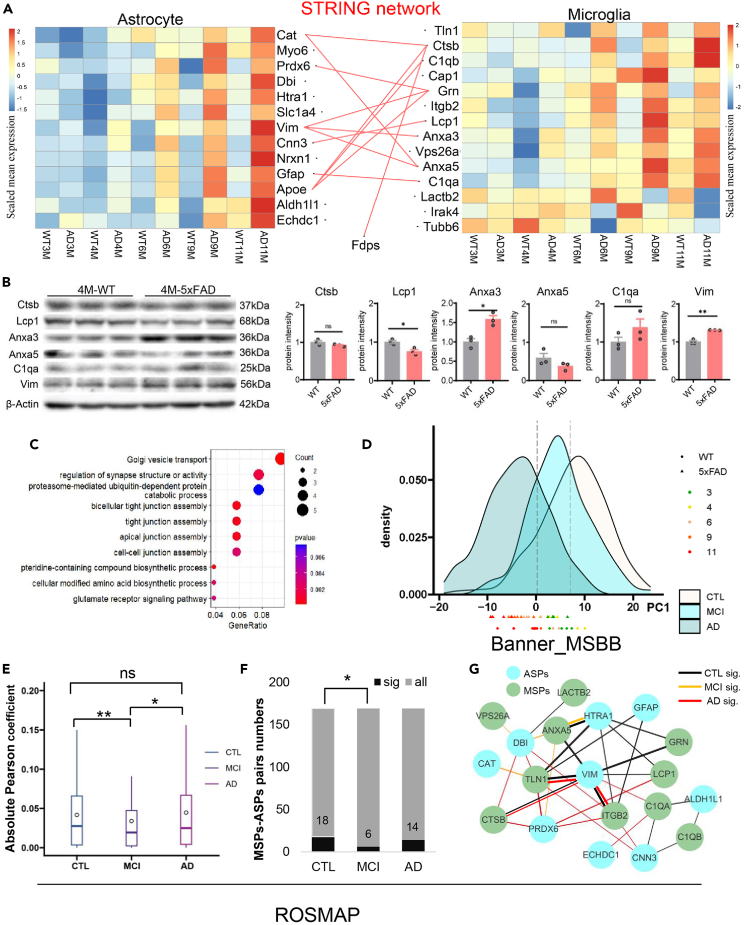
Alzheimer's disease (AD) is the most common neurodegenerative disease often associated with olfactory dysfunction. Aβ is a typical AD hall marker, but Aβ-induced molecular alterations in olfactory memory remain unclear. In this study, we used a 5xFAD mouse model to investigate Aβ-induced olfactory changes. Results showed that 4-month-old 5xFAD have olfactory memory impairment accompanied by piriform cortex neuron activity decline and no sound or working memory impairment. In addition, synapse and glia functional alteration is consistent across different ages at the proteomic level. Microglia and astrocyte specific proteins showed strong interactions in the conserved co-expression network module. Moreover, this interaction declines only in mild cognitive impairment patients in human postmortem brain proteomic data. This suggests that astrocytes-microglia interaction may play a leading role in the early stage of Aβ-induced olfactory memory impairment, and the decreasing of their synergy may accelerate the neurodegeneration.

Keywords: Biological sciences; Classification Description; Disease; Health sciences.


Conflict of interest statement

The authors declare that they have no competing interests.

Figures

None
Graphical abstract
Figure 1
Figure 1
4-month-old 5xFAD mice exhibit olfactory memory retrieval impairment (A) Behavioral design for olfactory memory. (B and C) Behavioral performances on day 1 and day 2 (WT, n = 10; 5xFAD, n = 10). (D) Behavioral design for auditory memory. (E and F) Behavioral performances on day 1 and day 2 (WT, n = 8; 5xFAD, n = 8). (G) Up, schematic of virus injection; down, Behavioral design of olfactory memory; insert, the representative confocal images of Gcamp6s expression in the PCx. Scale bar: 200μm. (H and I) main, the mean and SEM of the corresponding Ca2+ signal of 4-month-old mice PCx neurons during day 1 and day 2; insert, quantification of the average amplitude during 2-4s (colored area) after odor stimulation on day1 and day2 between WT and 5xFAD mice (WT, n = 6; 5xFAD, n = 6, day 1 had 3 trial for each mouse, thus have 18 dots each group). (J and K) Quantification of Aβ plaque numbers between 4-month-old WT and 5xFAD mice in PCx (WT, n = 3; 5xFAD, n = 3, 3 slices each mouse, thus 9 dots each group). Scale bar: 50μm. The numbers counting was done in the 150 μm × 150 μm area. (L) Behavioral design for working memory. (M) Behavioral performance (WT, n = 6; 5xFAD, n = 6).All statistical analyzes are used by t-test, ns, not significant; ∗p < 0.05, ∗∗∗p < 0.001. Data are presented as mean ± SEM.
Figure 2
Figure 2
The alteration of PCx proteome between WT vs. 5xFAD in different stages (A) Workflow summarizing the process of mass-spectrum based proteomics. (B) PCA of proteome data showed main difference in age (3-month-old: WT = 4, 5xFAD = 5; 4-month-old: WT = 4, 5xFAD = 4; 6-month-old: WT = 4, 5xFAD = 5; 9-month-old: WT = 3, 5xFAD = 7; 11-month-old: WT = 7, 5xFAD = 4). (C) Diagram of DEPs in different month-old mice, degree of red color indicated their p values, nodes size indicates their log2FC, bar in nodes indicate their overlapping status among different month-old. (D) GO pathway enrichment of DEPs of different month-old mice. The key pathways were colored in green, blue, red fonts which show specific enrichment in different month-old and purple box showed synapse related functions. (E) GSEA enrichment of DEPs in different month-old mice. Results from left to right were sorted in the order of 3-month to 11-month. (F) Classic synaptic proteins expression showed synapse impairment in 4-month-old 5xFAD. Left, Western blot images; right, quantification of western blots, t-test, ns, not significant; ∗p < 0.05, ∗∗∗p < 0.001. Data are presented as mean ± SEM.
Figure 3
Figure 3
Proteome in different stages shared the conserved co-expression network (A) Dendro-tree plot of WGCNA. All protein were used to build up WGCNA module. (B) Heatmap of module-trait relationship. Diagnose, age, sex and disease were all included to see their pearson correlation with different module from WGCNA (Module eigenvalue (ME) were used to calculate pearson coefficient, number in the upper cell block is Pearson coefficient and in lower cell block is p value). (C) Heatmap of DEPs and Human postmortem brain data enrichment in WGCNA module. Enriched number and p value were showed in the matched cell block (Enriched fold in upper cell block and p value in lower cell block). (D) Histogram of DEPs and DAPs enrichment in different type of cell. Enrichfold was taken –log10 and gray line indicate p < 0.05. (E) KEGG pathway enrichment of proteins in M3. (F) KEGG pathway enrichment of DAPs core (overlapping DAPs in M3). (G) Network of all DEPs and DAPs. Size of the nodes indicate their fold change. Green nodes indicate they are down-regulated, red nodes indicate they are up-regulated, both color shade along with age. The size of hub protein nodes are 5 times enlarged and are in the middle of up-regulated proteins.
Figure 4
Figure 4
Immunohistochemistry and WB of astrocyte and microglia in the PCx (A) Immunohistochemistry images of Aβ, Iba1, and Gfap in the PCx from WT and 5xFAD mice (3 and 4-month-old). Scale bar, 50μm. (B and C) Quantification of Gfap+ (b) and Iba1+ (c) cell numbers in the immunohistochemistry images (3 mice each group, 3 slides each mouse, counting in the same area). White boxed area is for zoom in. (D) Western blot images of β-actin, Iba1, and Gfap in the PCx from WT and 5xFAD mice (3 and 4-month-old). The calculation was done in the 640 μm × 640 μm area. (E and F) Quantification of Gfap Iba1 in the western blots shown in (d). Values are mean ± SEM (3 and 4-month-old, n = 3 mice/genotype). All values are mean ± SEM. ∗p < 0.05, ∗∗p < 0.01, ∗∗∗p < 0.001, Multiple t test.
Figure 5
Figure 5
Interaction of astrocyte and microglia alter in the early stage of AD (A) STRING network of astrocyte and microglia specific proteins in 4-month-old DAPs combined with a heatmap of their relative abundance. (B) WB of astrocyte and microglia specific proteins in the 4-month-old mice. (C) GO biological process enrichment of 4-month-old DAPs. (D) PCA analysis with combined human (Banner_MSBB dataset) and mouse proteomic data. (E and F) ROSMAP data analysis (CTL = 117, MCI = 155, AD = 94). e, Absolute Pearson coefficient of ASPs-MSPs interaction showed in a significant decreased in MCI from the ROSMAP cohort, Wilcox test. f, Significant interaction numbers between ASPs and MSPs only decreased in MCI from the ROSMAP cohort, chi-square test. (G) The disease status specific interaction between ASPs and MSPs from the ROSMAP cohort. ∗, p < 0.05, ∗∗p < 0.01.
Figure 6
Figure 6
Interaction between astrocyte and microglia (A) Workflow of astrocyte and microglia in vitro experiment. Microglia were cultured with astrocyte medium and regular medium separately. ∗ Replacing medium with regular DMEM+10%FBS after 24h of Aβ stimulate, and collected medium after cultured with regular medium for 24h. (B) Immunoblots images of β-actin, Anxa3, Anxa5, C1qA, Lcp1, and Ctsb in the PCx from cultured microglia. (C) Quantification of Anxa3, Anxa5, C1qA, Lcp1, and Ctsb in the immunoblots shown in (b). Values are mean ± SEM (4-month-old, n = 3 mice/genotype). One-way ANOVA, ∗p < 0.05, ∗∗p < 0.01, ∗∗∗p < 0.001.
Figure 7
Figure 7
Illustration of potential mechanism among Aβ, astrocytes, and microglia in initial memory impairment stage

Similar articles

Cited by

References

    1. Crous-Bou M., Minguillón C., Gramunt N., Molinuevo J.L. Alzheimer's disease prevention: from risk factors to early intervention. Alzheimers Res. Ther. 2017;9:71. doi: 10.1186/s13195-017-0297-z. - DOI - PMC - PubMed
    1. Murphy C. Olfactory and other sensory impairments in Alzheimer disease. Nat. Rev. Neurol. 2019;15:11–24. doi: 10.1038/s41582-018-0097-5. - DOI - PubMed
    1. Sepulcre J., Grothe M.J., d'Oleire Uquillas F., Ortiz-Terán L., Diez I., Yang H.S., Jacobs H.I.L., Hanseeuw B.J., Li Q., El-Fakhri G., et al. Neurogenetic contributions to amyloid beta and tau spreading in the human cortex. Nat. Med. 2018;24:1910–1918. doi: 10.1038/s41591-018-0206-4. - DOI - PMC - PubMed
    1. Devanand D.P., Lee S., Manly J., Andrews H., Schupf N., Doty R.L., Stern Y., Zahodne L.B., Louis E.D., Mayeux R. Olfactory deficits predict cognitive decline and Alzheimer dementia in an urban community. Neurology. 2015;84:182–189. doi: 10.1212/wnl.0000000000001132. - DOI - PMC - PubMed
    1. Devanand D.P., Tabert M.H., Cuasay K., Manly J.J., Schupf N., Brickman A.M., Andrews H., Brown T.R., DeCarli C., Mayeux R. Olfactory identification deficits and MCI in a multi-ethnic elderly community sample. Neurobiol. Aging. 2010;31:1593–1600. doi: 10.1016/j.neurobiolaging.2008.09.008. - DOI - PMC - PubMed

LinkOut - more resources