. 2024 Feb 5;27(3):109124.
doi: 10.1016/j.isci.2024.109124. eCollection 2024 Mar 15.

Predicting transcription factor activity using prior biological information

Affiliations

Predicting transcription factor activity using prior biological information

William M Yashar et al. iScience. .

Abstract

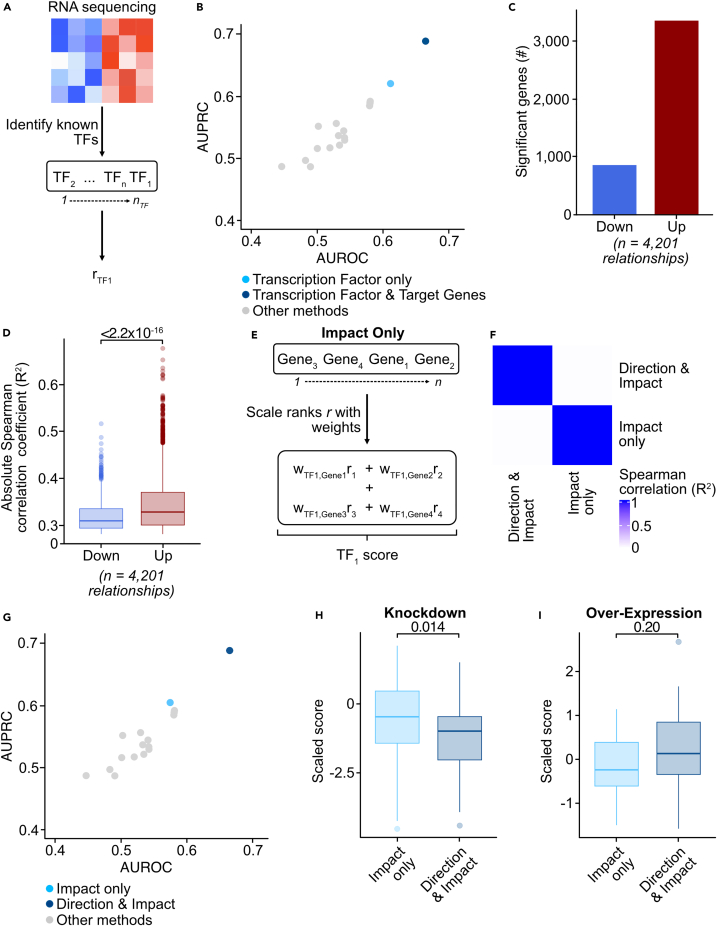
Dysregulation of normal transcription factor activity is a common driver of disease. Therefore, the detection of aberrant transcription factor activity is important to understand disease pathogenesis. We have developed Priori, a method to predict transcription factor activity from RNA sequencing data. Priori has two key advantages over existing methods. First, Priori utilizes literature-supported regulatory information to identify transcription factor-target gene relationships. It then applies linear models to determine the impact of transcription factor regulation on the expression of its target genes. Second, results from a third-party benchmarking pipeline reveals that Priori detects aberrant activity from 124 single-gene perturbation experiments with higher sensitivity and specificity than 11 other methods. We applied Priori and other top-performing methods to predict transcription factor activity from two large primary patient datasets. Our work demonstrates that Priori uniquely discovered significant determinants of survival in breast cancer and identified mediators of drug response in leukemia.

Keywords: Biocomputational method; Biological constraints; Gene network; Molecular mechanism of gene regulation.


Conflict of interest statement

W.M.Y. is a former employee of Abreos Biosciences, Inc. and was compensated in part with common stock options. Pursuant to the merger and reorganization agreement between Abreos Biosciences, Inc. and Fimafeng, Inc., W.M.Y. surrendered all of his common stock options in 03/2021. T.P.B. has received research support from AstraZeneca, Blueprint Medicines as well as Gilead Sciences and is the institutional PI on the FRIDA trial sponsored by Oryzon Genomics. The authors certify that all compounds tested in this study were chosen without input from any of our industry partners. The other authors do not have competing interests, financial or otherwise.

Figures

None
Graphical abstract
Figure 1
Figure 1
Overview of the Priori methodology and benchmarking workflow (A) Priori generates an activity score for each transcription factor in an RNA-seq dataset. Priori first extracts the downstream target genes for each transcription factor from Pathway Commons. Priori then calculates weights for each target gene by correlating the expression of each transcription factor to its target genes. Priori then ranks the absolute expression of all genes in the dataset and scales these ranks by the transcription factor-target gene weights. The summation of the weighted target gene ranks is the transcription factor activity score. (B) Schematic overview of the benchmarking workflow. We generated transcription factor activity scores for each method using normalized RNA-seq counts following single-gene knockdown or over-expression. Priori, along with other methods that use prior information, generated activity scores with transcriptional relationships from Pathway Commons. AUROC and AUPRC values were calculated for each down-sampling permutation. 100 down-sampling permutations were performed to compare an equal number of perturbed and unperturbed genes.
Figure 2
Figure 2
Priori detects aberrant transcription factor activity with improved sensitivity and specificity (A) Using the decoupleR workflow, transcription factor activity scores were generated using the perturbation dataset. Spearman correlation of the activity scores for each method. (B) Activity scores were generated using Pathway Commons transcriptional relationships. Mean AUPRC and AUROC values across the 100 down-sampling permutations for each method. (C and D) The distribution of (C) AUPRC and (D) AUROC values across the 100 down-sampling permutations from (B). Error bars represent the SEM. (E and F) Activity scores were generated using (E) DoRothEA or (F) OmniPath transcriptional relationships. Mean AUPRC and AUROC values across the 100 down-sampling permutations for each method.
Figure 3
Figure 3
Evaluation of the direction and impact of transcriptional regulation is critical for Priori to detect aberrant transcription factor activity (A) Schematic showing how transcription factor activity scores were generated using transcription factor expression only (in contrast to both transcription factor and target gene expression as shown in Figure 1A). The alternative method first identified transcription factors in the perturbation dataset from Pathway Commons. The method then ranks the transcription factors by expression and reports the normalized rank as the activity score. (B) Activity scores were generated using the method outlined in (A). Transcriptional relationships from Pathway Commons were used as prior information. Mean AUPRC and AUROC values across the 100 down-sampling permutations. Mean AUPRC and AUROC values from the methods in Figure 2B are also shown. (C) Priori identified transcription factor target genes in the perturbation dataset using Pathway Commons transcriptional relationships. The expression of transcription factors and their target genes were evaluated using Spearman correlation. Statistical significance was determined using the Spearman correlation p value with an FDR post-test correction. The Spearman correlation coefficient was used to determine down-regulated (R2 < 0) and up-regulated target genes (R2 > 0). (D) Absolute Spearman correlation coefficient of the expression of transcription factors and their down-regulated or up-regulated target genes. Statistical significance was determined by a two-sided Student’s t test. Error bars represent the SEM. (E) Schematic showing how Priori was altered to assess only the impact of transcriptional regulation (in contrast to both direction and impact of regulation as shown in Figure 1A). (F) Using the decoupleR workflow, transcription factor activity scores were generated using the perturbation dataset. Spearman correlation of the activity scores for each method. (G) Activity scores were generated using the method outlined in (E). Transcriptional relationships from Pathway Commons were used as prior information. Mean AUPRC and AUROC values across the 100 down-sampling permutations for Priori using only the impact of transcriptional relationships. Mean AUPRC and AUROC values from the methods in Figure 2B are also shown. (H and I) Priori activity scores using absolute and relative transcriptional relationships were z-transformed. Distribution of scaled scores for perturbed transcription factors across all (H) knockdown and (I) over-expression experiments. Statistical significance was determined by a two-sided Student’s t test. Error bars represent the SEM.
Figure 4
Figure 4
FOXA1 transcription factor activity is a significant determinant of survival for patients with BIDC (A) Priori scores were generated from RNA-seq of 637 patients with BIDC. UMAP dimensional reduction and projection of Priori scores. Dots are colored by the breast cancer molecular subtype. (B) Unsupervised hierarchical clustering of Priori scores generated in (A). (C) Mean absolute difference of Priori scores from patients in the clusters 1 and 2 defined in (B). (D) Distribution of FOXA1 Priori scores among patients in clusters 1 and 2 defined in (B). Statistical significance was determined by a two-sided Student’s t test. Error bars represent the SEM. (E‒G) Kaplan-Meier survival analysis of patients grouped by (E) molecular subtype, (F) FOXA1 Priori scores, or (G) FOXA1 normalized gene expression counts. Patients among the top 90% of Priori scores or counts were grouped into “High” and those in the bottom 10% were grouped into “Low”. Statistical significance was determined by a log rank Mantel-Cox test. (H) Differential gene expression network enrichment between clusters defined in (B). Select significantly enriched nodes are shown.
Figure 5
Figure 5
FOXO1 is a critical mediator of response to venetoclax in AML (A) Priori scores generated from RNA-seq of 859 patients with AML. Spearman correlation of Priori scores and ex vivo drug response AUC data. (B and C) Spearman correlation of ranked venetoclax AUC and ranked (B) FOXO1 Priori scores or (C) FOXO1 normalized counts. Statistical significance was determined using the Spearman correlation p value with an FDR post-test correction. (D and E) THP-1 cells were transduced with lentiviral particles harboring expression cassettes for hSpCas9 and a non-targeting or FOXO1 guide RNA. Cells were cultured for 3 days along a 7-point curve with venetoclax. Cell viability was assessed by CellTiter Aqueous colorimetric assay. ns = not significant; ∗ = p < 0.05, ∗∗ = p < 0.01, ∗∗∗ = p < 0.001, ∗∗∗∗ = p < 0.0001.

Similar articles

Cited by

References

    1. Fuda N.J., Ardehali M.B., Lis J.T. Defining mechanisms that regulate RNA polymerase II transcription in vivo. Nature. 2009;461:186–192. doi: 10.1038/nature08449. - DOI - PMC - PubMed
    1. Spitz F., Furlong E.E.M. Transcription factors: from enhancer binding to developmental control. Nat. Rev. Genet. 2012;13:613–626. doi: 10.1038/nrg3207. - DOI - PubMed
    1. Bushweller J.H. Targeting transcription factors in cancer — from undruggable to reality. Nat. Rev. Cancer. 2019;19:611–624. doi: 10.1038/s41568-019-0196-7. - DOI - PMC - PubMed
    1. Lee T.I., Young R.A. Transcriptional Regulation and Its Misregulation in Disease. Cell. 2013;152:1237–1251. doi: 10.1016/j.cell.2013.02.014. - DOI - PMC - PubMed
    1. Lin C.Y., Lovén J., Rahl P.B., Paranal R.M., Burge C.B., Bradner J.E., Lee T.I., Young R.A. Transcriptional Amplification in Tumor Cells with Elevated c-Myc. Cell. 2012;151:56–67. doi: 10.1016/j.cell.2012.08.026. - DOI - PMC - PubMed