. 2024 Feb 22:18:1365737.
doi: 10.3389/fnins.2024.1365737. eCollection 2024.

How the forebrain transitions to adulthood: developmental plasticity markers in a long-lived rodent reveal region diversity and the uniqueness of adolescence

Affiliations

How the forebrain transitions to adulthood: developmental plasticity markers in a long-lived rodent reveal region diversity and the uniqueness of adolescence

B Maximiliano Garduño et al. Front Neurosci. .

Abstract

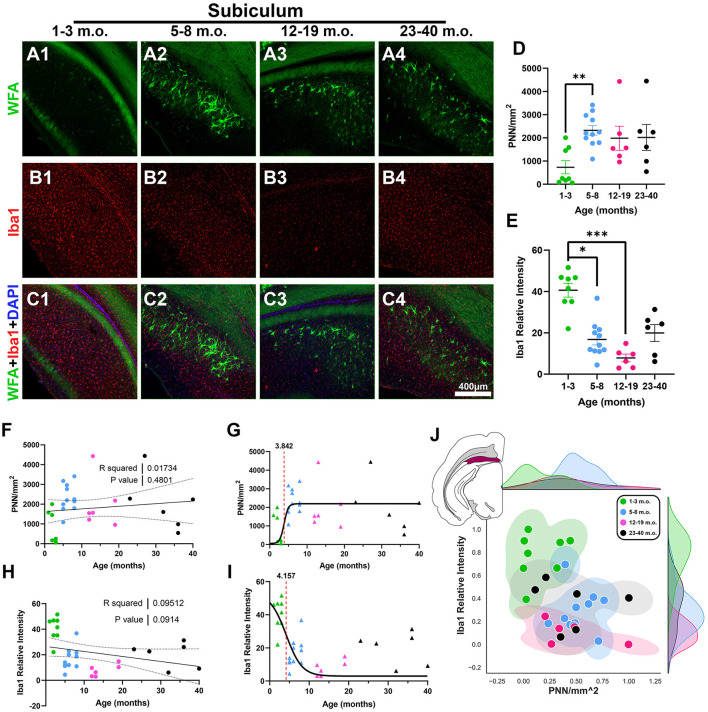
Maturation of the forebrain involves transitions from higher to lower levels of synaptic plasticity. The timecourse of these changes likely differs between regions, with the stabilization of some networks scaffolding the development of others. To gain better insight into neuroplasticity changes associated with maturation to adulthood, we examined the distribution of two molecular markers for developmental plasticity. We conducted the examination on male and female degus (Octodon degus), a rodent species with a relatively long developmental timecourse that offers a promising model for studying both development and age-related neuropathology. Immunofluorescent staining was used to measure perineuronal nets (PNNs), an extracellular matrix structure that emerges during the closure of critical plasticity periods, as well as microglia, resident immune cells that play a crucial role in synapse remodeling during development. PNNs (putatively restricting plasticity) were found to be higher in non-juvenile (>3 month) degus, while levels of microglia (putatively mediating plasticity) decreased across ages more gradually, and with varying timecourses between regions. Degus also showed notable variation in PNN levels between cortical layers and hippocampal subdivisions that have not been previously reported in other species. These results offer a glimpse into neuroplasticity changes occurring during degu maturation and highlight adolescence as a unique phase of neuroplasticity, in which PNNs have been established but microglia remain relatively high.

Keywords: adolescence; degu (Octodon degus); microglia; perineuronal net (PNN); plasticity.


Conflict of interest statement

The authors declare that the research was conducted in the absence of any commercial or financial relationships that could be construed as a potential conflict of interest. The author(s) declared that they were an editorial board member of Frontiers, at the time of submission. This had no impact on the peer review process and the final decision.

Figures

Figure 1
Figure 1
Perineuronal nets (PNNs) and microglia across the postnatal degu brain. (A–H) Immunofluorescence microscopic overviews of anterior-to-posterior coronal hemispheres of 1–3 m.o. (juvenile) (A, E), 5–8 m.o. (adolescent) (B, F), 12–19 m.o. (younger adult) (C, G), and 23–40 m.o. (older adult) (D, H) degus. WFA stained PNNs (in green) showed increased signal across the post-puberty 5–40 m.o. degu brain (B–D) when compared to 1–3 m.o. degu (A). Microglia immunoreactivity stained with Iba1 antibody (in red) showed greater signal in 1–3 m.o. degus (E) than older 5–40 m.o. degus (F–H). Regions further investigated in this study are outlined and labeled. All sections were counterstained with DAPI (blue).
Figure 2
Figure 2
Prelimbic cortex (PrL) exhibits reduced perineuronal nets (PNN) in juvenile degus and an overall gradual decrease in microglia with age. (A–C) Immunofluorescence confocal micrographs showing PNNs (WFA, green) and microglia (Iba1, red) in the PrL of 1–3 m.o. (juvenile) (A1, B1, C1), 5–8 m.o. (adolescent) (A2, B2, C2), 12–19 m.o. (younger adult) (A3, B3, C3), and 23–40 m.o. (older adult) (A4, B4, C4) degus. (D) Quantification of PNN-positive signal per mm2 in the four different age groups showed a significant difference between 1–3 m.o. degus and 5–8 m.o./12–19 m.o./23–40 m.o. degus (p = 0.003, p = 0.02, and p = 0.009, respectively). (E) Degu PrL had no significant Iba1 relative intensity differences between age groups. (F, H) Linear regression analysis of PNN/mm2 (F) and Iba1 relative intensity (H) with increasing degu age. PNN/mm2 possessed a significant positive correlation with age (R2 = 0.22; p = 0.012), while Iba1 relative intensity had a significant negative correlation (R2 = 0.21; p = 0.016). (G, I) Sigmoid curve data fits revealed PNNs have an earlier inflection age (4.88 months) than microglia (18.27 months) in the PrL. (J) Normalized individual data points for all 1–40 m.o. degus in PNN/mm2 and Iba1 relative intensity space showed juvenile degus separate from post-puberty age group clusters. Error bars represent SEM; Kruskal–Wallis test followed by post-hoc Dunn's test: trendp < 0.1, *p < 0.05, **p < 0.01.
Figure 3
Figure 3
Juvenile degus show decreased perineuronal nets (PNN) in entorhinal cortex (EC) when compared to older degus. (A–C) Immunofluorescence confocal micrographs showing PNNs (WFA, green) and microglia (Iba1, red) in the EC of 1–3 m.o. (juvenile) (A1, B1, C1), 5–8 m.o. (adolescent) (A2, B2, C2), 12–19 m.o. (younger adult) (A3, B3, C3), and 23–40 m.o. (older adult) (A4, B4, C4) degus. (D) Quantification of PNN-positive signal per mm2 in the four different age groups revealed significant differences between 1–3 m.o. degus and 5–8 m.o./12–19 m.o. degus (p = 0.039 and p = 0.025, respectively). (E) Microglia signal measured by Iba1 relative intensity showed no significant age group differences. (F, H) Linear regression analysis for PNN/mm2 (F) and Iba1 relative intensity (H) showed no significant correlation with age (R2 = 0.056, p = 0.24; R2 = 0.095, p = 0.124, respectively). (G, I) PNN exhibited an earlier inflection age (3.25 months) than microglia (12.78 months) in degu EC. (J) Normalized PNN/mm2 and Iba1 relative intensity 2D space highlighted a juvenile degu (yellow arrow) exhibiting adult-like PNN levels. Error bars represent SEM; Kruskal–Wallis test followed by post-hoc Dunn's test: trendp < 0.1, *p < 0.05.
Figure 4
Figure 4
Degu retrosplenial cortex (RSC) exhibits decreasing levels of microglia with age while perineuronal nets (PNNs) are significantly decreased in juvenile degus compared to older counterparts. (A–C) Immunofluorescence confocal micrographs showing PNNs (WFA, green) and microglia (Iba1, red) in the RSC of 1–3 m.o. (juvenile) (A1, B1, C1), 5–8 m.o. (adolescent) (A2, B2, C2), 12–19 m.o. (younger adult) (A3, B3, C3), and 23–40 m.o. (older adult) (A4, B4, C4) degus. (D) PNN density quantification showed a significant difference between 1–3 m.o. degus and 5–8 m.o./23–40 m.o. degus (p = 0.003 and p = 0.01, respectively). (E) 12–19 m.o. degus showed significantly less microglia signal than 1–3 m.o. and 5–8 m.o. degu RSC (p = 0.002, and p = 0.006, respectively). (F, H) Linear regression analysis of PNN densities with age (F) reveals a statistically trending positive correlation (R2 = 0.098; p = 0.091), while Iba1 relative intensity (H) exhibited a significant negative correlation (R2 = 0.281; p = 0.002). (G, I) PNNs possess an earlier sigmoid inflection age (5.05 months) than microglia (11.42 months) in the degu RSC. (J) Normalized PNN and Iba1 relative intensity 2D space showed substantial intermixing between post-puberty (5–40 m.o.) degu age groups. Error bars represent SEM; Kruskal–Wallis test followed by post-hoc Dunn's test: trendp < 0.1, *p < 0.05, **p < 0.01.
Figure 5
Figure 5
The degu primary somatosensory cortex (S1) exhibits a unique pattern of laminar perineuronal net (PNN) expression and is most plastic during pre-pubescence. (A) Confocal micrographs show PNNs (WFA, green) and microglia (Iba1, red) in S1's layer 4 from 1–3 m.o. (juvenile) (A1), 5–8 m.o. (adolescent) (A2), 12–19 m.o. (younger adult) (A3), and 23–40 m.o. (older adult) (A4) degus. (B) Representative immunofluorescent overviews of S1-containing coronal hemispheres in 1–3 m.o. (B1), 5–8 m.o. (B2), 12–19 m.o. (B3), and 23–40 m.o. (B4) degus. (C) Confocal micrograph zoom-in views from boxed areas in (B) depicting S1 cortical layers (PNN in green, DAPI in blue). (D) S1 layer-specific PNN/mm2 quantification for each degu age group. PNN densities were most elevated in deep S1 layers. (E) PNN quantification across all layers identified a significant difference between 1–3 m.o. degus and 5–8 m.o./23–40 m.o. degus (p = 0.004 and p = 0.0002, respectively). (F) PNN linear regression with age showed a significant positive correlation (R2 = 0.257; p = 0.003). (H) 1–3 m.o. degus possess greater microglia levels than 5–8 m.o., 12–19 m.o., and 23–40 m.o. degu S1 (p = 0.024, p = 0.005, and p = 0.001 respectively). (I) Iba1 relative intensity showed a significant negative correlation with age (R2 = 0.309; p = 0.0009). (G, J) Sigmoid data curve fittings revealed PNNs have an earlier inflection age (3.44 months) than microglia (4.99 months) in degu S1. (K) 2D plots of normalized S1 PNN/mm2 and microglia Iba1 levels showed substantial overlap between 5–40 m.o. degus. (L) Inter-group S1 layer analysis shows juvenile degus have significantly lower PNN levels than their older counterparts in all S1 layer except L1, which exhibited minimal-to-no PNNs. Error bars represent SEM; Kruskal–Wallis test followed by post-hoc Dunn's test: trendp < 0.1, *p < 0.05, **p < 0.01, ***p < 0.001, ****p < 0.0001.
Figure 6
Figure 6
Degus possess a distinct hippocampal perineuronal net (PNN) expression pattern characterized by intense CA3a signal and minimal-to-no signal in CA1. (A–E) Immunofluorescence confocal micrographs showing PNNs (WFA, green) and microglia (Iba1, red) in the entire dorsal hippocampus (A), CA3a (B, C), and CA1 (E) of 1–3 m.o. (juvenile, 1st row), 5–8 m.o. (adolescent, 2nd row), 12–19 m.o. (younger adult, 3rd row), and 23–40 m.o. (older adult, 4th row) degus. (F) PNN density quantification showed a significant difference between 1–3 m.o. degus and 5–8 m.o. degus (p = 0.029). (G) 1–3 m.o. degus exhibit increased CA3a microglia Iba1 relative intensity than 12–19 m.o. counterparts (p = 0.0005). (H, I) Linear regression analysis found a statistically trending positive correlation between PNN/mm2 and age [(H), R2 = 0.1; p = 0.093], while Iba1 relative intensity had a significant negative correlation with age [(I), R2 = 0.24; p = 0.0059]. (J, K) Sigmoid curve analysis revealed PNNs have an earlier inflection age (3.19 months) than microglia (7.02 months) in degu CA3a. (L) Normalized PNN/mm2 and Iba1 relative intensity 2D plot revealed some 1–3 m.o. degus express increased PNN levels in CA3a and clustered closer to post-puberty age groups. (M) Age group analysis showed 12–19 m.o. degu have significantly lower CA1 Iba1 relative intensity levels than 1–3 m.o. degus. (N) Linear regression analysis found no significant correlation between CA1 microglia Iba1 intensity and age. Error bars represent SEM; Kruskal–Wallis test followed by post-hoc Dunn's test: trendp < 0.1, *p < 0.05, **p < 0.01, ***p < 0.001.
Figure 7
Figure 7
Degu subiculum (SUB) exhibits decreasing levels of microglia with age and similar microglia and perineuronal net (PNN) plasticity timecourse inflection ages. (A–C) Confocal micrographs showing PNNs (WFA, green) and microglia (Iba1, red) in the SUB of 1–3 m.o. (juvenile) (A1, B1, C1), 5–8 m.o. (adolescent) (A2, B2, C2), 12–19 m.o. (younger adult) (A3, B3, C3), and 23–40 m.o. (older adult) (A4, B4, C4) degus. (D) PNNs per mm2 quantification identified a significant difference between 1–3 m.o. degus and 5–8 m.o. degus (p = 0.0052). (E) 1–3 m.o. degus showed increased SUB microglia signal when compared to 5–8 m.o./12–19 m.o. degus (p = 0.016, p = 0.0002, and p = 0.02 respectively). (F, H) Linear regression analysis found no significant correlation between PNN/mm2 and age [(F), R2 = 0.02; p = 0.439] while Iba1 relative intensity exhibited a statistical trend toward a negative correlation [(H), R2 = 0.095; p = 0.091]. (G, I) Sigmoid curve analysis revealed SUB exhibits similar PNN (3.84) and microglia (4.15) inflection ages, unlike what is seen in most of the other analyzed brain regions. (J) Normalized individual data points for 1–40 m.o. degus in PNN/mm2 and Iba1 relative intensity space showed some intermixing between all age groups. Error bars represent SEM; Kruskal–Wallis test followed by post-hoc Dunn's test: trendp < 0.1, *p < 0.05, **p < 0.01, ***p < 0.001.
Figure 8
Figure 8
Degu basolateral amygdala (BLA) shows no age-related perineuronal net (PNNs) changes, while microglia decrease with age progression. (A–C) Immunofluorescence confocal micrographs of PNNs (WFA, green) and microglia (Iba1, red) in the BLA of 1–3 m.o. (juvenile) (A1, B1, C1), 5–8 m.o. (adolescent) (A2, B2, C2), 12–19 m.o. (younger adult) (A3, B3, C3), and 23–40 m.o. (older adult) (A4, B4, C4) degus. (D) Quantification of PNN densities found no significant differences between age groups. (E) 12–19 m.o. degus showed significantly decreased microglia signal measured by Iba1 relative intensity than younger 1–3 m.o. and 5–8 m.o. age groups (p = 0.0005 and p = 0.016, respectively). (F, H) Linear regression analysis found no significant correlation between PNN/mm2 (F) and age progression (R2 = 0.0087; p = 0.61), while Iba relative intensity (H) exhibited a significant negative correlation (R2 = 0.1277; p = 0.048). (G, I) PNN sigmoid inflection age (1 month) occurred earlier than microglia (11.49 months) in the BLA. (J) Normalized PNN/mm2 and Iba1 relative intensity 2D plot from 1–40 m.o. degus shows extensive intermixing between all age groups. Error bars represent SEM; Kruskal–Wallis test followed by post-hoc Dunn's test: trendp < 0.1, *p < 0.05, ***p < 0.001.
Figure 9
Figure 9
Degu thalamic reticular nucleus (TRN) exhibits decreasing microglia levels with age and differing perineuronal net (PNN) densities between juvenile and adolescent life phases. (A–C) Confocal micrographs showing PNNs (WFA, green), microglia (Iba1, red), and parvalbumin+ interneurons (PV, blue) in the TRN of 1–3 m.o. (juvenile) (A1, B1, C1), 5–8 m.o. (adolescent) (A2, B2, C2), 12–19 m.o. (younger adult) (A3, B3, C3), and 23–40 m.o. (older adult) (A4, B4, C4) degus. (D) PNN quantification found a significant difference between 1–3 m.o. and 5–8 m.o. degus (p = 0.003). (E) 1–3 m.o. degu TRN showed increased microglia levels than 12–19 m.o. degu TRN (p = 0.02). (F, H) Linear regression analysis of PNN/mm2 (F) and Iba1 relative intensity (H) with degu age. PNN/mm2 showed no significant correlation with age (R2 = 0.0002; p = 0.933) while Iba1 relative intensity exhibited a significant negative correlation with age (R2 = 0.183; p = 0.016). (G, I) Sigmoid data curve fittings identified an earlier PNN inflection age (1 month) than microglia (7.84 months) in the degu's TRN. (J) Normalized PNN/mm2 and Iba1 relative intensity 2D space displayed extensive intermixing between post-puberty age groups and some mixing between 1–3 m.o. and 5–8 m.o. degus. Error bars represent SEM; Kruskal–Wallis test followed by post-hoc Dunn's test: trendp < 0.1, *p < 0.05, **p < 0.01.
Figure 10
Figure 10
The maturing degu forebrain exhibits differing neuroplasticity features in juvenile, adolescent, and adult life stages. (A) Normalized perineuronal net (PNN) densities and microglia Iba1 relative intensities in 1–40 m.o. degus across the investigated brain regions. (B) Summary matrix with statistically significant PNN/mm2 and Iba1 relative intensity age group differences across brain regions. All significant PNN differences involved comparisons with juvenile (1–3 m.o.) degus, while microglia showed some differences between adolescent (5–8 m.o.) and younger adult (12–19 m.o.) groups. Box colors indicate direction of change with increasing age (blue—increase; red—decrease), and intensity of color denotes p-value range (Kruskal–Wallis test followed by post-hoc Dunn's test). (C) Summary of sigmoid curve inflection ages for PNN densities and microglia Iba1 intensities. PNN inflection ages were significantly younger than microglia inflection ages across the studied brain regions (p = 0.0011, Mann–Whitney test). Early microglia transition regions, SUB and S1, are denoted with triangles, while late microglia transition regions, PrL and EC, are denoted with squares. (D) Principal component analysis (PCA) of 1–40 m.o. degu PNN densities and microglia Iba1 relative intensities reveal juvenile degus (1–3 m.o) cluster separately from post-puberty (5–40 m.o.) degus. Adolescents and younger adults showed small territorial overlap between them, while older adult (23–40 m.o.) degus spanned a larger region overlapping with adolescent and younger adult degus (D1). The top two principal components used to plot PCA data, with eigenvalues of 4.67 and 2.34 (D2), accounted for >70% of the dataset variance (D3). Euclidean distance analysis (D4) on PCA data shows juvenile, adolescent, and younger adult age group clusters have significantly smaller (p = 0.0001, p = 0.0003, p = 0.01, Mann–Whitney test) distances from their assigned (intragroup) age group's centroid than from that of other age groups (intergroup), highlighting the distinct juvenile to younger adult age clusters identified by PCA. Older degus showed no significant difference between intra- and intergroup Euclidean distances (p = 0.136, Mann–Whitney test). Error bars represent SEM; trendp < 0.1, *p < 0.05, **p < 0.01, ***p < 0.001, ****p < 0.0001.

Similar articles

Cited by

References

    1. Akers K. G., Martinez-Canabal A., Restivo L., Yiu A. P., De Cristofaro A., Hsiang H.-L., et al. . (2014). Hippocampal neurogenesis regulates forgetting during adulthood and infancy. Science 344, 598–602. 10.1126/science.1248903 - DOI - PubMed
    1. Andersen P., Morris R., Amaral D., Bliss T., O'Keefe J. (eds) (2006). The Hippocampus Book. Oxford: Oxford University Press. 10.1093/acprof:oso/9780195100273.001.0001 - DOI
    1. Appelbaum L. G., Shenasa M. A., Stolz L., Daskalakis Z. (2023). Synaptic plasticity and mental health: methods, challenges and opportunities. Neuropsychopharmacology 48, 113–120. 10.1038/s41386-022-01370-w - DOI - PMC - PubMed
    1. Ardiles A. O., Ewer J., Acosta M. L., Kirkwood A., Martinez A. D., Ebensperger L. A., et al. . (2013). Octodon degus (Molina 1782): a model in comparative biology and biomedicine. Cold Spring Harb. Protoc. 2013, 312–318. 10.1101/pdb.emo071357 - DOI - PMC - PubMed
    1. Avino T. A., Barger N., Vargas M. V., Carlson E. L., Amaral D. G., Bauman M. D., et al. . (2018). Neuron numbers increase in the human amygdala from birth to adulthood, but not in autism. Proc. Natl. Acad. Sci. U. S. A. 115, 3710–3715. 10.1073/pnas.1801912115 - DOI - PMC - PubMed