

Compound Risk of Air Pollution and Heat Days and the Influence of Wildfire by SES across California, 2018-2020: Implications for Environmental Justice in the Context of Climate Change
- PMID: 38456148
- PMCID: PMC10919222
- DOI: 10.3390/cli10100145
Compound Risk of Air Pollution and Heat Days and the Influence of Wildfire by SES across California, 2018-2020: Implications for Environmental Justice in the Context of Climate Change
Abstract
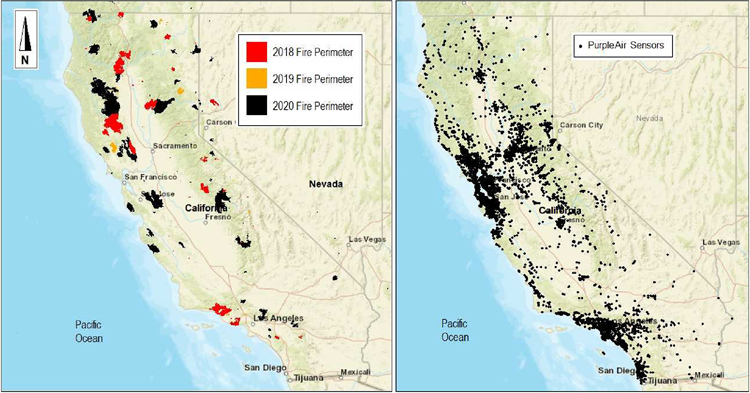
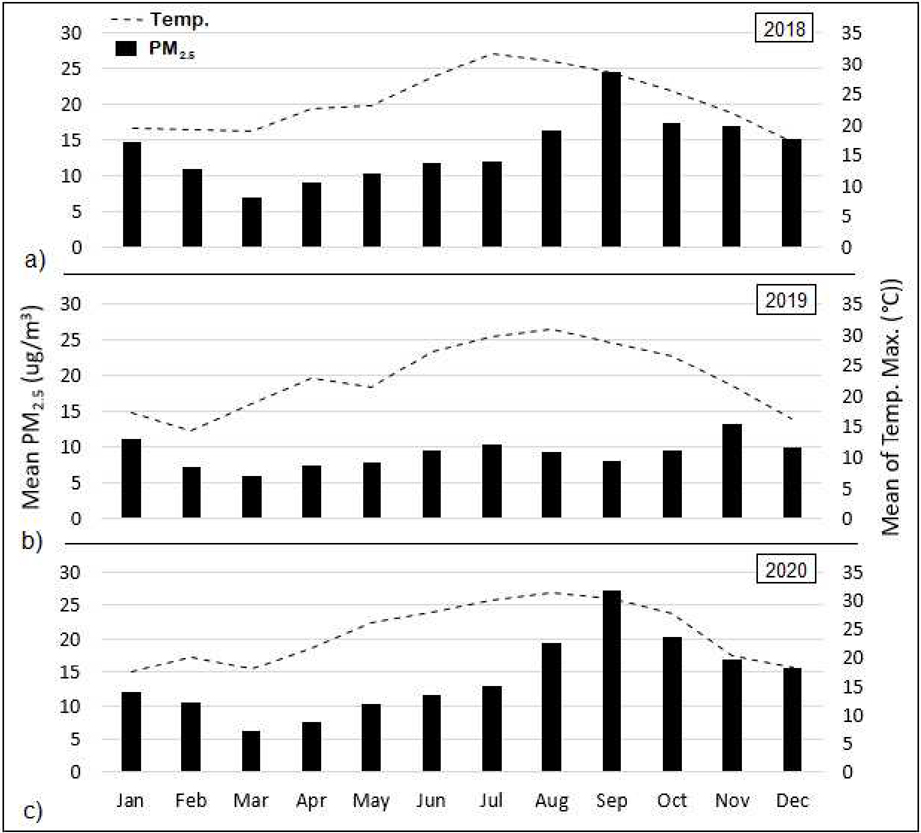
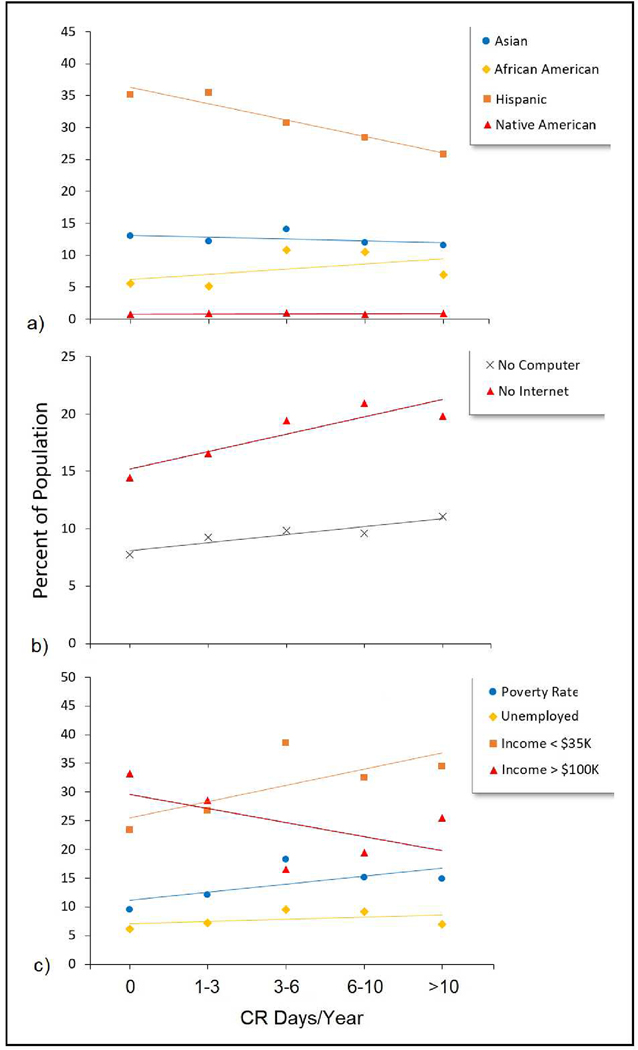
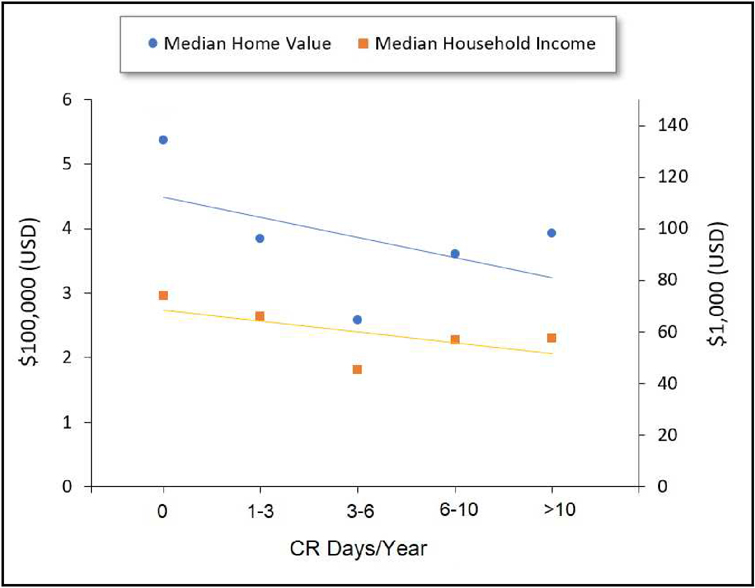
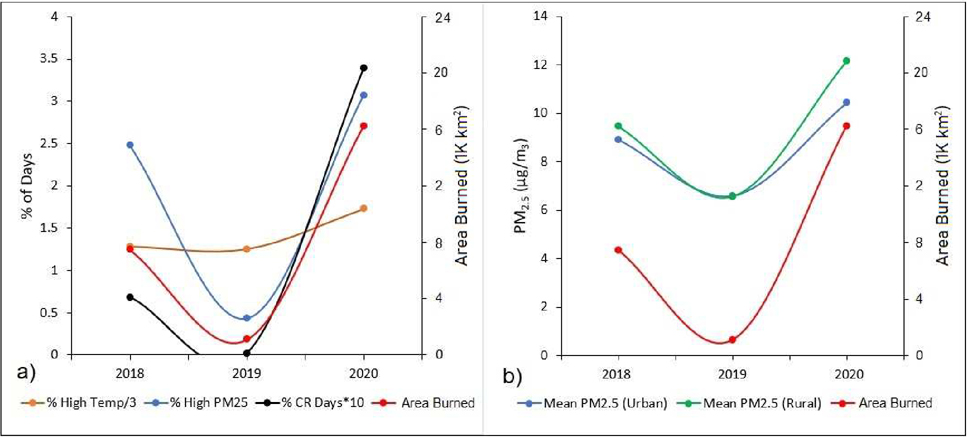
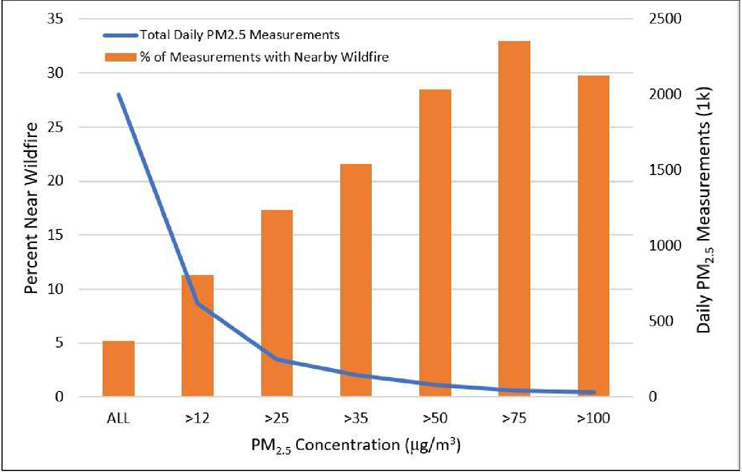
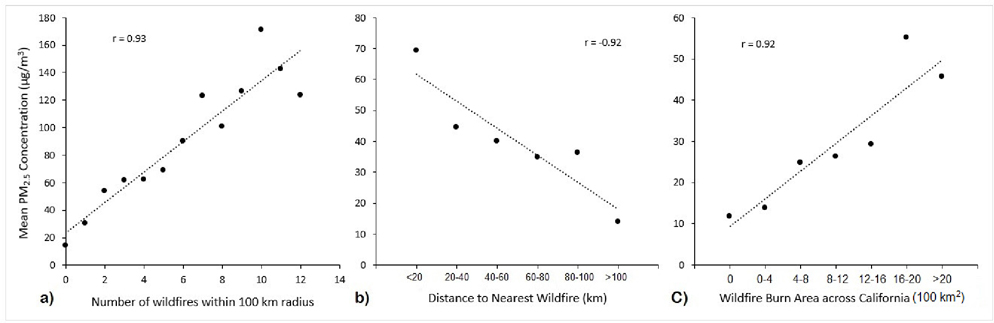
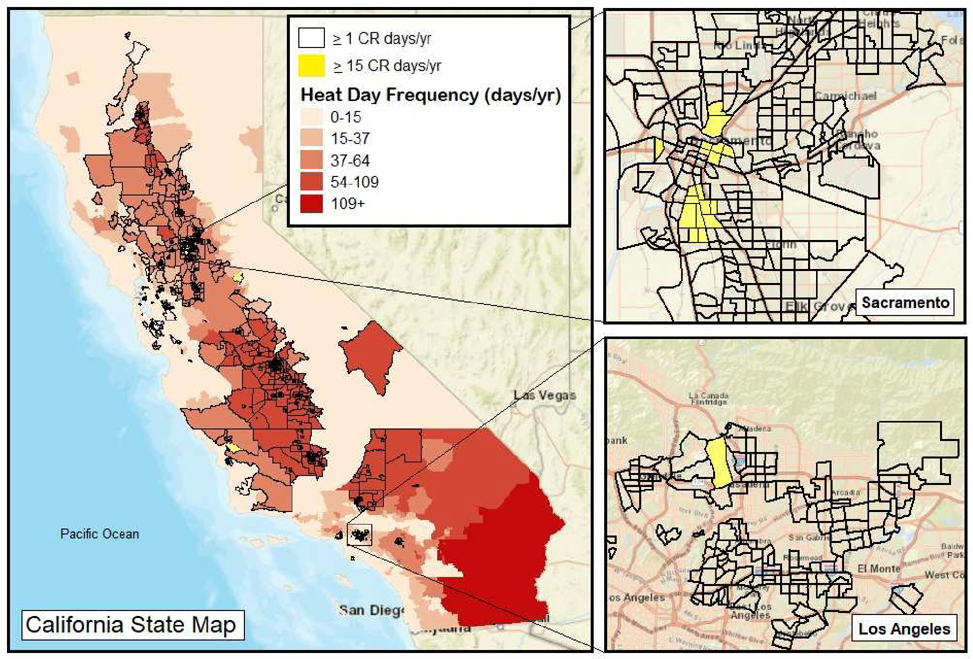
Major wildfires and heatwaves have begun to increase in frequency throughout much of the United States, particularly in western states such as California, causing increased risk to public health. Air pollution is exacerbated by both wildfires and warmer temperatures, thus adding to such risk. With climate change and the continued increase in global average temperatures, the frequency of major wildfires, heat days, and unhealthy air pollution episodes is projected to increase, resulting in the potential for compounding risks. Risks will likely vary by region and may disproportionately impact low-income communities and communities of color. In this study, we processed daily particulate matter (PM) data from over 18,000 low-cost PurpleAir sensors, along with gridMET daily maximum temperature data and government-compiled wildfire perimeter data from 2018-2020 in order to examine the occurrence of compound risk (CR) days (characterized by high temperature and high PM2.5) at the census tract level in California, and to understand how such days have been impacted by the occurrence of wildfires. Using American Community Survey data, we also examined the extent to which CR days were correlated with household income, race/ethnicity, education, and other socioeconomic factors at the census tract level. Results showed census tracts with a higher frequency of CR days to have statistically higher rates of poverty and unemployment, along with high proportions of child residents and households without computers. The frequency of CR days and elevated daily PM2.5 concentrations appeared to be strongly related to the occurrence of nearby wildfires, with over 20% of days with sensor-measured average PM2.5 > 35 μg/m3 showing a wildfire within a 100 km radius and over two-thirds of estimated CR days falling on such days with a nearby wildfire. Findings from this study are important to policymakers and government agencies who preside over the allocation of state resources as well as organizations seeking to empower residents and establish climate resilient communities.
Keywords: PM2.5; air pollution; climate change; compound risk; heatwaves; purpleair.
Conflict of interest statement
Conflicts of Interest: The authors declare no conflict of interest.
Figures
Similar articles
-
Environmental justice analysis of wildfire-related PM2.5 exposure using low-cost sensors in California.Sci Total Environ. 2023 Jan 15;856(Pt 2):159218. doi: 10.1016/j.scitotenv.2022.159218. Epub 2022 Oct 5. Sci Total Environ. 2023. PMID: 36206902
-
Disproportionate Impacts of Wildfires among Elderly and Low-Income Communities in California from 2000-2020.Int J Environ Res Public Health. 2021 Apr 8;18(8):3921. doi: 10.3390/ijerph18083921. Int J Environ Res Public Health. 2021. PMID: 33917945 Free PMC article.
-
Impact of 4th of July Fireworks on Spatiotemporal PM2.5 Concentrations in California Based on the PurpleAir Sensor Network: Implications for Policy and Environmental Justice.Int J Environ Res Public Health. 2021 May 27;18(11):5735. doi: 10.3390/ijerph18115735. Int J Environ Res Public Health. 2021. PMID: 34071796 Free PMC article.
-
Air pollution from wildfires and human health vulnerability in Alaskan communities under climate change.Environ Res Lett. 2020 Sep;15(9):094019. doi: 10.1088/1748-9326/ab9270. Epub 2020 Aug 19. Environ Res Lett. 2020. PMID: 34413900 Free PMC article.
-
The Minderoo-Monaco Commission on Plastics and Human Health.Ann Glob Health. 2023 Mar 21;89(1):23. doi: 10.5334/aogh.4056. eCollection 2023. Ann Glob Health. 2023. PMID: 36969097 Free PMC article. Review.
Cited by
-
Applying a two-stage generalized synthetic control approach to quantify the heterogeneous health effects of extreme weather events: A 2018 large wildfire in California event as a case study.Environ Epidemiol. 2024 Dec 31;9(1):e362. doi: 10.1097/EE9.0000000000000362. eCollection 2025 Feb. Environ Epidemiol. 2024. PMID: 39744585 Free PMC article.
-
Joint Effects of Wildfire Smoke and Extreme Heat on Hospitalizations in California, 2011-2020.Geohealth. 2025 Jun 6;9(6):e2024GH001237. doi: 10.1029/2024GH001237. eCollection 2025 Jun. Geohealth. 2025. PMID: 40486180 Free PMC article.
-
Coexposure to extreme heat, wildfire burn zones, and wildfire smoke in the Western US from 2006 to 2020.Sci Adv. 2025 May 2;11(18):eadq6453. doi: 10.1126/sciadv.adq6453. Epub 2025 Apr 30. Sci Adv. 2025. PMID: 40305597 Free PMC article.
-
Climate change and health: rethinking public health messaging for wildfire smoke and extreme heat co-exposures.Front Public Health. 2024 Mar 25;12:1324662. doi: 10.3389/fpubh.2024.1324662. eCollection 2024. Front Public Health. 2024. PMID: 38590812 Free PMC article. Review.
-
The association of short-term increases in ambient PM2.5 and temperature exposures with stillbirth: racial/ethnic disparities among Medicaid recipients.Am J Epidemiol. 2024 Oct 7;193(10):1372-1383. doi: 10.1093/aje/kwae083. Am J Epidemiol. 2024. PMID: 38770979 Free PMC article.
References
-
- MassonDelmotte V; Zhai AP; Pirani SL; Connors C; Péan S; Berger N; Caud Y; Chen L; Goldfarb MI; Gomis M; et al. IPCC, 2021: Summary for Policymakers. In Climate Change 2021: The Physical Science Basis. Contribution of Working Group I to the Sixth Assessment Report of the Intergovernmental Panel on Climate Change; Cambridge University Press: Cambridge, UK, 2021.
-
- Abasilim C; Friedman LS Comparison of health outcomes from heat—related injuries by National Weather Service reported heat wave days and non—heat wave days—Illinois, 2013–2019. Int. J. Biometeorol. 2022, 66, 641–645. - PubMed