. 2024 Apr 12;134(8):990-1005.
doi: 10.1161/CIRCRESAHA.123.323826. Epub 2024 Mar 8.

Rewiring Endothelial Sphingolipid Metabolism to Favor S1P Over Ceramide Protects From Coronary Atherosclerosis

Affiliations

Rewiring Endothelial Sphingolipid Metabolism to Favor S1P Over Ceramide Protects From Coronary Atherosclerosis

Onorina L Manzo et al. Circ Res. .

Abstract

Background: Growing evidence correlated changes in bioactive sphingolipids, particularly S1P (sphingosine-1-phosphate) and ceramides, with coronary artery diseases. Furthermore, specific plasma ceramide species can predict major cardiovascular events. Dysfunction of the endothelium lining lesion-prone areas plays a pivotal role in atherosclerosis. Yet, how sphingolipid metabolism and signaling change and contribute to endothelial dysfunction and atherosclerosis remain poorly understood.

Methods: We used an established model of coronary atherosclerosis in mice, combined with sphingolipidomics, RNA-sequencing, flow cytometry, and immunostaining to investigate the contribution of sphingolipid metabolism and signaling to endothelial cell (EC) activation and dysfunction.

Results: We demonstrated that hemodynamic stress induced an early metabolic rewiring towards endothelial sphingolipid de novo biosynthesis, favoring S1P signaling over ceramides as a protective response. This finding is a paradigm shift from the current belief that ceramide accrual contributes to endothelial dysfunction. The enzyme SPT (serine palmitoyltransferase) commences de novo biosynthesis of sphingolipids and is inhibited by NOGO-B (reticulon-4B), an ER membrane protein. Here, we showed that NOGO-B is upregulated by hemodynamic stress in myocardial EC of ApoE-/- mice and is expressed in the endothelium lining coronary lesions in mice and humans. We demonstrated that mice lacking NOGO-B specifically in EC (Nogo-A/BECKOApoE-/-) were resistant to coronary atherosclerosis development and progression, and mortality. Fibrous cap thickness was significantly increased in Nogo-A/BECKOApoE-/- mice and correlated with reduced necrotic core and macrophage infiltration. Mechanistically, the deletion of NOGO-B in EC sustained the rewiring of sphingolipid metabolism towards S1P, imparting an atheroprotective endothelial transcriptional signature.

Conclusions: These data demonstrated that hemodynamic stress induced a protective rewiring of sphingolipid metabolism, favoring S1P over ceramide. NOGO-B deletion sustained the rewiring of sphingolipid metabolism toward S1P protecting EC from activation under hemodynamic stress and refraining coronary atherosclerosis. These findings also set forth the foundation for sphingolipid-based therapeutics to limit atheroprogression.

Keywords: atherosclerosis; endothelial cells; hemodynamics; macrophages; sphingolipids.


Conflict of interest statement

Disclosures None.

Figures

Figure 1.
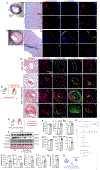
Figure 1.. NOGO-B expression in coronary plaques of humans and mice.
(A,B) Representative images of immunofluorescence staining for NOGO-B of paraffin sections of human coronary lesions. (Aa) Hematoxylin and eosin (H&E) staining of human coronary plaque showing the necrotic core (NC) and fibrous cap (FC). (Ab,f) High magnification of H&E staining and (Ac-e, g-f) immunofluorescent staining for NOGO-B in consecutive sections of human coronary lesions in Aa. (Ac-e) NOGO-B is expressed in EC stained for CD31 (green) and some cells of the neointima. (Ba) H&E staining of human coronary plaque. (Ba, f) High magnification of the H&E staining and (Bc-e, g-f) IF staining of CD31+ EC expressing NOGO-B (arrowheads). (C) Mouse model of coronary atherosclerosis. Male and female ApoE−/− mice were subjected to TAC or sham surgery, and 8 weeks later the hearts were sectioned from the base to the apex to assess atherosclerotic lesions in the LAD artery. (D) Consecutive myocardial sections were stained with oil-red-O/hematoxylin and immunofluorescent antibody against NOGO-B, isolectin B4 (green, marker of EC), α-smooth muscle actin (green, marker of smooth muscle cells), CD68 (green, monocyte/macrophage marker), DAPI (nuclei, blue). Oil red-O/hematoxylin-stained images show the LAD affected by different degree of atherosclerosis. Scale bar: 100 μm. (E) Male and female ApoE−/− mice underwent to TAC or sham surgery. After 7 days, WB analysis and sphingolipid measurements were performed on myocardial EC. (F) WB analysis and quantification of (G) NOGO-B, (H) ORMDLs, (I) SPTLC1 and (J) SPTLC2 in myocardial EC isolated from 7-days TAC- (n=5) or sham-operated (n=3) mice. Band intensities were normalized to red ponceau. Statistical significance was assessed by Mann Whitney test. Measurements of (K) dhSph, (L) dhSph-1P, (M) dhCer-16:0, (N) total ceramides, (O) Sph, and (P) S1P in myocardial EC isolated from 7-days TAC- (n=6) or sham-operated (n=3) mice. (Q) Ratio of S1P/total ceramides. (K-Q) Statistical significance was assessed by using Mann Whitney test. (R) Scheme of the de novo sphingolipid pathway representing the changes in sphingolipids; (S) Schematic representation of S1P/ceramide ratio in EC at 7 days post-TAC vs. sham-operated mice. (G-J, K-Q) Data are expressed as mean ± SEM. Sptlc1, serine palmitoyltransferase long chain base subunit 1; Sptlc2, serine palmitoyltransferase long chain base subunit 2; dhSph, dihydrosphingosine; dhSph-1P, dihydrosphingosine-1-phosphate; dhCer-16:0, dihydroceramide-16:0; Sph, sphingosine; S1P, sphingosine-1-phosphate.
Figure 2.
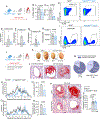
Figure 2.. Endothelial Nogo-B deletion protects the mice from coronary atherosclerosis.
(A). Scheme of the experimental model. ApoE−/− mice were crossed with floxed-Nogo-A/B VE-cadherin CRE to delete Nogo-B specifically in EC (hereafter referred to as Nogo-A/BECKOApoE−/−). Mice floxed-Nogo-A/B VE-cadherin CRE- ApoE−/− were used as control (hereafter referred to as ApoE−/−). (B, C) Percentage of VCAM+ EC from the hearts of ApoE−/− (n=6) and Nogo-A/BECKOApoE−/− (n=7) at 7days post-TAC, and (D) representative images of VCAM1+ EC FACS analysis plot. Statistical significance was determined by unpaired t-test (B, C). (E, F, G) RTPCR of inflammatory genes in myocardial EC isolated from sham (n=4) or TAC-operated mice (ApoE−/− n=6–7; Nogo-A/BECKOApoE−/− n=6–7) 3–5 days post-surgery. Statistical significance was determined by Kruskal-Wallis followed by Dunn’s multiple comparison test. (H) FACS analysis of leukocytes in the hearts of ApoE−/− (n=6) and Nogo-A/BECKOApoE−/− (n=7) at 7 days post-TAC. Statistical significance was assessed with unpaired t-test. (I) Representative images of CD45+ FACS analysis plots. (J) Scheme experimental design. At 8-week post-TAC, ApoE−/− and Nogo-A/BECKOApoE−/− LAD lesions were analyzed throughout the heart. (K) Images of hearts from sham and TAC-operated mice at 8 weeks post-surgery. The arrows indicate lipid accumulation (atherosclerotic lesions) in the LAD of ApoE−/−, and milder in the LAD of Nogo-A/BECKOApoE−/− hearts. (L) Oil-red O/hematoxylin staining show initial lipid accumulation in the intima and some SMC of the LAD without stenosis (left panel) and images of atherosclerotic lesions of the LAD with marked stenosis (center and right panels). (M) Quantification of the occurrence of LAD lesions without and with stenosis in ApoE−/− and Nogo-A/BECKO ApoE−/− mice at 8 weeks post-TAC. Statical significance was assessed by binomial test, method Wilson/Brown. (N) Quantification and mapping of the LAD stenosis in 8-weeks TAC-operated ApoE−/− (n=19) and Nogo-A/BECKOApoE−/− (n=16) mice. Myocardial sections were stained with oil red-O/hematoxylin and LAD stenosis were measured throughout the hearts as detailed in Methods. The x-axis shows the distance from the aortic valve considered as referent point (0 mm) towards the apex. (O) Bar graph represents the area under the curve of LAD stenosis in both groups. (P) Representative images of oil-red-O/hematoxylin-stained LAD lesions from ApoE−/− and Nogo-A/BECKOApoE−/− hearts.(Q) Quantification of oil-red-O staining expressed as percentage of the plaque area, in 8-week TAC-operated ApoE−/− (n=19) and Nogo-A/BECKOApoE−/− (n=16) mice. (R) Bar graph representing the area under the curve of Oil-red-O staining in LAD plaques in both groups. Data are expressed as mean ± SEM. Statistical significance was assessed by unpaired t-test (O,R). (S) Cholesterol levels measured in the plasma of C57Bl6 (n=5), ApoE−/− (n=18) and Nogo-A/BECKOApoE−/− (n=13) mice. Statistical significance was assessed by one-way ANOVA by Tukey’s multiple comparison test. (B, C, E-H, O,R,S) Data are expressed as mean ± SEM. Scale bar: 50 μm.
Figure 3.
Figure 3.. Cardiac function and survival rate were improved in ApoE−/− mice deleted of endothelial NOGO-B.
(A) Representative images of 2-dimensional guided M-mode echocardiography of the left ventricle (LV) in 8 weeks post-TAC and sham of Nogo-A/BECKOApoE−/− and ApoE−/− mice. Graphs derived from echocardiographic analysis of (B) LV end-diastolic diameter (LVDd), (C) LV end systolic (LVDs) diameter, and (D) fractional shortening (FS). n ≥ 15/group. Statistical significance was determined by two-way ANOVA followed by Tukey’s multiple comparison test. (E) Kaplan-Meier curve showing the percentage of survival of ApoE−/− and Nogo-A/BECKOApoE−/− mice (n=23/group), at different time post-TAC. Statical significance was assessed by Gehan-Breslow-Wilcoxon test. Plasma measurements of (F) S1P, (G) dhS1P, (H) total ceramides and (I-O) specific ceramide species at 8 weeks following sham or TAC surgery. Statistical significance was determined by (F-M) two-way ANOVA followed by Tukey’s multiple comparison test, and (N, O) Mann Whitney test. (B-D, F-O). Data are expressed as mean ± SEM.
Figure 4.
Figure 4.. The loss of endothelial NOGO-B enhanced coronary plaque stability and reduced necrotic core and macrophage infiltration.
(A) Immunofluorescent staining of LAD lesions for collagen-I, ⍺-SMA (SMC, green) and DAPI (nuclei, blue). Fibrous caps indicated with arrowheads in panel h and p. (B) Quantification of the fibrous cap thickness in ApoE−/− (LAD plaques= 15, n=12 mice) and Nogo-A/BECKOApoE−/− (LAD plaques=19; n=13 mice) mice at 8 weeks post-TAC. (C) Representative H&E staining of LAD plaques showing the necrotic core (black dotted lines) and (D) quantification in ApoE−/− (LAD plaques=13; n=6 mice) and Nogo-A/BECKOApoE−/− (LAD lesions=13; n=8 mice) mice at 8-weeks post-TAC. (E) Representative images of immunofluorescent staining for CD68 (monocyte/macrophage, green) indicated by arrowheads, α-SMA (SMC, red), DAPI (blue) and (F) quantification of CD68 area (% of the plaque area) of LAD plaques in ApoE−/− (LAD plaques=11, n= 10 mice) and Nogo-A/BECKOApoE−/− (LAD lesions=16; n=8 mice) mice at 8-weeks post-TAC. Data are expressed as mean ± SEM. Statistical significance was determined by (B) Mann Whitney test and (D,F) unpaired t-test. Scale bar: 50 μm.
Figure 5.
Figure 5.. Endothelial Nogo-B deletion protected the mice from developing atherosclerosis and inflammation in the right carotid artery exposed to high pressure after TAC.
(A) Scheme, after TAC the right carotid artery is exposed to high pressure (HP) and left carotid artery to low pressure (LP). (B) Representative images of left and right carotid arteries from ApoE−/− and Nogo-A/BECKOApoE−/− mice stained with oil red-O at 8-weeks post-TAC. (C) Quantification of oil red-O staining in the ascending aorta and right carotid artery expressed as percentage of total vessel area in ApoE−/− (n=8 mice) and Nogo-A/BECKOApoE−/− (n=6 mice). Statistical significance was assessed with Mann Whitney test. (D-H) At 8-weeks post-TAC, inflammatory cell infiltration of ApoE−/− and Nogo-A/BECKOApoE−/− right carotid arteries was assessed by FACS analysis and cells were expressed as number (D) or percentage of F4/80+ cells (E, G, H) per right carotid artery. Macrophage populations: (D) F4/80+, (E) CCR2+ followed by (F) representative FACS dop plots. (G) CD11b+ and (H) CD206+ cells. (D, E, G, H) Statistical significance was determined by unpaired t-test. (C-E, G, H) Data are expressed as mean ± SEM. CCR2, C-C chemokine receptor type 2; CD11c, cluster differentiation 11c; CD206 cluster differentiation 206 (C-type mannose receptor 1).
Figure 6.
Figure 6.. The loss of NOGO-B suppressed EC activation at early and later time points post-TAC.
(A) Scheme- EC were isolated from 8-weeks TAC- (n=7) or sham-operated (n=6) ApoE−/− mice and measured for sphingolipids by LC/MS/MS. (B) dhSph, (C) dhSph-1P, (D) dhCer-16:0, (E) total ceramides, (F) Sph, (G) S1P, and (H) S1P/ceramide ratio. (B-H) Statistical significance was assessed by using Mann Whitney test. (I) Scheme - EC were isolated from Nogo-A/BECKOApoE−/− and ApoE−/− at 8-weeks post-TAC for sphingolipid measurement. (J) Myocardial EC sphingolipids (dhSph, dhSph-1P, dhCer-16:0, total ceramides, Sph, S1P) and S1P/ceramide ratio in Nogo-A/BECKOApoE−/− EC (n=7) were expressed relative to ApoE−/− EC at 8-weeks post-TAC. Statistical significance was assessed by Kolmogorov-Smirnov test. (K) Scheme of the de novo sphingolipid pathway indicating major species affected by NOGO-B deletion under prolonged hemodynamic stress. (L) Changes in S1P/ceramide ratio in EC lacking NOGO-B exposed to prolonged hemodynamic stress. (M) Volcano plot showing log2 fold of change (x-axis) and the -log10 p-value (y-axis) (upregulated genes are shown in red, p < 0.05, FC > 1; downregulated genes are shown in blue, p < 0.05, FC < −1) in EC isolated from hearts of ApoE−/− and Nogo-A/BECKOApoE−/− mice at 8 weeks post-TAC. N=3 mice per group. (N) Heatmap showing pro- and anti-atherosclerotic genes in FACS sorted EC isolated from hearts of ApoE−/− and Nogo-A/BECKOApoE−/− mice at 8 weeks post-TAC. Genes are ordered from top to bottom based on log2FC of Cre+ vs Cre-. Color of dot represents the zscore of log UMI. The sizes of dots represent the percentage of cells with corresponding gene expression. All genes have Benjamini-Hochberg adjusted p-value < 0.05. (B-H, J) Data are expressed as mean ± SEM.

References

    1. Gimbrone MA Jr. and Garcia-Cardena G. Vascular endothelium, hemodynamics, and the pathobiology of atherosclerosis. Cardiovasc Pathol. 2013;22:9–15. - PMC - PubMed
    1. Hadi HA, Carr CS and Al Suwaidi J. Endothelial dysfunction: cardiovascular risk factors, therapy, and outcome. Vasc Health Risk Manag. 2005;1:183–98. - PMC - PubMed
    1. Gimbrone MA Jr. and Garcia-Cardena G. Endothelial Cell Dysfunction and the Pathobiology of Atherosclerosis. Circ Res. 2016;118:620–36. - PMC - PubMed
    1. Tabas I, Williams KJ and Boren J. Subendothelial lipoprotein retention as the initiating process in atherosclerosis: update and therapeutic implications. Circulation. 2007;116:1832–44. - PubMed
    1. Pober JS and Sessa WC. Evolving functions of endothelial cells in inflammation. Nat Rev Immunol. 2007;7:803–15. - PubMed