Observational Study
. 2024 Aug 1;147(8):2775-2790.
doi: 10.1093/brain/awae056.

The clinical and genetic spectrum of inherited glycosylphosphatidylinositol deficiency disorders

Affiliations
Observational Study

The clinical and genetic spectrum of inherited glycosylphosphatidylinositol deficiency disorders

Jai Sidpra et al. Brain. .

Abstract

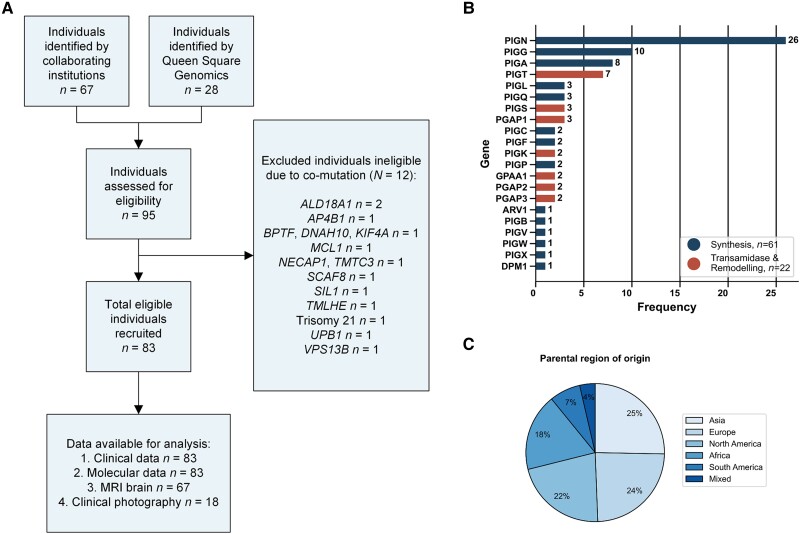
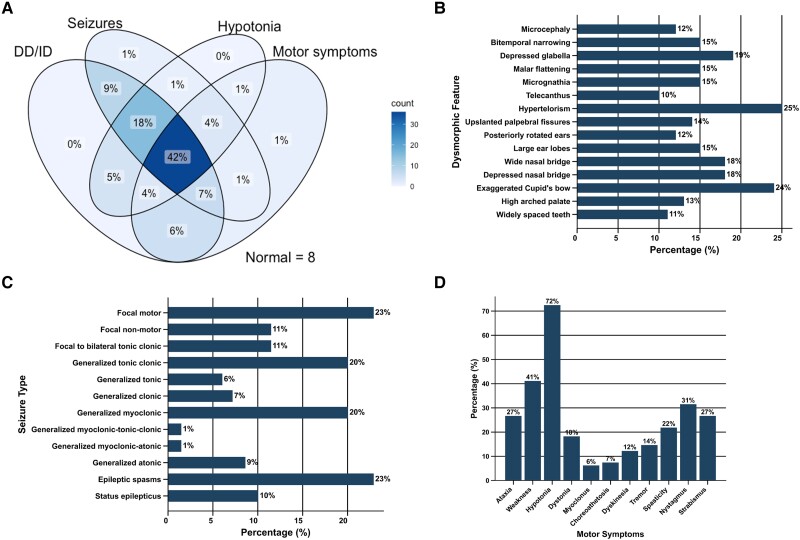
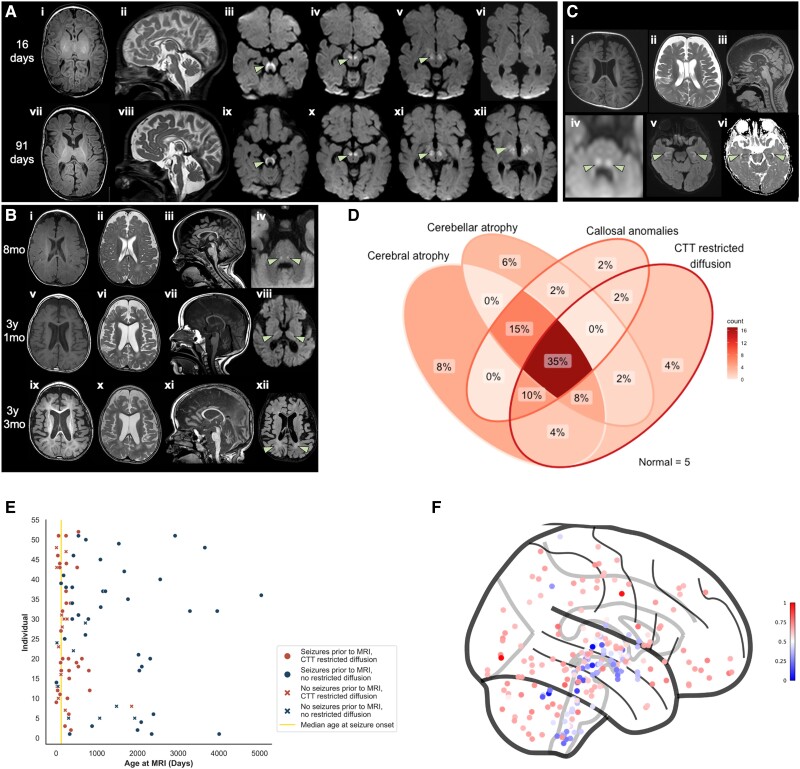
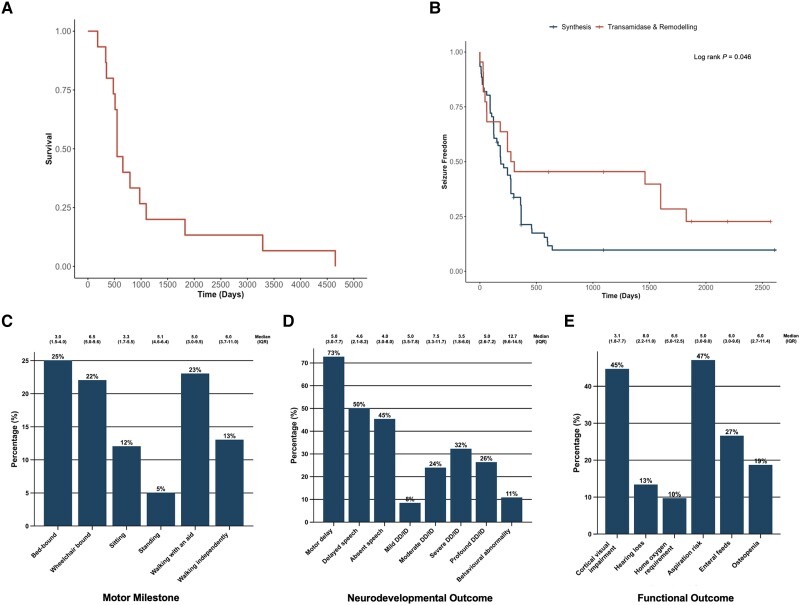
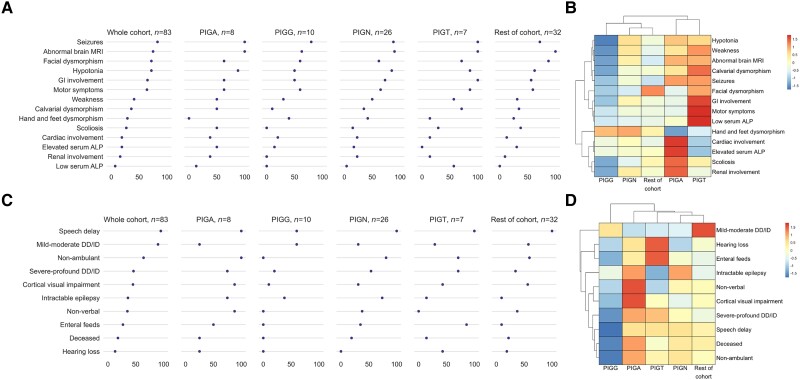
Inherited glycosylphosphatidylinositol deficiency disorders (IGDs) are a group of rare multisystem disorders arising from pathogenic variants in glycosylphosphatidylinositol anchor pathway (GPI-AP) genes. Despite associating 24 of at least 31 GPI-AP genes with human neurogenetic disease, prior reports are limited to single genes without consideration of the GPI-AP as a whole and with limited natural history data. In this multinational retrospective observational study, we systematically analyse the molecular spectrum, phenotypic characteristics and natural history of 83 individuals from 75 unique families with IGDs, including 70 newly reported individuals; the largest single cohort to date. Core clinical features were developmental delay or intellectual disability (DD/ID, 90%), seizures (83%), hypotonia (72%) and motor symptoms (64%). Prognostic and biologically significant neuroimaging features included cerebral atrophy (75%), cerebellar atrophy (60%), callosal anomalies (57%) and symmetric restricted diffusion of the central tegmental tracts (60%). Sixty-one individuals had multisystem involvement including gastrointestinal (66%), cardiac (19%) and renal (14%) anomalies. Though dysmorphic features were appreciated in 82%, no single dysmorphic feature had a prevalence >30%, indicating substantial phenotypic heterogeneity. Follow-up data were available for all individuals, 15 of whom were deceased at the time of writing. Median age at seizure onset was 6 months. Individuals with variants in synthesis stage genes of the GPI-AP exhibited a significantly shorter time to seizure onset than individuals with variants in transamidase and remodelling stage genes of the GPI-AP (P = 0.046). Forty individuals had intractable epilepsy. The majority of individuals experienced delayed or absent speech (95%), motor delay with non-ambulance (64%), and severe-to-profound DD/ID (59%). Individuals with a developmental epileptic encephalopathy (51%) were at greater risk of intractable epilepsy (P = 0.003), non-ambulance (P = 0.035), ongoing enteral feeds (P < 0.001) and cortical visual impairment (P = 0.007). Serial neuroimaging showed progressive cerebral volume loss in 87.5% and progressive cerebellar atrophy in 70.8%, indicating a neurodegenerative process. Genetic analyses identified 93 unique variants (106 total), including 22 novel variants. Exploratory analyses of genotype-phenotype correlations using unsupervised hierarchical clustering identified novel genotypic predictors of clinical phenotype and long-term outcome with meaningful implications for management. In summary, we expand both the mild and severe phenotypic extremities of the IGDs, provide insights into their neurological basis, and vitally, enable meaningful genetic counselling for affected individuals and their families.

Keywords: GPI; congenital disorders of glycosylation; developmental delay; epilepsy; neurodevelopmental disorder; neuroimaging.


Conflict of interest statement

J.S. is supported by Cancer Research UK (City of London Centre Award SEBCATP-2022/100008) and University College London. F.M. is supported by University College London. P.S. and A.R. are supported by PNRR-MUR-M4C2 PE0000006 Research Program ‘MNESYS’: a multiscale, integrated approach to the study of the nervous system in health and disease. Their institute, IRCCS Istituto Giannina Gaslini, is a member EpiCARE. M.S.Z. is supported by the Egypt Science and Technology Developmental Fund (STDF—33650). W.J. has received personal consultancy fees from Roche Products Limited. A.C.J. is supported by a Senior Clinical Investigator Fellowship from the Research Foundation Flanders. A.C.E. is supported by a US National Institutes of Health grant (U54 NS115198). L.M. has received personal consultancy fees from Mendelian Ltd., a rare disease digital health company, outside of the submitted work. A.M. is supported by the UK Medical Research Council (MR/T007087/1), Great Ormond Street Hospital (GOSH) Charity (VS0122), Rosetrees Trust, Wellcome Trust, and Great Ormond Street Hospital National Institute for Health Research Biomedical Research Centre. Outside of the submitted work, A.M. has also received consulting fees from Rocket Pharmaceuticals; honorarium from Jazz Pharmaceuticals; support for attending conferences from Jazz Pharmaceuticals and the European Paediatric Neurology Society; fees for participating on boards for Biogen and Biocodex; serves unpaid roles on the International League Against Epilepsy Genetic Literacy Task Force and EpiCARE; and Chair of Junior Faculty for the Great Ormond Street Hospital National Institute for Health and Care Research Biomedical Research Centre. K.M. provides private medicolegal expertise on instruction by the court and has received personal consultancy fees from The Cromwell Hospital, HCA Healthcare UK, European Society of Paediatric Neuroradiology, Society of Pediatric Neuroimaging, and the UK Crown Court, outside of the submitted work.

On behalf of all authors, the corresponding authors assert that no financial relationships exist with any organizations that might have an interest in the submitted work and that no other relationships or activities exist that could appear to have influenced the submitted work.

Figures

Figure 1
Figure 1
Study flow chart and cohort characteristics. (A) Study flow chart detailing individuals available for analysis and individuals excluded. (B) A total of 83 individuals enrolled in the study, the majority of whom have biallelic variants in PIGN, PIGG, PIGA and PIGT. Raw frequencies are printed on the respective bars. (C) Enrolled individuals show good coverage of all major regions with the majority being of Asian or European descent. Percentage frequencies are presented on the respective segments.
Figure 2
Figure 2
Defining clinical features of the IGDs. (A) Venn diagram of core neurological features (DD/ID, seizures, hypotonia and motor symptoms) shows some sensitivity, with all core symptoms clustering in 42% of affected individuals. (B) Bar chart of dysmorphic features with prevalence >10% across the cohort. The vast majority of features affect <25% of individuals, indicating substantial phenotypic heterogeneity. (C) Bar chart of ILAE seizure types shows that the majority of affected individuals had seizures of generalized onset despite similarly evident heterogeneity. (D) Bar chart of motor symptoms shows core features and further characterises the hyperkinetic spectrum of disordered movement seen in individuals with IGDs, with a subset of individuals exhibiting cerebellar and extrapyramidal signs. In all bar charts, percentage frequencies are presented on the respective bars. DD = developmental delay; ID = intellectual disability; IGD = inherited glycosylphosphatidylinositol deficiency disorders; ILAE = International League Against Epilepsy.
Figure 3
Figure 3
Dysmorphic features and skeletal findings in individuals with IGDs. (A) Clinical photography of individuals with IGDs demonstrates the broad dysmorphic spectrum, with substantial phenotypic heterogeneity. Individual-level annotation for these children is provided in the Supplementary material, ‘Sheet 3’. (B) Skeletal radiographs of individuals with IGDs. (i and ii) 3D surface-rendered CT of the head shows asymmetric bicoronal synostosis resulting in a brachycephalic head shape in an individual with PIGN-IGD aged 11 months. (iiiv) Developmental dysplasia of the hip in two individuals with PIGT-IGD (iii and iv) and PIGB-IGD (v), respectively. An anteroposterior (AP, iii) radiograph shows subluxation of the left and right hips with shallow acetabula and ∼50% and 25% lateral uncovering, respectively. Enlocation is seen on the frog-leg view (iv). (v) AP radiograph shows slender iliac bones, wide ischiopubic synchondroses and subluxation of the femoral heads, with an abnormally rounded appearance. (viviii) Further skeletal findings in the same individual with PIGB-IGD. AP radiographs of the left upper and lower limbs (vi and vii) show mildly slender long bones, whilst an AP radiograph of the right hand (viii) shows phalangeal tuft hypoplasia in digits two to four, central osteolysis of distal phalanx one, and distal aphalangia of digit five. (ixxi) Scoliosis in three individuals with PIGT-IGD (ix), ARV1-IGD (x) and PIGA-IGD (xi), respectively. All images are AP thoracic radiographs. (ix) A levoconvex thoracic scoliosis centred on T10 with a Cobb angle of 62°. (x) A similar C-shaped levoconvex scoliosis with a Cobb angle of ∼23°. (xi) A whole spine levoconvex curve centred on the thoracolumbar junction. (xii and xiii) Midsagittal (xii) and axial (xiii) thoracic CT of the same individual with PIGA-IGD as in xi shows pectus excavatum with significant narrowing of the AP chest diameter (Haller index equal to four) and a bifid right fourth rib (not shown). (xii) An exaggerated whole spine kyphosis with loss of normal lumbar lordosis. IGD = inherited glycosylphosphatidylinositol deficiency disorders. *Reproduced with permission from Efthymiou et al.Clinical video available.
Figure 4
Figure 4
Neuroimaging findings in individuals with IGDs. (A) Sequential brain MRIs of a child with PIGN-IGD aged 16 days (ivi) and 91 days (viixii). Initially, there is thinning of the callosal body with down-sloping of the splenium (ii, sagittal T2-weighted), a small pons and restricted diffusion of the central tegmental tracts, superior cerebellar peduncles, globus pallidus internus, subthalamic nucleus, substantia nigra, posterior limb of the internal capsule and ventral thalamus (arrow in iiivi, axial diffusion-weighted). On follow-up imaging, rapid and progressive frontotemporal-predominant cerebral atrophy (vii, axial T1-weighted) and anterior-predominant cerebellar vermian atrophy (viii, sagittal T2-weighted) are seen. The restricted diffusion is noted to exhibit some resolution caudally but becomes more prominent rostrally (arrow in ixxii, axial diffusion-weighted). (B) Sequential brain MRIs of a second child with PIGN-IGD aged 8 months (mo) (iiv), 3 years 1 month (vviii) and 3 years 3 months (ixxii). Neuroimaging at presentation shows frontal volume loss (i, axial T1-weighted and ii, axial T2-weighted), thinning of the callosal body with a down-sloping splenium (iii, sagittal T1-weighted), anterior-predominant cerebellar vermian atrophy (iii, sagittal T1-weighted) and restricted diffusion of the central tegmental tracts and superior cerebellar peduncles (arrows in iv, axial diffusion-weighted). Follow-up MRIs show progressive frontotemporal volume loss (v, vi, ix and x, axial T1- and T2-weighted), progressive cerebellar atrophy (vii and xi, sagittal T1-weighted), rostral ascent of the restricted diffusion to involve the posterior limb of the internal capsule (arrows in viii, axial diffusion-weighted) and a diffuse periventricular leukodystrophy (arrows in xii, axial T2 fluid-attenuated inversion recovery). A transient mesial temporal diffusion abnormality at 3 years and 1 month of age (not shown) was likely seizure-related. Note the trigonocephalic head shape with metopic synostosis. (C) Brain MRI of a child with PIGA-IGD (Patient PIGA-1) aged 2 months (iiv) shows frontal volume loss (i, axial T1-weighted and ii, axial T2-weighted), thinning of the callosal body and down-sloping of the splenium (iii, sagittal T1-weighted) and more subtle restricted diffusion of the central tegmental tracts (arrows in iv, axial diffusion-weighted). Hippocampal atrophy is also noted (arrows in v, axial T1-weighted, and vi, axial diffusion-weighted). (D) Venn diagram of core neuroimaging findings in individuals with complete MRI: cerebral atrophy, cerebellar atrophy, callosal anomalies and restricted diffusion of the central tegmental tracts (CTT). No significant differences were seen in individuals for whom diffusion-weighted imaging (DWI) was not performed for financial reasons. (E) Scatter plot of all individuals with DWI showing the onset and temporal resolution of central tegmental tract restricted diffusion independent of epileptic activity. In particular, note that diffusion changes are seen even in individuals with no seizures prior to neuroimaging. (F) Regional expression pattern of all GPI-AP genes in healthy controls derived from normative AHBA data shows physiologically clustered reduced expression in the brainstem and deep grey nuclei (blue). This pattern of expression did not vary between genes or between the synthesis and transamidase and remodelling components of the GPI-AP (Supplementary Fig. 3). AHBA = Allen Human Brain Atlas; GPI-AP = glycosylphosphatidylinositol anchor pathway; IGD = inherited glycosylphosphatidylinositol deficiency disorders.
Figure 5
Figure 5
Natural history of individuals with IGDs. (A) Kaplan-Meier curve of all-cause mortality across our cohort, n = 15. (B) Kaplan-Meier curve of seizure freedom shows a significantly earlier age at seizure onset for individuals with variants in synthesis stage genes of the GPI-AP when compared to individuals with variants in transamidase and remodelling stage genes of the GPI-AP (log rank P = 0.046). (C) Bar chart of motor milestones shows that the majority of individuals were non-ambulant at last clinical follow-up but that outcomes ranged from normal independent walking to spastic quadriplegia. (D) Bar chart of neurodevelopmental outcomes at last clinical follow-up shows DD/ID, speech delay and motor delay as almost universal features. (E) Bar chart of functional outcomes exhibits a high prevalence of cortical visual impairment and significant non-neurological morbidity at last clinical follow-up, including complex nutritional requirements. In all bar charts, percentage frequencies are printed on the respective bars and the median age at last clinical follow-up is printed above each bar with the interquartile range bracketed. DD = developmental delay; GPI-AP = glycosylphosphatidylinositol anchor pathway; ID = intellectual disability; IGDs = inherited glycosylphosphatidylinositol deficiency disorders.
Figure 6
Figure 6
IGDs show meaningful phenotypic and natural history variability when clustered by genotype. (A) Dot plots of genotypic groups show differential frequencies of core phenotypic features. (B) Exploratory unsupervised hierarchical clustering of genotype-phenotype correlations shows aggregation and dendrogram linkage of genotypic groups based on the presence of core clinical features. (C) Dot plots of genotypic groups show differential frequencies of long-term clinical outcomes. (D) Exploratory unsupervised hierarchical clustering of genotype-outcome correlations shows aggregation and dendrogram linkage of genotypic groups based on long-term clinical outcomes. In B and D, the colour scale represents scaled, relative frequencies—i.e. dark blue is low frequency relative to the other genes and dark red is high frequency relative to the other genes. DD = developmental delay; ID = intellectual disability; IGD = inherited glycosylphosphatidylinositol deficiency disorders.

References

    1. Kinoshita T, Fujita M. Biosynthesis of GPI-anchored proteins: Special emphasis on GPI lipid remodeling. J Lipid Res. 2016;57:6–24. - PMC - PubMed
    1. Nozaki M, Ohishi K, Yamada N, Kinoshita T, Nagy A, Takeda J. Developmental abnormalities of glycosylphosphatidylinositol-anchor-deficient embryos revealed by Cre/loxP system. Lab Invest. 1999;79:293–299. - PubMed
    1. Alfieri JA, Martin AD, Takeda J, Kondoh G, Myles DG, Primakoff P. Infertility in female mice with an oocyte-specific knockout of GPI-anchored proteins. J Cell Sci. 2003;116(Pt 11):2149–2155. - PubMed
    1. Kondoh G, Tojo H, Nakatani Y, et al. Angiotensin-converting enzyme is a GPI-anchored protein releasing factor crucial for fertilization. Nat Med. 2005;11:160–166. - PMC - PubMed
    1. Fujita M, Kinoshita T. GPI-anchor remodeling: Potential functions of GPI-anchors in intracellular trafficking and membrane dynamics. Biochim Biophys Acta. 2012;1821:1050–1058. - PubMed

Publication types

Substances

Supplementary concepts