. 2024 Mar 8;9(5):e167676.
doi: 10.1172/jci.insight.167676.

Age-related dysregulation of intestinal epithelium fucosylation is linked to an increased risk of colon cancer

Affiliations

Age-related dysregulation of intestinal epithelium fucosylation is linked to an increased risk of colon cancer

Zhihan Wang et al. JCI Insight. .

Abstract

Colon cancer affects people of all ages. However, its frequency, as well as the related morbidity and mortality, are high among older adults. The complex physiological changes in the aging gut substantially limit the development of cancer therapies. Here, we identify a potentially unique intestinal microenvironment that is linked with an increased risk of colon cancer in older adults. Our findings show that aging markedly influenced persistent fucosylation of the apical surfaces of intestinal epithelial cells, which resulted in a favorable environment for tumor growth. Furthermore, our findings shed light on the importance of the host-commensal interaction, which facilitates the dysregulation of fucosylation and promotes tumor growth as people get older. We analyzed colonic microbial populations at the species level to find changes associated with aging that could contribute to the development of colon cancer. Analysis of single-cell RNA-sequencing data from previous publications identified distinct epithelial cell subtypes involved in dysregulated fucosylation in older adults. Overall, our study provides compelling evidence that excessive fucosylation is associated with the development of colon cancer, that age-related changes increase vulnerability to colon cancer, and that a dysbiosis in microbial diversity and metabolic changes in the homeostasis of older mice dysregulate fucosylation levels with age.

Keywords: Aging; Cellular senescence; Colorectal cancer; Drug therapy; Microbiology.


Conflict of interest statement

Conflict of interest: The authors have declared that no conflict of interest exists.

Figures

Figure 1
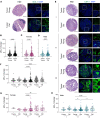
Figure 1. Age-associated changes accelerate the fucosylation process in intestinal epithelium.
(A) Representative images of hematoxylin and eosin (H&E) staining (left) and immunohistochemical (IHC) staining with UEA1 (right) in colon normal samples (n = 85) between old (n = 29) and young (n = 56) individuals. Scale bar = 500 μm (black) or 200 μm (white). (B) The MFI of UEA1 expression across young (<65 years) and old (≥65 years) samples of the cohort shown in A. (C) Representative images of H&E staining (left) and IHC staining with UEA1 (right) in 8-week (young) and 2-year-old (old) C57BL/6 mouse colons (n = 6). Scale bar = 100 μm. (D and E) The quantification of UEA1+ cells (D) and the MFI of UEA1 expression (E) across mouse colon samples shown in panel C. (F and G) Representative histograms (F) and quantification (G) of live CD45Epcam+ gated UEA1+ cells from 8-week-old (young) and 2-year-old (old) C57BL/6 mouse colons detected by flow cytometry. All data represent means ± SD. Unpaired t test: **, P < 0.01; ****, P < 0.0001.
Figure 2
Figure 2. Increased fucosylation is linked with a high risk of colon cancer in older adults.
(A) Representative images of H&E staining (left) and IHC staining with UEA1 (right) in colon cancer samples between young and older individuals. (BD) The MFI of UEA1 expression across young and older samples (B) within the cohort depicted in A and further differentiated between women (C) and men (D). (E) Representative images of H&E staining (left) and UEA1 staining (right) in colon cancer samples across different cancer stages. (FH) The MFI of UEA1 expression across young and older samples at different stages (F) within the cohort depicted in panel E and further differentiated between women (G) and men (H). Scale bar = 500 μm (black) or 200 μm (white). All data represent means ± SD. Unpaired t test (BD) and 2-way ANOVA with Holm-Šídák multiple-comparison test (FH): *, P < 0.05; **, P < 0.01; ****, P < 0.0001.
Figure 3
Figure 3. Individuals with colon cancer exhibit higher levels of fucosyltransferase (FUT2, FUT8) gene expression in their colonic epithelial cells.
(A and B) t-Distributed stochastic neighbor embedding (t-SNE) plot of cells from normal patients (A) color-coded by cell type as indicated (B). Donut chart shows the cell proportion of each cell type among young and old (B). TNKILC, T cells, natural killer cells, innate lymphoid cells. (C and D) t-SNE plot of cells from tumor (C) color-coded by cell type as indicated (D). Donut chart shows the cell proportion of each cell type among young and old (D). (E) Dot plot shows the expression pattern of fucosylation genes among all cell types. (F) Dot plot shows the expression pattern of the fucosylation genes between young and old across normal and tumor patients. (G) Dot plot shows the expression of the significantly differential fucosylation (FUT2, FUT3, FUT8) genes (top) and epithelial repair genes such as TGFB1 and TGFBR1 (bottom) (adjusted P < 0.05 and absolute log2fold-change > 0.25) between young and old among normal and tumor. A positive symbol (+) indicates increased gene expression, and a negative sign (–) indicates decreased gene expression.
Figure 4
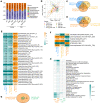
Figure 4. The microbial diversity with aging influences age-related epithelium fucosylation.
(A) Relative abundance of the most prevalent bacterial phyla among groups. Color stands for phylum level. (B) Principal coordinates analysis (PCoA) of the β-diversity based on the Bray-Curtis metric. Colors stand for different groups. (C) Venn diagram shows unique or shared significant bacteria from 3 comparisons (1Y versus 8W, 2Y versus 8W, and 2Y versus 1Y). (D) Comparison of the significantly differential microbiome at the genus level. Only bacteria with significant differences (adjusted P < 0.05 & |log2fold-change| > 1) between the 2Y versus 8W mice are shown. Colors stand for phylum level. (E) The top 30 differential bacteria distinguish 2Y from 8W mice based on the random forest (RF) model. The bar lengths represent mean decrease in accuracy, indicating the importance of classification. (F) Representative heatmap of significant KEGG pathways associated with relative bacterial abundance in 2Y versus 8W mice. The values are scaled by rows (n = 6 per group). Only the pathways with significant differences (P < 0.05) are shown. (G) Venn diagram shows unique or shared significant pathways from 3 comparisons (2Y versus 8W, 2Y versus 1Y, and 1Y versus 8W).
Figure 5
Figure 5. The FMT exhibits a transmissible effect that actively modulates colon cancer pathology in mice.
(A) Experimental design for FMT to pseudo-germ-free mice and induction of colitis-induced colon cancer using AOM/DSS (A/D) (n = 8). Abs, antibiotics. (B) Representative images of H&E staining (left) and UEA1 staining (right) of young and old mouse colon samples across control (CT), FMT (Y→O, O→Y), A/D, and FMT (Y→O, O→Y) + A/D groups. Scale bar = 500 μm. (C and D) The quantification of UEA1-positive cells (C) and the MFI of UEA1 expression (D) across mouse colon samples shown in A. (E and F) Representative histograms (E) and quantification (F) of live CD45Epcam+ gated UEA1+ cells of young and old mouse colon samples across CT, FMT (Y→O, O→Y), A/D, and FMT (Y→O, O→Y) + A/D groups using flow cytometry. All data represent means ± SD. Two-way ANOVA with Holm-Šídák multiple-comparison test: *, P < 0.05; **, P < 0.01; ***, P < 0.001; ****, P < 0.0001.
Figure 6
Figure 6. Aging gut microbiota regulates gut epithelial fucosylation and colon cancer pathology.
(A) Relative abundance of the most common bacterial phyla between populations. The color signifies the phylum. (B) PCoA of β-diversity using the Bray-Curtis metric. Colors represent distinct groupings. (C and D) Venn diagram shows unique or shared significant bacteria from 3 comparisons under normal and AOM/DSS treatments (old versus young, young FMT versus young, and old FMT versus old). (E and F) Representative heatmap of significant shared microbiome in C and D at the genus level. Only microorganisms with significant differences (adjusted P < 0.05 and |log2fold-change| > 1) were shown. Colors represent log2fold-change between comparisons. (G) Venn diagram shows unique or shared significant pathways from 2 comparisons (young FMT+A/D versus young FMT, old FMT+A/D versus old FMT). (H) Representative heatmap of significant shared pathways in G. Only pathways with significant differences (P < 0.05) were shown. Colors represent log2fold-change between comparisons.
Figure 7
Figure 7. Inhibition of fucosylation suppresses the expression of cancer-related genes and inhibits colon cancer cell migration and proliferation.
Human epithelial colon cancer DLD-1 cells were treated with DMSO (vehicle), 100 μM resveratrol (RSV), or 300 μM fucosylation inhibitor 2F-peracetyl-fucose (2FF) for 24 hours. (A) Reverse transcription quantitative PCR (qPCR) analysis for FUT2, FUT8, LGR5, PCNA, P53, and P21 in DLD-1 cells treated with RSV and 2FF. LGR5, leucine-rich repeat-containing G protein–coupled receptor 5; PCNA, proliferating cell nuclear antigen. (BE) DLD-1 cell migration and proliferation inhibited by RSV and 2FF. (B) Typical images (left) and corresponding statistical results (right) of Transwell invasion and migration assays in DLD-1 cells treated with vehicle, RSV, and 2FF. Scale bar = 50 μm. (C) Representative images (left) and quantification (right) of wound healing assay at 0 and 24 hours in DLD-1 cells treated with vehicle, RSV, and 2FF. Light blue line marks scratch wound edges. Scale bar = 200 μm. Scratched areas were quantified as a percentage after 24 hours relative to 0 hours. (D) Representative images (left) and relative fraction (right) of EdU-positive cells. EdU, 5-ethynyl-2′-deoxyuridine. Scale bar = 50 μm. (E) Measurement of cell proliferation using CCK8 assays. CCK8, cell counting kit-8. All data represent means ± SD; n = 6 (A) and n = 4 (BE). *, P < 0.05; **, P < 0.01; ***, P < 0.001; ****, P < 0.0001 by 1-way ANOVA. (F) Schematic of proposed mechanism illustrating how core fucosylation of IECs influences microbiota and may impact aging and cancer development.

Similar articles

Cited by

References

    1. Davidson KW, et al. Screening for colorectal cancer: US preventive services task force recommendation statement. JAMA. 2021;325(19):1965–1977. doi: 10.1001/jama.2021.6238. - DOI - PubMed
    1. Kelly H, Goldberg RM. Systemic therapy for metastatic colorectal cancer: current options, current evidence. J Clin Oncol. 2005;23(20):4553–4560. doi: 10.1200/JCO.2005.17.749. - DOI - PubMed
    1. Yancik R, Ries LA. Cancer in older persons. Magnitude of the problem--how do we apply what we know? Cancer. 1994;74(7 suppl):1995–2003. doi: 10.1002/1097-0142(19941001)74:7+<1995::AID-CNCR2820741702>3.0.CO;2-Y. - DOI - PubMed
    1. Sanoff HK, Goldberg RM. Colorectal cancer treatment in older patients. Gastrointest Cancer Res. 2007;1(6):248–253. - PMC - PubMed
    1. Chen S, et al. Frailty and long-term survival of patients with colorectal cancer: a meta-analysis. Aging Clin Exp Res. 2022;34(7):1485–1494. doi: 10.1007/s40520-021-02072-x. - DOI - PubMed

Publication types