. 2024 Apr 1;151(7):dev202387.
doi: 10.1242/dev.202387. Epub 2024 Apr 4.

Cadherin-dependent adhesion is required for muscle stem cell niche anchorage and maintenance

Affiliations

Cadherin-dependent adhesion is required for muscle stem cell niche anchorage and maintenance

Margaret Hung et al. Development. .

Abstract

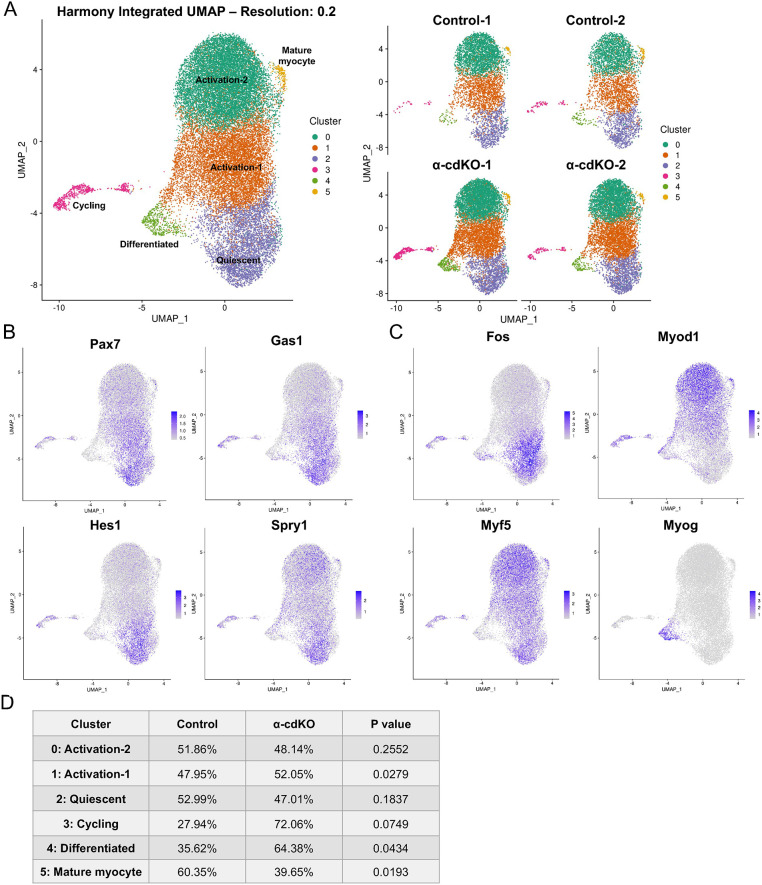
Adhesion between stem cells and their niche provides stable anchorage and signaling cues to sustain properties such as quiescence. Skeletal muscle stem cells (MuSCs) adhere to an adjacent myofiber via cadherin-catenin complexes. Previous studies on N- and M-cadherin in MuSCs revealed that although N-cadherin is required for quiescence, they are collectively dispensable for MuSC niche localization and regenerative activity. Although additional cadherins are expressed at low levels, these findings raise the possibility that cadherins are unnecessary for MuSC anchorage to the niche. To address this question, we conditionally removed from MuSCs β- and γ-catenin, and, separately, αE- and αT-catenin, factors that are essential for cadherin-dependent adhesion. Catenin-deficient MuSCs break quiescence similarly to N-/M-cadherin-deficient MuSCs, but exit the niche and are depleted. Combined in vivo, ex vivo and single cell RNA-sequencing approaches reveal that MuSC attrition occurs via precocious differentiation, re-entry to the niche and fusion to myofibers. These findings indicate that cadherin-catenin-dependent adhesion is required for anchorage of MuSCs to their niche and for preservation of the stem cell compartment. Furthermore, separable cadherin-regulated functions govern niche localization, quiescence and MuSC maintenance.

Keywords: Cell adhesion; Cell signaling; Muscle stem cell; Quiescence; Stem cell niche.


Conflict of interest statement

Competing interests The authors declare no competing or financial interests.

Figures

Fig. 1.
Fig. 1.
Catenins are apically enriched in quiescent MuSCs and necessary for MuSC maintenance. (A) Breeding scheme for α-cdKO mice: mice carrying homozygous floxed alleles for αE-catenin (Ctnna1) and αT-catenin (Ctnna3) loci were paired with mice carrying a MuSC-specific Pax7-driven CreERT2 (Pax7CreERT2) allele to yield α-cdKO mice. Created with BioRender. (B-F) TA muscle sections from control and α-cdKO mice at various time points were immunostained (Pax7, magenta; laminin, green; DAPI, blue) and Pax7-expressing MuSCs were labeled (B; white arrows) and quantified (C). Immunostaining of single myofibers (αE- or αT-catenin, magenta; caveolin 1 or Pax7, green; DAPI, blue) was used to assess the presence of αE- and αT-catenin protein (D,E) and MuSC attrition (F) in α-cdKO mice. Representative images of control and α-cdKO TA muscle sections and single myofibers were isolated from 28 DPT immunofluorescence analyses. (G) Breeding scheme for βγ-cdKO mice: mice carrying homozygous floxed alleles for β-catenin (Ctnnb1) and γ-catenin (Jup) loci were paired with mice carrying a MuSC-specific Pax7-driven CreERT2 allele (Pax7CreERT2) to yield βγ-cdKO mice. Created with BioRender. (H-L) TA muscle sections from control and βγ-cdKO mice at various time points were immunostained (Pax7, magenta; laminin, green; DAPI, blue) and Pax7-expressing MuSCs were labeled (H; white arrows) and quantified (I). Immunostaining of single myofibers (β- or γ-catenin, magenta; Pax7, green; DAPI, blue) was used to assess presence of β- and γ-catenin protein (J,K) and MuSC attrition (L) in βγ-cdKO mice. Representative images of control and βγ-cdKO TA muscle sections and single myofibers were isolated from 28 DPT immunofluorescence analyses. Scale bars: 25 μm in B,H; 10 μm in D,E,J,K. Each data point represents the average from ten fields (TA muscle sections) or at least ten myofibers (EDL single myofibers) from each animal. n≥4 animals per genotype per timepoint. Data are mean±s.e.m. with comparisons made using a two-tailed unpaired Student's t-test. *P<0.05, **P<0.01, ***P<0.001, ****P<0.0001.
Fig. 2.
Fig. 2.
α-cdKO mice have modest defects in muscle regeneration. (A) Double BaCl2 injury model. α-cdKO mice were injected with tamoxifen for 5 consecutive days to recombine α-catenin alleles. At 28 DPT, mice were placed on tamoxifen-supplemented chow, and the first injury was applied to the hindlimb by an intramuscular injection of 1.2% BaCl2 in saline. After 28 days of recovery, a second injury was applied. Muscle was harvested and snap frozen at 7 and 28 dpi for analysis. Created with BioRender. (B-F) At 7 dpi, TA muscle sections from control and α-cdKO mice were immunostained (Pax7 or MyoD, magenta; laminin, green; DAPI, blue) for Pax7+ (B,C) and MyoD+ (D,E) cells to assess MuSC and myogenic progenitor numbers during early regeneration. (F) Myofiber size was quantified by minimum feret diameter. (G-K) At 28 dpi, TA muscle sections from control and α-cdKO mice were immunostained (G; Pax7, magenta; laminin, green; DAPI, blue) to assess MuSC numbers (H) and location (I) after complete regeneration. (J,K) Myofiber size was quantified by minimum feret diameter (J) with a statistical analysis in median myofiber size carried out using a two-tailed Mann–Whitney test (K). Scale bars: 25 μm in B,D,G. White arrows indicate a cell under the basal lamina; black arrow indicates an interstitial cell. Each data point represents the average from ten fields from each animal. n=4 animals per genotype. Data are mean±s.e.m. with comparisons made using a two-tailed unpaired Student's t-test, unless otherwise noted. ***P<0.001, ****P<0.0001.
Fig. 3.
Fig. 3.
α-cdKO MuSCs do not adopt non-myogenic lineage fates. (A) Single cell RNA-sequencing analysis of tdTomato+ cells from control and α-cdKO mice at 14 DPT revealed six distinct cell clusters after Harmony integration, with no cluster being unique to either genotype. (B,C) Gene expression of quiescence-associated (B) and activation- or differentiation-associated (C) factors illustrated a continuum of the quiescence-to-activation transition present in both genotypes. (D) Clusters were categorized based on top differentially expressed genes; genotype contribution to each cluster was normalized to the total number of cells analyzed.
Fig. 4.
Fig. 4.
Loss of α-catenins compromises cadherin-based adhesion and leads to escape from the niche. (A-C) Endogenous tdTomato reporter fluorescence from MuSCs on isolated single EDL myofibers from control and α-cdKO mice at 14 DPT (A) was used to quantify the proportion of MuSCs maintaining cytoplasmic projections (B) and the average length of remaining projections (C). (D,E) At 14 DPT, TA muscle sections from control and α-cdKO mice at 14 DPT were immunostained (M-cadherin, grey; Pax7, magenta; WGA, green; DAPI, blue) to assess M-cadherin localization in Pax7+ MuSCs (D,E). (F,G) At 14 DPT, TA muscle sections from control and α-cdKO mice at 14 DPT were immunostained (Pax7, magenta; laminin, green; DAPI, blue) (F; white arrows indicate Pax7+ cells) to assess MuSC localization (G). Scale bars: 25 μm in A,F; 10 μm in D. Each data point represents the average quantified from n≥30 cells from each animal (TA muscle sections) or at least ten myofibers (EDL single myofibers) from each animal. n=4 animals per genotype. Data are mean±s.e.m. with comparisons made using two-tailed unpaired Student's t-test. *P<0.05, **P<0.01, ***P<0.001, ****P<0.0001.
Fig. 5.
Fig. 5.
α-cdKO MuSCs activate and enter the cell cycle in the absence of injury. (A-C) TA muscle sections from control and α-cdKO mice at 14 DPT were immunostained (Pax7, magenta; Ki67, grey; WGA, green; DAPI, blue) (A) to assess the incidence of Pax7+Ki67+ cells (B) and their location (C). (D-F) TA muscle sections from control and α-cdKO mice at 14 DPT were immunostained (MyoD, magenta; Ki67, grey; WGA, green; DAPI, blue) (D) to assess the incidence of MyoD+Ki67+ cells among all Ki67+ cells (E) and their location (F). Scale bars: 10 μm in A,D. Each data point represents the average quantified from n≥30 cells from each animal. White arrows indicate a cell under the basal lamina; black arrows indicate an interstitial cell. n=4 animals per genotype. Data are mean±s.e.m. with comparisons made using a two-tailed unpaired Student's t-test. ***P<0.001, ****P<0.0001.
Fig. 6.
Fig. 6.
α-cdKO MuSCs are lost to precocious differentiation and fusion. (A-D) TA muscle sections from control and α-cdKO mice at 21 DPT were immunostained (A; myogenin, magenta; BrdU, grey; WGA, green; DAPI, blue) to study cell cycle progression into S phase by BrdU incorporation and to examine the precocious differentiation of myogenic cells by expression of myogenin (B-D). (B-D) Cycling myogenic cells (B,C) and location of myogenin+BrdU+ cells (D) were quantified. (E,F) TA muscle sections from control and α-cdKO mice at 21 DPT were immunostained for sarcolemma marker dystrophin (red) and basal lamina marker WGA (green) (E) to assess whether actively cycling myogenic cells under the basal lamina were able to initiate fusion into the myofiber (F). Scale bars: 10 μm in A,E. Each data point represents quantification of n≥30 cells (TA muscle sections) from each animal. White arrows indicate a cell under the basal lamina; black arrows indicate an interstitial cell. n=4 animals per genotype. Data are mean±s.e.m. with comparisons made using a two-tailed unpaired Student's t-test. *P<0.05, **P<0.01, ****P<0.0001.
Fig. 7.
Fig. 7.
Schematic representation of α-cdKO MuSC behavior. Attrition of Pax7+ MuSCs in α-cdKO mice is due to the loss of apical cadherin-catenin-based adhesion to the myofiber. This results in cells that become activated in the absence of injury, exit the niche, enter the cell cycle and terminally differentiate to fuse into the myofiber. Created with BioRender.

References

    1. Almada, A. E., Horwitz, N., Price, F. D., Gonzalez, A. E., Ko, M., Bolukbasi, O. V., Messemer, K. A., Chen, S., Sinha, M., Rubin, L. L.et al. (2021). FOS licenses early events in stem cell activation driving skeletal muscle regeneration. Cell Rep. 34, 108656. 10.1016/j.celrep.2020.108656 - DOI - PMC - PubMed
    1. Baghdadi, M. B., Castel, D., Machado, L., Fukada, S.-I., Birk, D. E., Relaix, F., Tajbakhsh, S. and Mourikis, P. (2018). Reciprocal signalling by Notch–Collagen V–CALCR retains muscle stem cells in their niche. Nature 557, 714-718. 10.1038/s41586-018-0144-9 - DOI - PMC - PubMed
    1. Bates, D., Mächler, M., Bolker, B. and Walker, S. (2015). Fitting linear mixed-effects models using lme4. J. Stat. Softw. 67, 1-48. 10.18637/jss.v067.i01 - DOI
    1. Bjornson, C. R. R., Cheung, T. H., Liu, L., Tripathi, P. V., Steeper, K. M. and Rando, T. A. (2012). Notch signaling is necessary to maintain quiescence in adult muscle stem cells. Stem Cells 30, 232-242. 10.1002/stem.773 - DOI - PMC - PubMed
    1. Charytonowicz, D., Brody, R. and Sebra, R. (2023). Interpretable and context-free deconvolution of multi-scale whole transcriptomic data with UniCell deconvolve. Nat. Commun. 14, 1350. 10.1038/s41467-023-36961-8 - DOI - PMC - PubMed