. 2024 May 1;14(5):846-865.
doi: 10.1158/2159-8290.CD-23-0388.

Large-scale Pan-cancer Cell Line Screening Identifies Actionable and Effective Drug Combinations

Affiliations

Large-scale Pan-cancer Cell Line Screening Identifies Actionable and Effective Drug Combinations

Azadeh C Bashi et al. Cancer Discov. .

Abstract

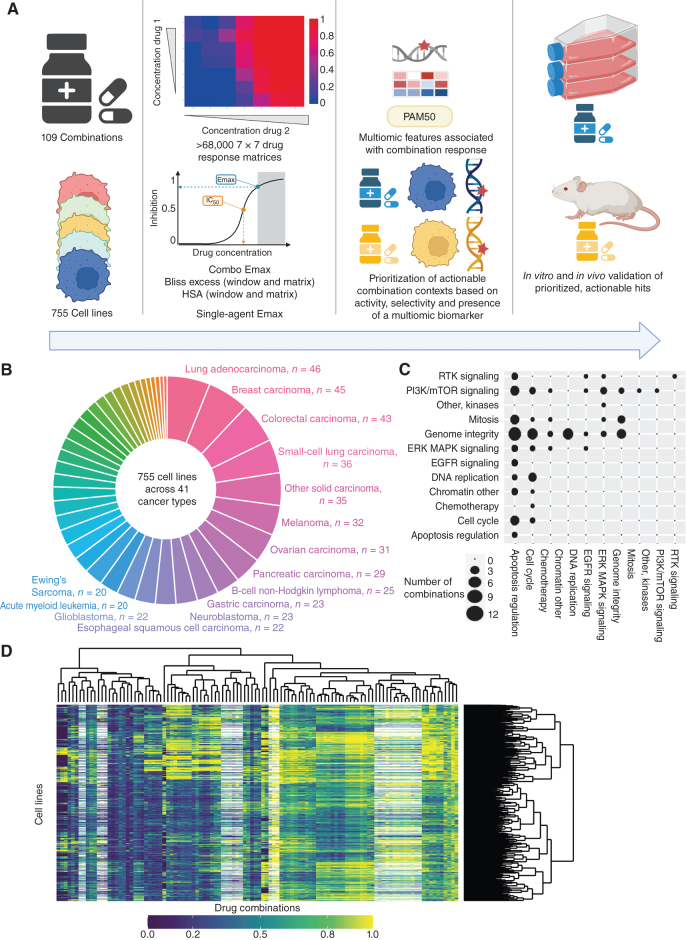
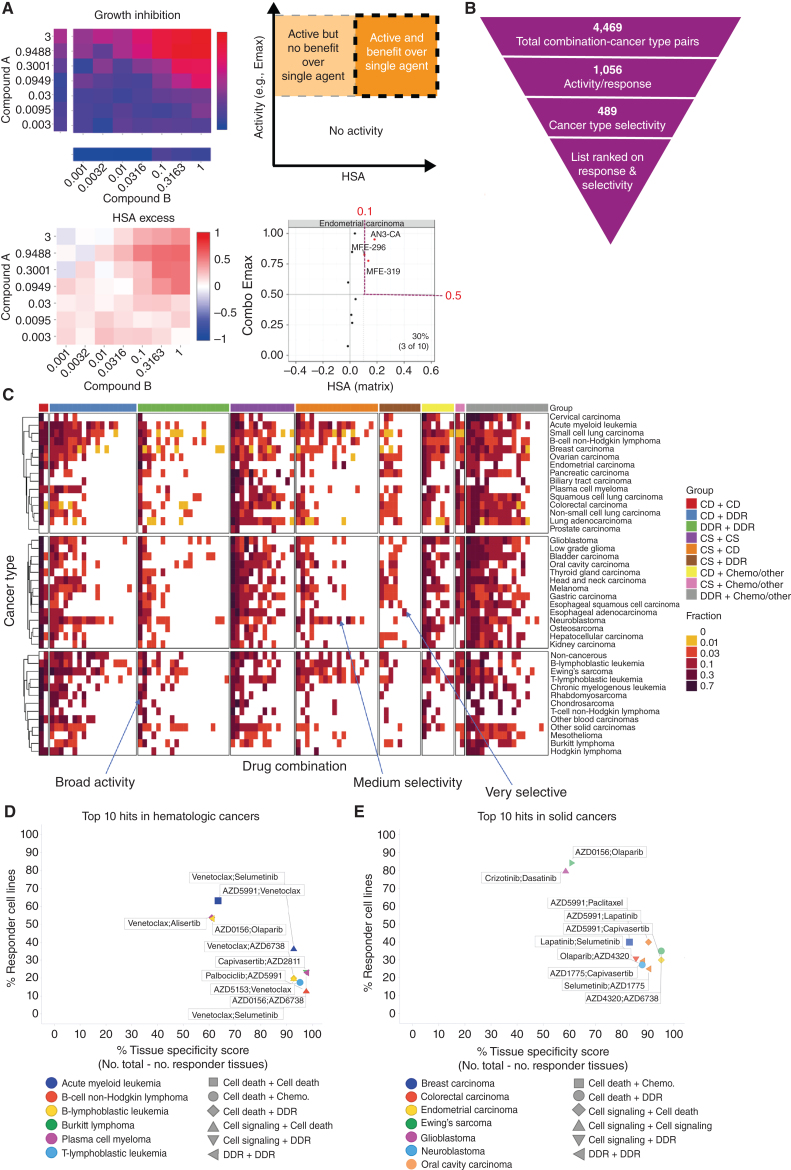
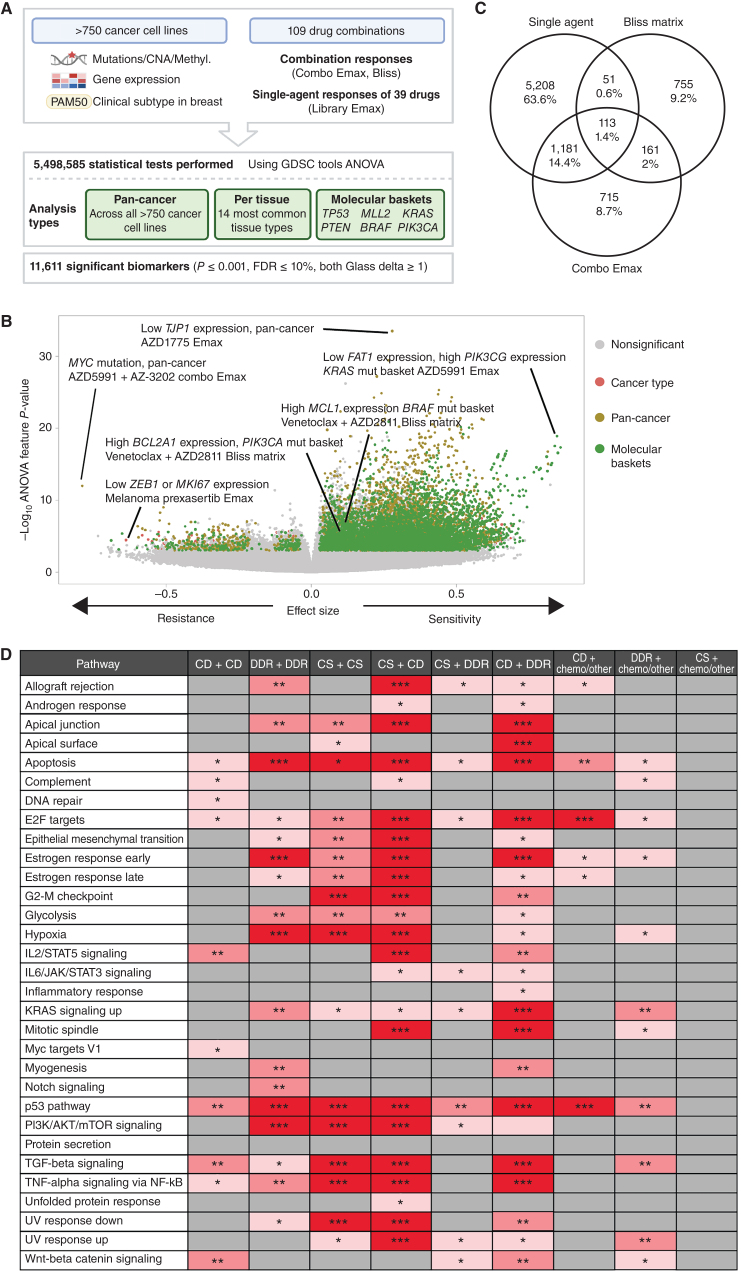
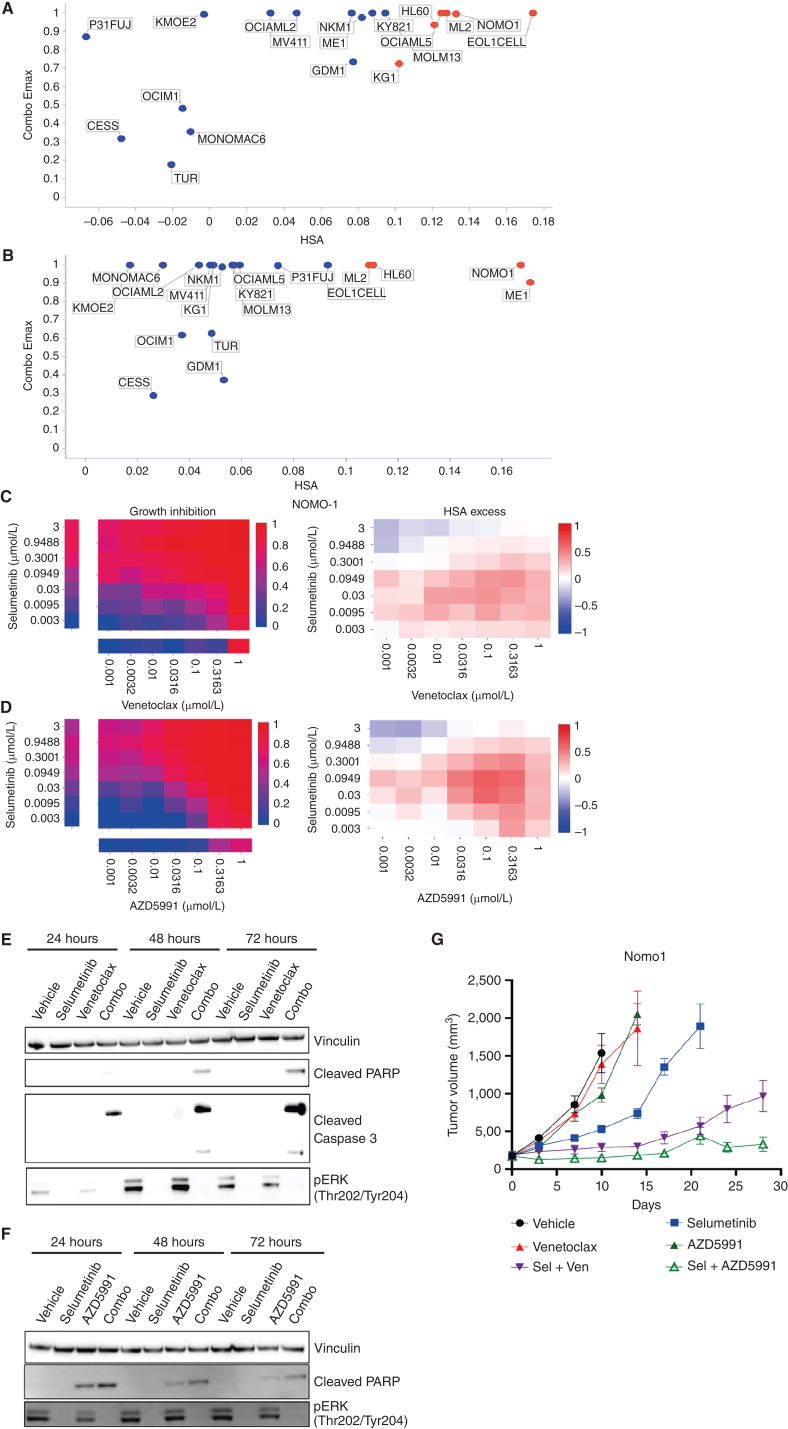
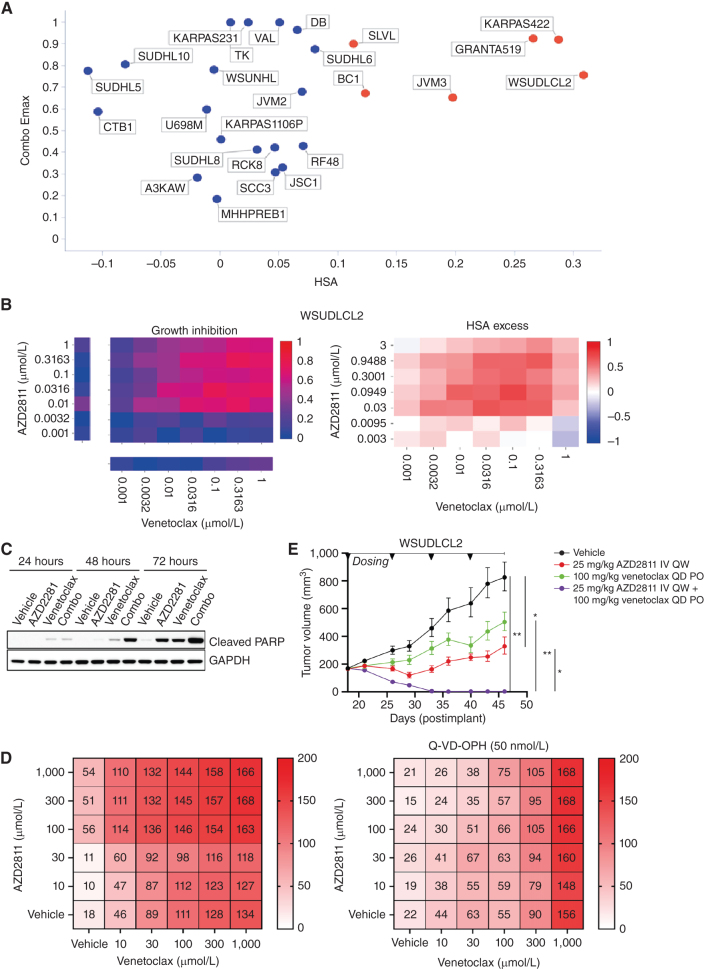
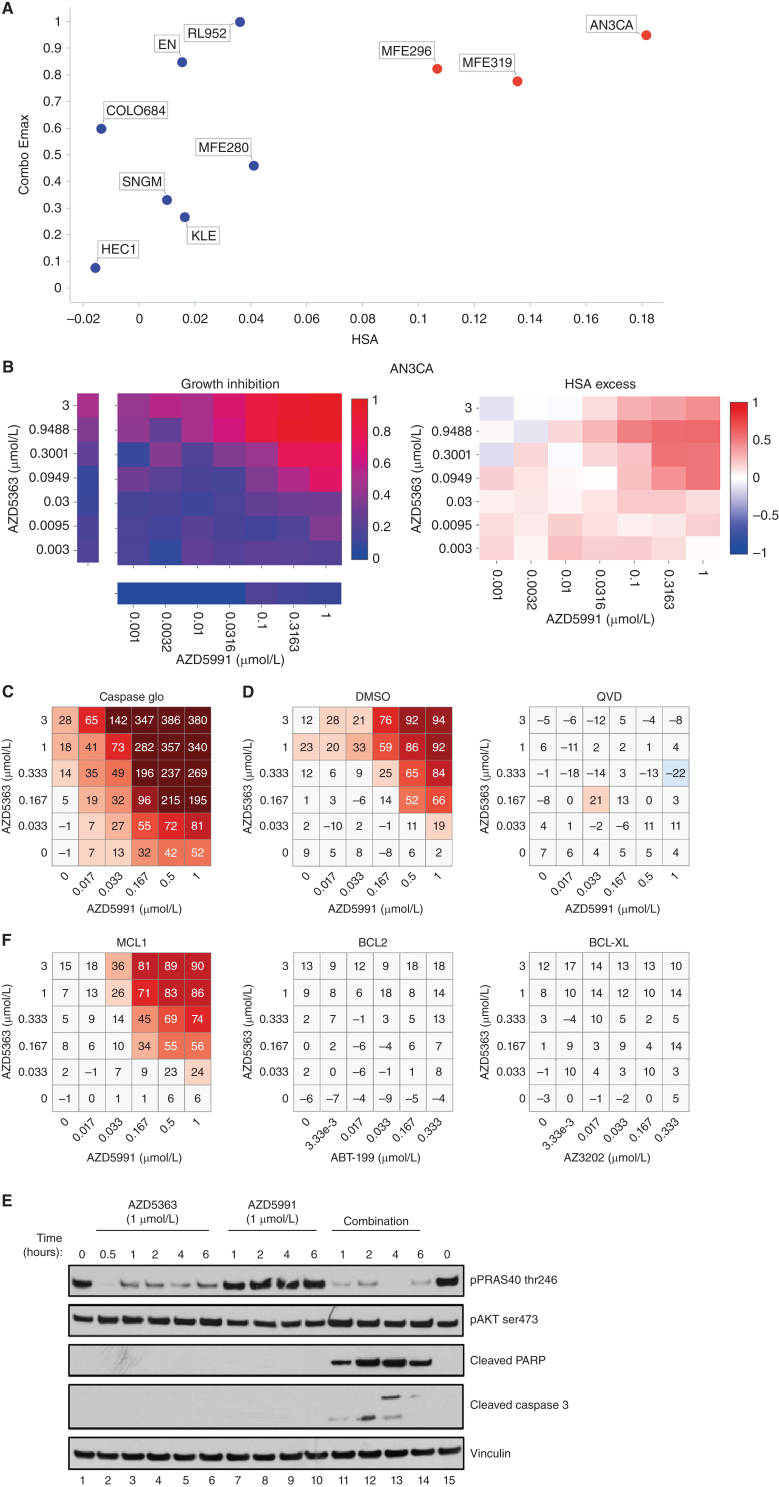
Oncology drug combinations can improve therapeutic responses and increase treatment options for patients. The number of possible combinations is vast and responses can be context-specific. Systematic screens can identify clinically relevant, actionable combinations in defined patient subtypes. We present data for 109 anticancer drug combinations from AstraZeneca's oncology small molecule portfolio screened in 755 pan-cancer cell lines. Combinations were screened in a 7 × 7 concentration matrix, with more than 4 million measurements of sensitivity, producing an exceptionally data-rich resource. We implement a new approach using combination Emax (viability effect) and highest single agent (HSA) to assess combination benefit. We designed a clinical translatability workflow to identify combinations with clearly defined patient populations, rationale for tolerability based on tumor type and combination-specific "emergent" biomarkers, and exposures relevant to clinical doses. We describe three actionable combinations in defined cancer types, confirmed in vitro and in vivo, with a focus on hematologic cancers and apoptotic targets.

Significance: We present the largest cancer drug combination screen published to date with 7 × 7 concentration response matrices for 109 combinations in more than 750 cell lines, complemented by multi-omics predictors of response and identification of "emergent" combination biomarkers. We prioritize hits to optimize clinical translatability, and experimentally validate novel combination hypotheses. This article is featured in Selected Articles from This Issue, p. 695.


Figures

Figure 1. Dose response matrix combination screening landscape. A, Schematic of screen and analysis. Created with BioRender. B, Overview of cell line cancer types. C, Drug combinations screened grouped by drug target pathways. D, Combo Emax for 755 cell lines screened with 109 combinations. White represents combination/cell line pairs not screened.
Figure 1.
Dose response matrix combination screening landscape. A, Schematic of screen and analysis. Created with BioRender.com. B, Overview of cell line cancer types. C, Drug combinations screened grouped by drug target pathways. D, Combo Emax for 755 cell lines screened with 109 combinations. White represents combination/cell line pairs not screened.
Figure 2. Shortlisting for active and selective combinations. A, Growth inhibition (Emax) and HSA matrix plots were generated for each combination in every cell line. Combo Emax and HSA were used to identify active combinations with benefit over single agent (s.a.). B, Combinations were filtered on the basis of their activity and selectivity in the tested cancer types. C, Activity of each combination tested in this screen in 41 cancer types. The fraction of cell lines where the combinations are active is indicated and combinations are grouped by category. D and E, Top 10 hits in hematologic cancers (D) and solid tumors (E). Percentage of responder cell lines for each combination in each cancer type plotted versus cancer-type specificity scores. Each color represents a cancer type and combination categories are represented by different shapes. CD, cell death; DDR, DNA damage response; CS, cell signaling; chemo, chemotherapeutic agents.
Figure 2.
Shortlisting for active and selective combinations. A, Growth inhibition (Emax) and HSA matrix plots were generated for each combination in every cell line. Combo Emax and HSA were used to identify active combinations with benefit over single agent. B, Combinations were filtered on the basis of their activity and selectivity in the tested cancer types. C, Activity of each combination tested in this screen in 41 cancer types. The fraction of cell lines where the combinations are active is indicated and combinations are grouped by category. D and E, Top 10 hits in hematologic cancers (D) and solid tumors (E). Percentage of responder cell lines for each combination in each cancer type plotted versus cancer-type specificity scores. Each color represents a cancer type and combination categories are represented by different shapes. CD, cell death; DDR, DNA damage response; CS, cell signaling; chemo, chemotherapeutic agents.
Figure 3. Multi-omics biomarkers of combination activity. A, Schematic of biomarker pipeline including molecular features incorporated and analyses performed. Created with BioRender.com. B, Volcano plot of biomarkers from all analyses. Statistically significant associations are colored by analysis type, nonsignificant biomarkers are colored gray. C, Venn diagrams of the biomarkers from different inputs leading to the identification of emergent biomarkers. Note that single-agent biomarkers may be duplicated for the multiple combinations in which the single agent has been screened: the Venn diagram depicts unique single-agent biomarker associations only. D, Significant enriched pathways for emergent biomarkers in each drug combination category based on Padj values. * 0.05 < P < 0.01, ** 0.01 < P < 0.001, *** P < 0.001. CD, cell death; CS, cell signaling; chemo, chemotherapeutic agents.
Figure 3.
Multi-omics biomarkers of combination activity. A, Schematic of biomarker pipeline including molecular features incorporated and analyses performed. Created with BioRender.com. B, Volcano plot of biomarkers from all analyses. Statistically significant associations are colored by analysis type, nonsignificant biomarkers are colored gray. C, Venn diagrams of the biomarkers from different inputs leading to the identification of emergent biomarkers. Note that single-agent biomarkers may be duplicated for the multiple combinations in which the single agent has been screened: the Venn diagram depicts unique single-agent biomarker associations only. D, Significant enriched pathways for emergent biomarkers in each drug combination category based on Padj values. * 0.05 < P < 0.01, ** 0.01 < P < 0.001, *** P < 0.001. CD, cell death; CS, cell signaling; chemo, chemotherapeutic agents.
Figure 4. Combination activity of selumetinib plus venetoclax or AZD5991 in AML. A and B, Combo Emax versus HSA scores in 19 AML cell lines exposed to selumetinib combined with (a) venetoclax or (b) AZD5991. C and D, NOMO1 growth inhibition and HSA excess to the combination of selumetinib with (c) venetoclax or (d) AZD5991. E and F, Western blot analysis for apoptosis markers in NOMO1 cells following time course treatment with selumetinib (300 nmol/L) combined with (e) venetoclax (300 nmol/L) or (f) AZD5991 (100 nmol/L). G, Tumor growth in NOMO1 xenografts treated with selumetinib, AZD5991, or venetoclax alone or in combination for 28 days (n = 5 each arm). Control and monotherapy experimental arms were halted once the maximum permitted tumor volume (2,000 cm3) was reached. Data are plotted as mean tumor volume ± SEM.
Figure 4.
Combination activity of selumetinib plus venetoclax or AZD5991 in AML. A and B, Combo Emax versus HSA scores in 19 AML cell lines exposed to selumetinib combined with (a) venetoclax or (b) AZD5991. C and D, NOMO1 growth inhibition and HSA excess to the combination of selumetinib with (c) venetoclax or (d) AZD5991. E and F, Western blot analysis for apoptosis markers in NOMO1 cells following time course treatment with selumetinib (300 nmol/L) combined with (e) venetoclax (300 nmol/L) or (f) AZD5991 (100 nmol/L). G, Tumor growth in NOMO1 xenografts treated with selumetinib, AZD5991, or venetoclax alone or in combination for 28 days (n = 5 each arm). Control and monotherapy experimental arms were halted once the maximum permitted tumor volume (2,000 cm3) was reached. Data are plotted as mean tumor volume ± SEM.
Figure 5. AZD2811 plus venetoclax combination in DLBCL. A, Combo Emax versus HSA in 25 B-cell NHL cell lines including 11 DLBCL cell lines. Cell lines with high combination activity (combo Emax > 0.5 and HSA > 0.1) are in red. B, Growth inhibition and HSA excess matrices in DLBCL cell line WSUDLCL2. C, Western blot analysis for cleaved PARP in WSUDLCL2 cells treated with AZD2811 or venetoclax alone or in combination. D, Matrix plots indicating combination activity (measured by growth inhibition) in WSUDLCL2 cells pretreated with pan caspase inhibitor Q-VD-OPH and exposed to AZD2811 combined with venetoclax for 72 hours. Matrix values represent cell viability normalized to day 0 on the scale of 0 to 200 (value < 100 = percentage of growth inhibition, value > 100 = cell death). E, Tumor growth in WSUDLCL2 xenografts treated with AZD2811 or venetoclax alone or in combination for 46 days (n = 6 per group, * 0.05 < P < 0.01, ** 0.01 < P < 0.001). Data are plotted as mean tumor volume ± SEM. PO, orally; QD, every day.
Figure 5.
AZD2811 plus venetoclax combination in DLBCL. A, Combo Emax versus HSA in 25 B-cell NHL cell lines including 11 DLBCL cell lines. Cell lines with high combination activity (combo Emax > 0.5 and HSA > 0.1) are in red. B, Growth inhibition and HSA excess matrices in DLBCL cell line WSUDLCL2. C, Western blot analysis for cleaved PARP in WSUDLCL2 cells treated with AZD2811 or venetoclax alone or in combination. D, Matrix plots indicating combination activity (measured by growth inhibition) in WSUDLCL2 cells pretreated with pan caspase inhibitor Q-VD-OPH and exposed to AZD2811 combined with venetoclax for 72 hours. Matrix values represent cell viability normalized to day 0 on the scale of 0 to 200 (value < 100 = percentage of growth inhibition, value > 100 = cell death). E, Tumor growth in WSUDLCL2 xenografts treated with AZD2811 or venetoclax alone or in combination for 46 days (n = 6 per group, * 0.05 < P < 0.01, ** 0.01 < P < 0.001). Data are plotted as mean tumor volume ± SEM. PO, orally; QD, every day; QW, every week.
Figure 6. Capivasertib (AZD5363) plus AZD5991 combination activity in endometrial cell lines. A, Screening results of combo Emax versus HSA in endometrial cell lines treated with AZD5363 plus AZD5991. Cell lines with high combination activity are in red. B, Representative growth inhibition and HSA excess matrix plots in endometrial AN3CA cells. C, Matrix plot measuring apoptosis with AZD5991 and AZD5363 at indicated doses for 6 hours in AN3-CA cells. D, Matrix plots showing viability for AN3-CA cells pretreated with DMSO or QVD (caspase inhibitor) for 16 hours prior to the combination for 6 hours. E, Western blot analysis in AN3-CA cells treated with AZD5363 (1 μmol/L), AZD5991 (500 nmol/L), or in combination at indicated times. F, Matrix plots showing viability in AN3-CA cells treated with AZD5991 or venetoclax (ABT-199 -BCL2 inhibitor), AZD4320 or AZ3202 (BCL-XL inhibitors) with AZD5363 at indicated doses for 6 hours.
Figure 6.
Capivasertib (AZD5363) plus AZD5991 combination activity in endometrial cell lines. A, Screening results of combo Emax versus HSA in endometrial cell lines treated with AZD5363 plus AZD5991. Cell lines with high combination activity are in red. B, Representative growth inhibition and HSA excess matrix plots in endometrial AN3CA cells. C, Matrix plot measuring apoptosis with AZD5991 and AZD5363 at indicated doses for 6 hours in AN3-CA cells. D, Matrix plots showing viability for AN3-CA cells pretreated with DMSO or QVD (caspase inhibitor) for 16 hours prior to the combination for 6 hours. E, Western blot analysis in AN3-CA cells treated with AZD5363 (1 μmol/L), AZD5991 (500 nmol/L), or in combination at indicated times. F, Matrix plots showing viability in AN3-CA cells treated with AZD5991 or venetoclax (ABT-199 -BCL2 inhibitor), AZD4320 or AZ3202 (BCL-XL inhibitors) with AZD5363 at indicated doses for 6 hours.

References

    1. Devita VT Jr, Serpick AA, Carbone PP. Combination chemotherapy in the treatment of advanced Hodgkin's disease. Ann Intern Med 1970;73:881–95. - PubMed
    1. DeVita VT Jr. A selective history of the therapy of Hodgkin's disease. Br J Haematol 2003;122:718–27. - PubMed
    1. Boshuizen J, Peeper DS. Rational cancer treatment combinations: an urgent clinical need. Mol Cell 2020;78:1002–18. - PubMed
    1. Morgan P, Brown DG, Lennard S, Anderton MJ, Barrett JC, Eriksson U, et al. . Impact of a five-dimensional framework on R&D productivity at AstraZeneca. Nat Rev Drug Discov 2018;17:167–81. - PubMed
    1. Cook D, Brown D, Alexander R, March R, Morgan P, Satterthwaite G, et al. . Lessons learned from the fate of AstraZeneca's drug pipeline: a five-dimensional framework. Nat Rev Drug Discov 2014;13:419–31. - PubMed

Publication types

MeSH terms

Substances