

AI-Defined Cardiac Anatomy Improves Risk Stratification of Hybrid Perfusion Imaging
- PMID: 38456877
- PMCID: PMC11222053
- DOI: 10.1016/j.jcmg.2024.01.006
AI-Defined Cardiac Anatomy Improves Risk Stratification of Hybrid Perfusion Imaging
Abstract
Background: Computed tomography attenuation correction (CTAC) improves perfusion quantification of hybrid myocardial perfusion imaging by correcting for attenuation artifacts. Artificial intelligence (AI) can automatically measure coronary artery calcium (CAC) from CTAC to improve risk prediction but could potentially derive additional anatomic features.
Objectives: The authors evaluated AI-based derivation of cardiac anatomy from CTAC and assessed its added prognostic utility.
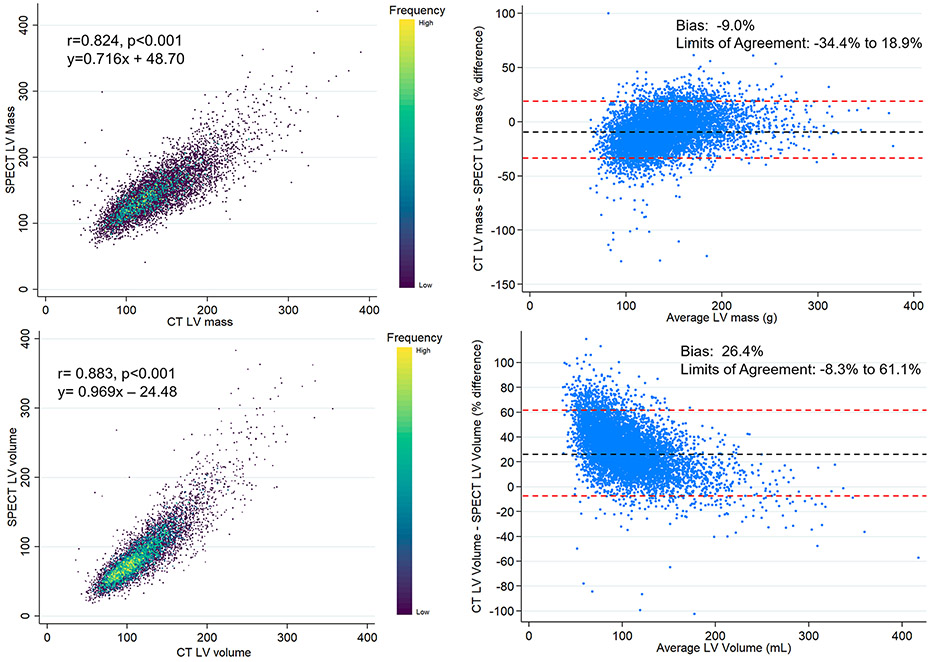
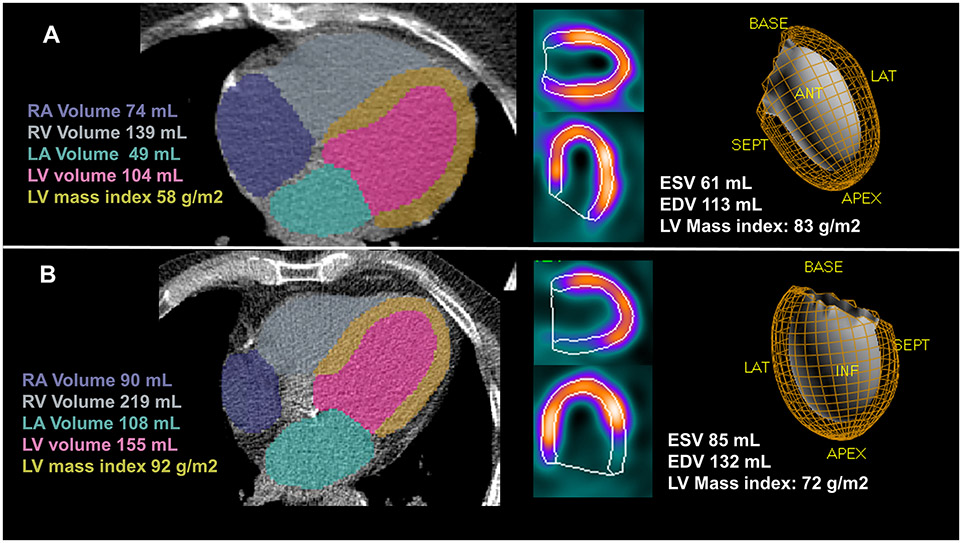
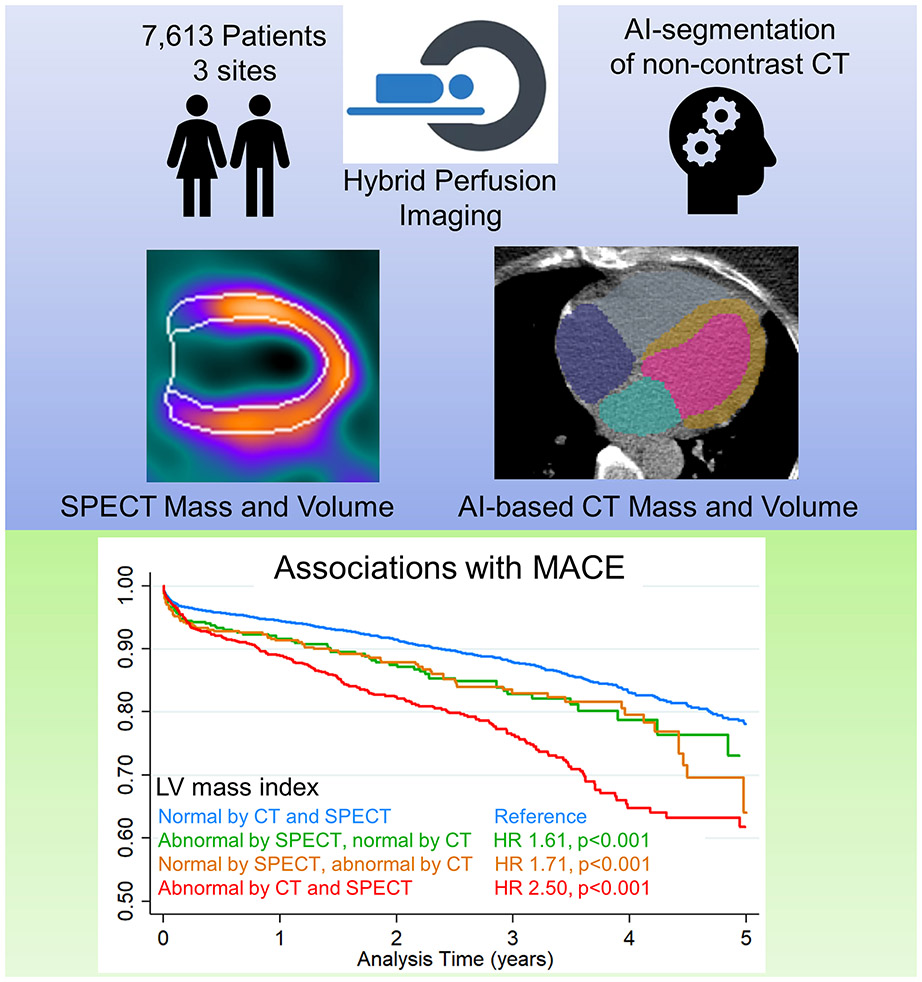
Methods: The authors considered consecutive patients without known coronary artery disease who underwent single-photon emission computed tomography/computed tomography (CT) myocardial perfusion imaging at 3 separate centers. Previously validated AI models were used to segment CAC and cardiac structures (left atrium, left ventricle, right atrium, right ventricular volume, and left ventricular [LV] mass) from CTAC. They evaluated associations with major adverse cardiovascular events (MACEs), which included death, myocardial infarction, unstable angina, or revascularization.
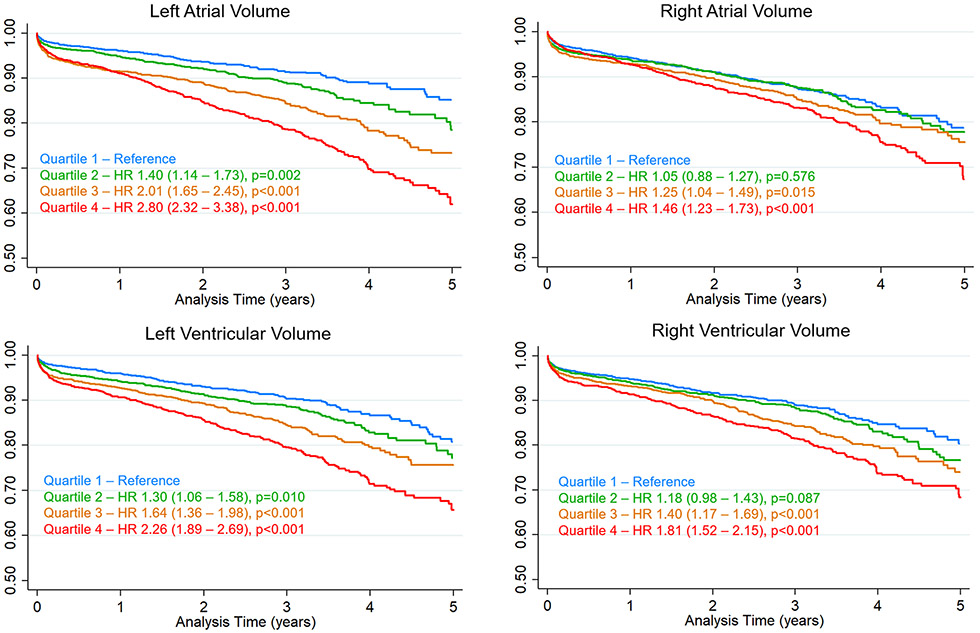
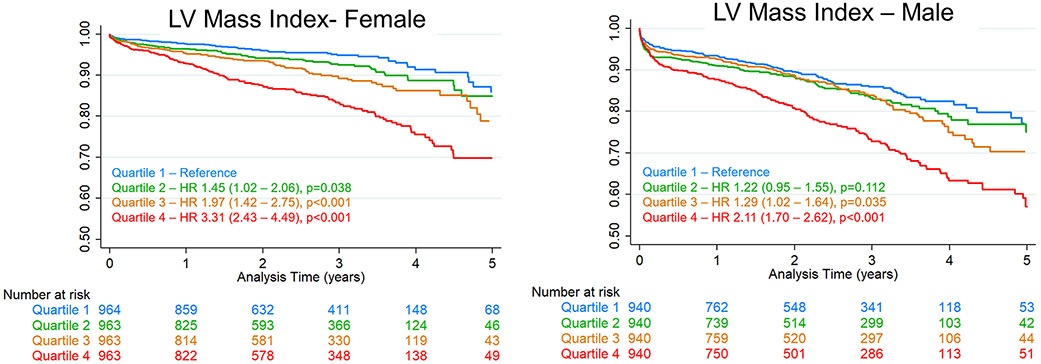
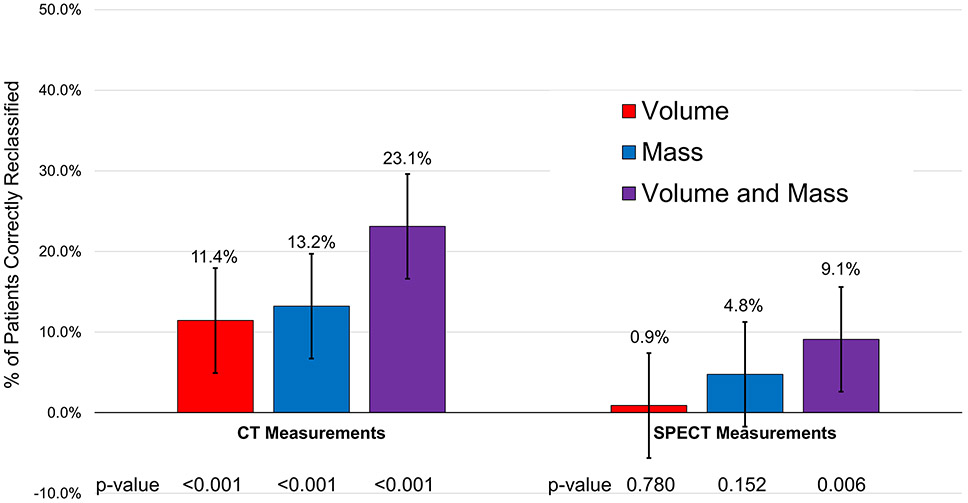
Results: In total, 7,613 patients were included with a median age of 64 years. During a median follow-up of 2.4 years (IQR: 1.3-3.4 years), MACEs occurred in 1,045 (13.7%) patients. Fully automated AI processing took an average of 6.2 ± 0.2 seconds for CAC and 15.8 ± 3.2 seconds for cardiac volumes and LV mass. Patients in the highest quartile of LV mass and left atrium, LV, right atrium, and right ventricular volume were at significantly increased risk of MACEs compared to patients in the lowest quartile, with HR ranging from 1.46 to 3.31. The addition of all CT-based volumes and CT-based LV mass improved the continuous net reclassification index by 23.1%.
Conclusions: AI can automatically derive LV mass and cardiac chamber volumes from CT attenuation imaging, significantly improving cardiovascular risk assessment for hybrid perfusion imaging.
Keywords: artificial intelligence; hybrid imaging; myocardial perfusion imaging.
Copyright © 2024 American College of Cardiology Foundation. Published by Elsevier Inc. All rights reserved.
Conflict of interest statement
Funding Support and Author Disclosures This research was supported in part by the National Heart, Lung, and Blood Institute at the National Institutes of Health grant R35HL161195 (Principal Investigator: Dr Slomka). The content is solely the responsibility of the authors and does not necessarily represent the official views of the National Institutes of Health. Mr Kavanagh has received software royalties for QPS software at Cedars-Sinai Medical Center. Dr Miller has received consulting fees and research support from Pfizer; and has served as a consultant for GE Healthcare. Dr Newby is supported by the British Heart Foundation; is a recipient of a Wellcome Trust Senior Investigator Award (WT103782AIA); and has received honoraria for consultancy and lectures from AstraZeneca. Dr Berman has received software royalties for QPS software at Cedars-Sinai Medical Center; and has served as a consultant for GE Healthcare. Dr Slomka has received software royalties for QPS software at Cedars-Sina Medical Center, research grant support from Siemens Medical Systems, and consulting fees from Synektik.
Figures
References
-
- Fihn SD, Gardin JM, Abrams J et al. 2012. ACCF/AHA/ACP/AATS/PCNA/SCAI/STS Guideline for the diagnosis and management of patients with stable ischemic heart disease. J Am Coll Cardiol 2012;60:e44–e164. - PubMed
-
- Bourque JM, Beller GA. Stress myocardial perfusion imaging for assessing prognosis: an update. JACC Cardiovasc Imaging 2011;4:1305–19. - PubMed
-
- Pieszko K, Shanbhag A, Killekar A et al. Deep Learning of Coronary Calcium Scores From PET/CT Attenuation Maps Accurately Predicts Adverse Cardiovascular Events. JACC Cardiovasc Imaging 2023;16:675–687. - PubMed
Publication types
MeSH terms
Grants and funding
LinkOut - more resources
Full Text Sources
Medical
