. 2024 Feb;13(4):e7081.
doi: 10.1002/cam4.7081.

The generation of glioma organoids and the comparison of two culture methods

Affiliations

The generation of glioma organoids and the comparison of two culture methods

Yang Zhang et al. Cancer Med. 2024 Feb.

Abstract

Background: The intra- and inter-tumoral heterogeneity of gliomas and the complex tumor microenvironment make accurate treatment of gliomas challenging. At present, research on gliomas mainly relies on cell lines, stem cell tumor spheres, and xenotransplantation models. The similarity between traditional tumor models and patients with glioma is very low.

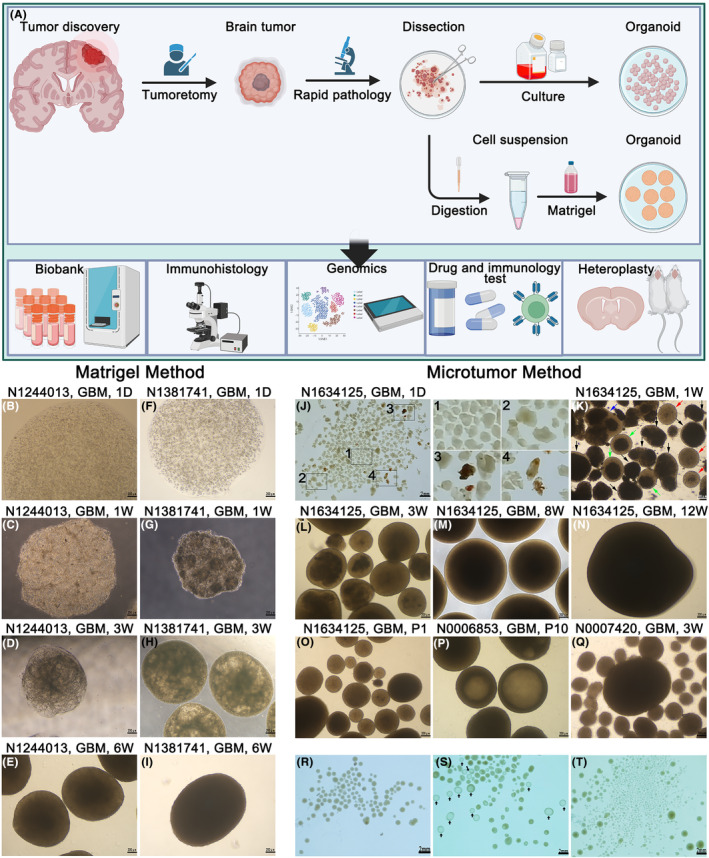
Aims: In this study, we aimed to address the limitations of traditional tumor models by generating patient-derived glioma organoids using two methods that summarized the cell diversity, histological features, gene expression, and mutant profiles of their respective parent tumors and assess the feasibility of organoids for personalized treatment.

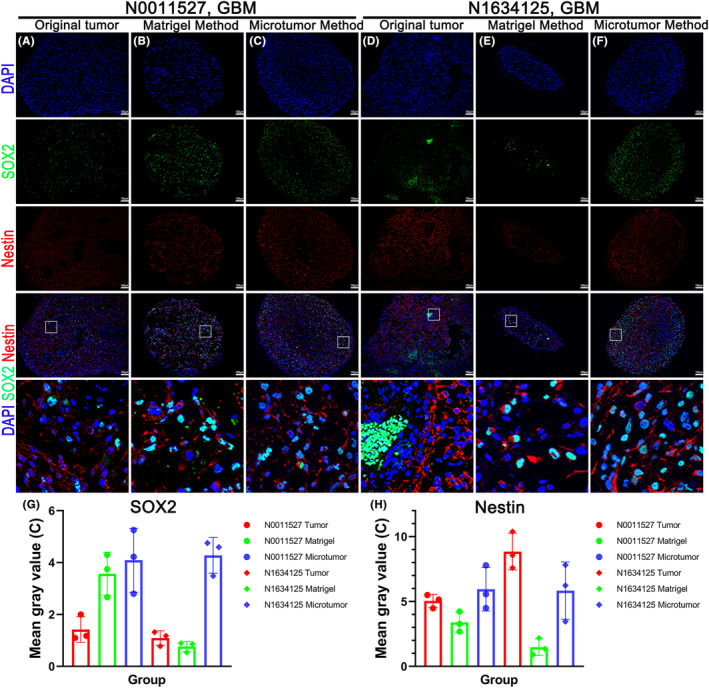
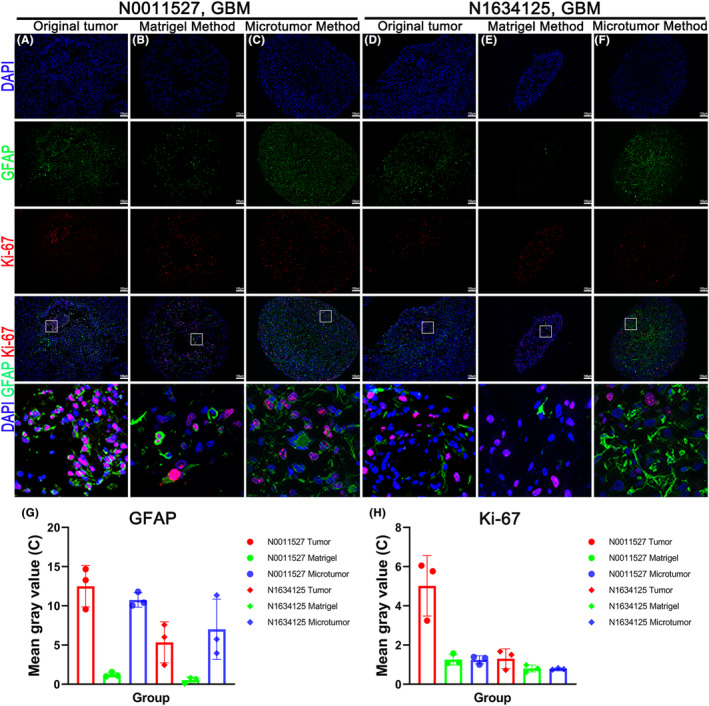
Materials and methods: We compared the organoids generated using two methods through growth analysis, immunohistological analysis, genetic testing, and the establishment of xenograft models.

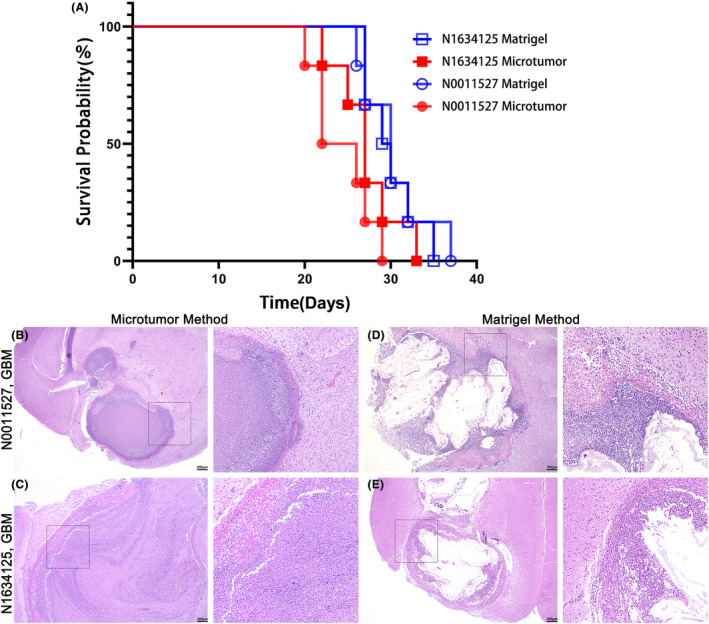
Results: Both types of organoids exhibited rapid infiltration when transplanted into the brains of adult immunodeficient mice. However, organoids formed using the microtumor method demonstrated more similar cellular characteristics and tissue structures to the parent tumors. Furthermore, the microtumor method allowed for faster culture times and more convenient operational procedures compared to the Matrigel method.

Discussion: Patient-derived glioma organoids, especially those generated through the microtumor method, present a promising avenue for personalized treatment strategies. Their capacity to faithfully mimic the cellular and molecular characteristics of gliomas provides a valuable platform for elucidating tumor biology and evaluating therapeutic modalities.

Conclusion: The success rates of the Matrigel and microtumor methods were 45.5% and 60.5%, respectively. The microtumor method had a higher success rate, shorter establishment time, more convenient passage and cryopreservation methods, better simulation of the cellular and histological characteristics of the parent tumor, and a high genetic guarantee.

Keywords: glioma; organoid; patient-derived orthotopic xenograft model; stem cell.


Conflict of interest statement

The authors declare there is no conflict of interest in the study.

Figures

FIGURE 1
FIGURE 1
Generation of organoids using Matrigel and microtumor methods. (A) Overview of the organoids generation process from excised tumor tissue and subsequent operations. The panel was created using images from www.biorender.com. (B–E) Light microscope images of the first growth mode of organoids, cultured using the Matrigel method for 1 day, 1 week, 3 weeks, and 6 weeks. Scale bars, 200 μm. (F–I) Light microscope images of the second growth mode of organoids, cultured using the Matrigel method for 1 day, 1 week, 3 weeks, and 6 weeks. Scale bars, 200 μm. (J, R–T) Bright‐field images of organoids, cultured using the microtumor method. Scale bars, 2 mm. (K–O) Light microscope images of the microtumor method for 1 week, 3 weeks, 8 weeks, 12 weeks, and first generation. Scale bars, 200 μm. (P–Q) Two special organoids. Scale bars, 200 μm.
FIGURE 2
FIGURE 2
H&E staining of parental tumors and organoids formed using two methods. (A, D, G, K, I, and M) H&E staining results of N1634125, N0011527, N0007420, N0013133, N1381741, and N1244013 parent tumors. Scale bars, 100 μm. (B, E, H, and L) H&E staining results in an organoid at 4 weeks, when cultured using the microtumor method. Scale bars, 100 μm. (C, F, J, and N) H&E staining resulted in an organoid at 4 weeks when cultured using the Matrigel method. Scale bars, 100 μm.
FIGURE 3
FIGURE 3
The organoids inherited the stemness markers of the original tumor. (A–F) Immunofluorescence staining images of SOX2 and NESTIN in the original tumor sample and the organoids cultured using the microtumor and Matrigel methods after 4 weeks. Scale bar, 100 μm. (G and H) Quantitative analysis of the immunofluorescence images in (A–F) using ImageJ software.
FIGURE 4
FIGURE 4
The organoids inherited the glial markers and proliferation indicators from the original tumor. (A–F) Immunofluorescence staining images of GFAP and Ki‐67 in the original tumor samples and organoids cultured using the microtumor and Matrigel methods after 4 weeks. Scale bar, 100 μm. (G and H) Quantitative analysis of the immunofluorescence images in (A–F) using ImageJ software.
FIGURE 5
FIGURE 5
Organoids inherit the characteristic markers of the original tumor. (A–L) Fluorescent immunohistochemistry confocal images of the original tumor sample and organoids cultured using microtumor and Matrigel methods after 4 weeks, stained for IHD1 and EGFR. Scale bars, 100 μm. (M and N) Quantitative analysis of the immunofluorescence images in (A–L) using ImageJ software.
FIGURE 6
FIGURE 6
The vascular and proliferation gradients within the organoids. (A–C) Fluorescent immunohistochemistry confocal images of the original tumor sample and organoids cultured using microtumor and Matrigel methods after 4 weeks, stained for CD31. Scale bars, 50 μm. (D–K) Immunofluorescence images of CyQUANT™ Direct Cell Proliferation Assay were used to detect the proliferation within the organoids at 3 and 8 weeks of culture. Scale bar, 100 μm. (M and N) Quantitative analysis of the immunofluorescence images in (D–K) using ImageJ software.
FIGURE 7
FIGURE 7
The internal hypoxia and apoptosis within the organoids. (A–D) Immunohistochemical images of the internal hypoxic status within the organoids at 4 weeks of culture using the Hypoxyprobe™‐1 Kit. Scale bar, 100 μm. (E) Fluorescent immunohistochemistry confocal images of organoids cultured using the microtumor method after 4 weeks, stained for CA‐IX. Scale bars, 100 μm. (F and G) Fluorescent immunohistochemistry confocal images of organoids cultured using the microtumor method after 4 weeks, stained for TUNEL. Scale bars, 100 μm.
FIGURE 8
FIGURE 8
Establishment of PDOX model. (A) Xenograft mouse survival curve: 10 organoids were implanted in each group (N = 6, p = 0.0183, Gehan–Breslow–Wilcoxon test). (B–E) H&E staining results of the mouse brain. Scale bars, 200 μm.
FIGURE 9
FIGURE 9
Whole exome sequencing on the organoids and their parents. (A, C) Venn diagrams showing genes with insertion and deletion mutations in the parental tumor and organoids cultured using two methods. (B, D) Venn diagrams showing genes with single nucleotide variations in the parental tumor and organoids cultured using two methods. (E) Variant allele frequency of glioma‐specific gene mutations in organoids and parental tumors.

References

    1. Ostrom QT, Gittleman H, Liao P, et al. CBTRUS statistical report: primary brain and central nervous system tumors diagnosed in the United States in 2007‐2011. Neuro‐Oncology. 2014;16(Suppl 4):iv1‐iv63. - PMC - PubMed
    1. Fernandes C, Costa A, Osório L, et al. Current standards of care in glioblastoma therapy. In: De Vleeschouwer S, ed. Glioblastoma. Codon Publications; 2017. Chapter 11. - PubMed
    1. Vollmann‐Zwerenz A, Leidgens V, Feliciello G, Klein CA, Hau P. Tumor cell invasion in glioblastoma. Int J Mol Sci. 2020;21(6):1932. - PMC - PubMed
    1. Patel AP, Tirosh I, Trombetta JJ, et al. Single‐cell RNA‐seq highlights intratumoral heterogeneity in primary glioblastoma. Science. 2014;344(6190):1396‐1401. - PMC - PubMed
    1. Wick W, Weller M, van den Bent M, et al. MGMT testing—the challenges for biomarker‐based glioma treatment. Nat Rev Neurol. 2014;10(7):372‐385. - PubMed

Publication types

LinkOut - more resources