. 2024 Mar 26;43(3):113932.
doi: 10.1016/j.celrep.2024.113932. Epub 2024 Mar 7.

Leishmania braziliensis enhances monocyte responses to promote anti-tumor activity

Affiliations

Leishmania braziliensis enhances monocyte responses to promote anti-tumor activity

Jéssica Cristina Dos Santos et al. Cell Rep. .

Abstract

Innate immune cells can undergo long-term functional reprogramming after certain infections, a process called trained immunity (TI). Here, we focus on antigens of Leishmania braziliensis, which induced anti-tumor effects via trained immunity in human monocytes. We reveal that monocytes exposed to promastigote antigens of L. braziliensis develop an enhanced response to subsequent exposure to Toll-like receptor (TLR)2 or TLR4 ligands. Mechanistically, the induction of TI in monocytes by L. braziliensis is mediated by multiple pattern recognition receptors, changes in metabolism, and increased deposition of H3K4me3 at the promoter regions of immune genes. The administration of L. braziliensis exerts potent anti-tumor capabilities by delaying tumor growth and prolonging survival of mice with non-Hodgkin lymphoma. Our work reveals mechanisms of TI induced by L. braziliensis in vitro and identifies its potential for cancer immunotherapy.

Keywords: CP: Cancer; CP: Immunology; Leishmania braziliensis; anti-tumor activities; enhanced cytokines responsiveness; human monocytes; non-Hodgkin lymphoma; trained immunity.


Conflict of interest statement

Declaration of interests The authors declare no competing interests.

Figures

Figure 1.
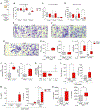
Figure 1.. L. braziliensis induces trained immunity in vitro
(A) Experimental setup. (B) TNF and IL-6 release from monocytes trained with RPMI, β-glucan (5 μg/mL), or L. braziliensis lysates (50, 25, 10, and 1 μg/mL) for 24 h after LPS (10 ng/mL) restimulation at day 7, measured by ELISA. (C–F) (C) TNF release from L. braziliensis lysates-trained macrophages (25 μg/mL) after restimulation with Pam3Cys (10 μg/mL) at day 7. TNF production after LPS restimulation at day 7 of L. braziliensis-trained (25 μg/mL) macrophages ± (D) cytochalasin B and anti-CR3, (E) anti-TLR2 and B. quintana LPS (Bart. LPS, TLR4 antagonist), the RIP2 kinase inhibitor ponatinib, and (F) anti-dectin-1 and the Syk and Raf inhibitors R406 and GW5074, respectively. As controls, isotype control antibody, RPMI (−), or RPMI + DMSO (vehicle) were used as indicated. n = 6 independent donors. Cytokine measurements are represented as fold increase normalized to RPMI (non-trained cells). Data in (B–F) are shown in box-and-whiskers (minimum-to-maximum) plots from two independent experiments (*p < 0.05 by Wilcoxon test; ns, p > 0.05). (G) Principal component analysis (PCA) plot of gene expression dynamic across treatment and time points (RPMI, black; L. braziliensis lysates, red; day 0, circles; 24 h, triangles; day 6, squares). (H) Heatmap of differentiated expressed genes (upregulated, red; downregulated, blue) at baseline (day 0) and at the indicated time points (day 1 and day 6) after RPMI or L. braziliensis lysates exposure (25 μg/mL). (I) Time-resolved median expression of genes transiently or gradually induced in L. braziliensis-exposed cells. (J and K) Most abundant pathways (J) upregulated and (K) downregulated based on gene expression analysis 24 h after treatment. n = 3 independent donors from one experiment. See also Figures S1 and S2.
Figure 2.
Figure 2.. L. braziliensis training relies on JNK activation, metabolism, and H3K4me3 deposition
(A and B) (A) Experimental setup. TNF production after LPS (10 ng/mL) restimulation at day 7 of L. braziliensis-trained (25 μg/mL) macrophages ± (B) the PI3K/AKT, mTOR inhibitors wortmannin and rapamycin/torin, respectively, and the JNK inhibitor SP600125. As controls, RPMI (−) or RPMI + DMSO (vehicle) were used as indicated. (C) Basal and maximum extracellular acidification rates (ECAR) of RPMI- and L. braziliensis-trained macrophages at day 6, measured by Seahorse. (D) Lactate production assessed in the supernatant of trained macrophages at day 6 by fluorometric assay. (E) Basal and maximum oxygen consumption rate (OCR) of RPMI- and L. braziliensis-trained macrophages at day 6, measured by Seahorse. (F) TNF production after LPS restimulation at day 7 of RPMI-exposed and L. braziliensis-trained (25 μg/mL) macrophages ± the methyltransferase inhibitors MTA and CPH. (G) Levels of H3K4me3 at TNF, IL6, and CCL2 promoters of RPMI- and L. braziliensis-exposed macrophages assessed by chromatin immunoprecipitation-qPCR. n = 6 independent donors. Cytokine measurements are presented as fold increase normalized to RPMI (non-trained cells). Data are shown in box-and-whiskers (minimum-to-maximum) plots from two independent experiments (*p < 0.05; **p < 0.01 by Wilcoxon test; ns, p > 0.05). See also Figure S3.
Figure 3.
Figure 3.. L. braziliensis-trained macrophages are permissive for intracellular growth of Leishmania amastigotes in vitro
(A) Experimental setup. (B–D) (B) Percentages of infected macrophages, (C) number of parasites per infected cell, and (D) infection index were assessed in RPMI- and L. braziliensis-trained (25 μg/mL) macrophages on day 6, 2 h, 24 h, and 48 h post infection with L. braziliensis promastigotes (MOI 5) by Giemsa. (E–G) Representative figures of RPMI- and L. braziliensis-treated macrophages (E) 2 h, (F) 24 h, and (G) 48 h post infection captured by light microscope (20×). (H) TNF and IL-6 release from L. braziliensis lysates-trained macrophages (25 μg/mL) after exposure to L. braziliensis promastigotes (MOI 5) measured by ELISA at day 7, 24 h post infection. (I) Reactive oxygen species (ROS) represented as area under the curve of a total 1-h period of RPMI- and L. braziliensis-trained macrophages restimulated with zymosan (1 mg/mL, positive control) and L. braziliensis lysates (25 μg/mL). ROS production was assessed by luminol-enhanced chemiluminescence assay. (J) Levels of H3K4me3 at IL1B and IL1RN promoters of RPMI- and L. braziliensis-exposed macrophages assessed by ChiP-qPCR. (K and L) (K) IL1B mRNA expression and (L) total intracellular IL-1β production measured in cell lysates of L. braziliensis-trained (25 μg/mL) macrophages on day 6 after L. braziliensis lysates (25 μg/mL) and LPS (10 ng/mL) restimulation by qPCR and ELISA, respectively. (M) IL-1β secretion in the supernatant of RPMI- and L. braziliensis-trained macrophages after restimulation of LPS (10 ng/mL) and L. braziliensis lysates (25 μg/mL) for 23 h followed by an additional 1-h incubation with ATP (1.25 mM). (N) IL-1Ra secretion in the supernatant of RPMI- and L. braziliensis-trained macrophages after LPS (10 ng/mL) and L. braziliensis restimulation. Both IL-1β and IL-1Ra were assessed in the supernatants using ELISA. n = 6 independent donors. IL1B mRNA are presented as fold increase normalized to RPMI (non-trained cells). Data are shown in box- and-whiskers (minimum-to-maximum) plots from two independent experiments (*p < 0.05; **p < 0.01 by Wilcoxon test; ns, p > 0.05).
Figure 4.
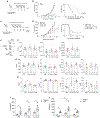
Figure 4.. L. braziliensis injection delays tumor growth and prolonged survival of A20 non-Hodgkin-lymphoma-bearing mice
(A) Experimental setup. (B) In vivo tumor growth and survival curves of BALB/c mice, which were inoculated with 1 × 10⁶ A20 tumor cells and submitted to a regimen consisted of three subcutaneous injections of PBS or L. braziliensis lysates (0.33 mg/mL each injection). Overall survival was followed up for 100 days (n = 12). Significance was calculated between the groups (*p < 0.05, ** p < 0.01 by t test and log rank, respectively). (C) Experimental setup of checkpoint inhibitor experiment. (D) In vivo tumor growth and survival curves of tumor-bearing BALB/c mice, which were randomized into one of the four treatment groups consisting of PBS and L. braziliensis in combination with anti-PD-1 (200 μg/mouse) and isotype control (200 μg/mouse) antibody regimens. The antibodies were administered intraperitoneally twice a week, starting after the administration of the first dose of PBS or L. braziliensis and lasted until day 37 post tumor implantation. Overall survival was followed up for 130 days (n = 12). Significance was calculated between all groups (*p < 0.05 by t test and log rank, respectively). (E) Experimental setup of ex vivo bone marrow phenotyping and splenocyte-derived cytokine production. Mice were injected with a single dose of L. braziliensis for 7 days or three doses of L. braziliensis or PBS every 7 days. Bone marrow cells were collected for ex vivo immunophenotyping analysis by flow cytometry. (F–H) Percentages of (F) LSKs, LT-HSCs, and ST-HSCs, (G) MMPs, MMP2, MMP3, and MMP4, and (H) MyPs, MEPs, CMPs, and GMPs in PBS- and L. braziliensis-treated mice (n = 5).. (I and J) Splenocytes (5 × 10⁵) of PBS- and L. braziliensis-treated mice submitted to both single- and triple-dose regimens were restimulated for 24 h with LPS (100 ng/mL). Production of (I) IL-1β and (J) IL-6 was assessed in the supernatant by ELISA (n = 5). Data in bar plots are shown as mean ± SD (*p < 0.05 by t test). See also Figures S4 and S5.
Figure 5.
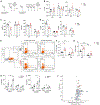
Figure 5.. L. braziliensis injection promotes the infiltration of immune cells into the tumor
(A) Experimental setup. Ex vivo bone marrow phenotyping of tumor-bearing PBS- and L. braziliensis-treated (0.33 mg/mL) mice submitted to both single-dose (day 21) and triple-dose (day 35) regimens injected subcutaneously. (B–D) Percentages of (B) LSKs and LT-HSCs, (C) MMP3 and MMP4, and (D) CMP and GMP were assessed by flow cytometry (n = 5). (E) Representative flow-cytometry plots. (F and G) Percentages of (F) CD45+CD11b+ and (G) CD45+CD8+ cells in the tumor lesion were assessed by flow cytometry (n = 5). 5 × 10⁵ splenocytes of were restimulated for 24 h with LPS (100 ng/mL). (H and I) Production of (H) IL-1β and (I) IL-6 was assessed in the supernatant by ELISA (n = 5). (J) Proteins measured in the serum by Olink in both tumor-bearing PBS- and L. braziliensis-treated mice 35 days after tumor implantation. Volcano plot showing the differentially expressed proteins between the two groups (log2 values; significant proteins are marked in red; false discovery rate adjusted *p < 0.05). Data in bar plots are shown as mean ± SD (*p < 0.05, ** p < 0.01 by t test). See also Figure S6.

References

    1. Murray HW, Berman JD, Davies CR, and Saravia NG (2005). Advances in leishmaniasis. Lancet 366, 1561–1577. 10.1016/S0140-6736(05)67629-5. - DOI - PubMed
    1. Araujo-Pereira T.d., Pita-Pereira D.d., Moreira RB, Silva-Galdino T, Duarte M.P.d.O., Brazil RP, and Britto C (2018). Molecular diagnosis of cutaneous leishmaniasis in an endemic area of Acre State in the Amazonian Region of Brazil. Rev. Soc. Bras. Med. Trop 51, 376–381. 10.1590/0037-8682-0232-2017. - DOI - PubMed
    1. Beattie L, and Kaye PM (2011). Leishmania-host interactions: what has imaging taught us? Cell Microbiol. 13, 1659–1667. 10.1111/j.1462-5822.2011.01658.x. - DOI - PubMed
    1. Liese J, Schleicher U, and Bogdan C (2008). The innate immune response against Leishmania parasites. Immunobiology 213, 377–387. 10.1016/j.imbio.2007.12.005. - DOI - PubMed
    1. Ibraim IC, de Assis RR, Pessoa NL, Campos MA, Melo MN, Turco SJ, and Soares RP (2013). Two biochemically distinct lipophos-phoglycans from Leishmania braziliensis and Leishmania infantum trigger different innate immune responses in murine macrophages. Parasit. Vectors 6, 54. 10.1186/1756-3305-6-54. - DOI - PMC - PubMed

Publication types