Association Between Different Types of Physical Activity and Hepatic Steatosis and Liver Fibrosis: A Cross-Sectional Study Based on NHANES
- PMID: 38457411
- PMCID: PMC11702900
- DOI: 10.1097/MCG.0000000000001985
Association Between Different Types of Physical Activity and Hepatic Steatosis and Liver Fibrosis: A Cross-Sectional Study Based on NHANES
Abstract
Background and aims: Many studies have shown a link between physical activity (PA) and nonalcoholic fatty liver disease (NAFLD). However, more research is needed to investigate the relationship between different types of PA and NAFLD. This study aimed to explore the potential link between different types of PA, hepatic steatosis, and liver fibrosis.
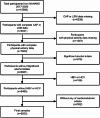
Study: A cross-sectional study was conducted using the data set from the National Health and Nutrition Examination Survey (NHANES) from 2017 to 2020. A multiple linear regression model was used to examine the linear relationship between different types of PA, the controlled attenuation parameter (CAP), and liver stiffness measurement (LSM). In addition, smoothing curve fitting and threshold effect analysis were used to depict their nonlinear relationship.
Results: This study involved 5933 adults. Multiple linear regression analysis revealed a significantly negative correlation between leisure-time PA and CAP, while the relationship between occupation-related PA, transportation-related PA, and CAP was not significant. Subgroup analysis further revealed that leisure-time PA was significantly negatively correlated with CAP in women and younger age groups (under 60 y old), while the relationship was not significant in men and older age groups. In addition, there was a significant negative correlation between leisure-time PA and liver fibrosis in men.
Conclusions: Leisure-time PA can prevent hepatic steatosis, and women and young people benefit more. Occupation-related PA is not associated with hepatic steatosis and cannot replace leisure-time PA. In men, increasing leisure-time PA is more effective in preventing liver fibrosis.
Copyright © 2024 The Author(s). Published by Wolters Kluwer Health, Inc.
Figures


References
-
- Powell EE, Wong VW, Rinella M. Non-alcoholic fatty liver disease. Lancet. 2021;397:2212–2224. - PubMed
-
- Younossi Z, Tacke F, Arrese M, et al. . Global perspectives on nonalcoholic fatty liver disease and nonalcoholic steatohepatitis. Hepatology. 2019;69:2672–2682. - PubMed
-
- Lonardo A, Byrne CD, Caldwell SH, et al. . Global epidemiology of nonalcoholic fatty liver disease: meta-analytic assessment of prevalence, incidence, and outcomes. Hepatology. 2016;64:1388–1389. - PubMed
-
- Chalasani N, Younossi Z, Lavine JE, et al. . The diagnosis and management of nonalcoholic fatty liver disease: practice guidance from the American Association for the Study of Liver Diseases. Hepatology. 2018;67:328–357. - PubMed
MeSH terms
LinkOut - more resources
Full Text Sources
Medical
Miscellaneous

