. 2024 Mar 8;9(93):eade6256.
doi: 10.1126/sciimmunol.ade6256. Epub 2024 Mar 8.

Transmembrane domain-driven PD-1 dimers mediate T cell inhibition

Affiliations

Transmembrane domain-driven PD-1 dimers mediate T cell inhibition

Elliot A Philips et al. Sci Immunol. .

Abstract

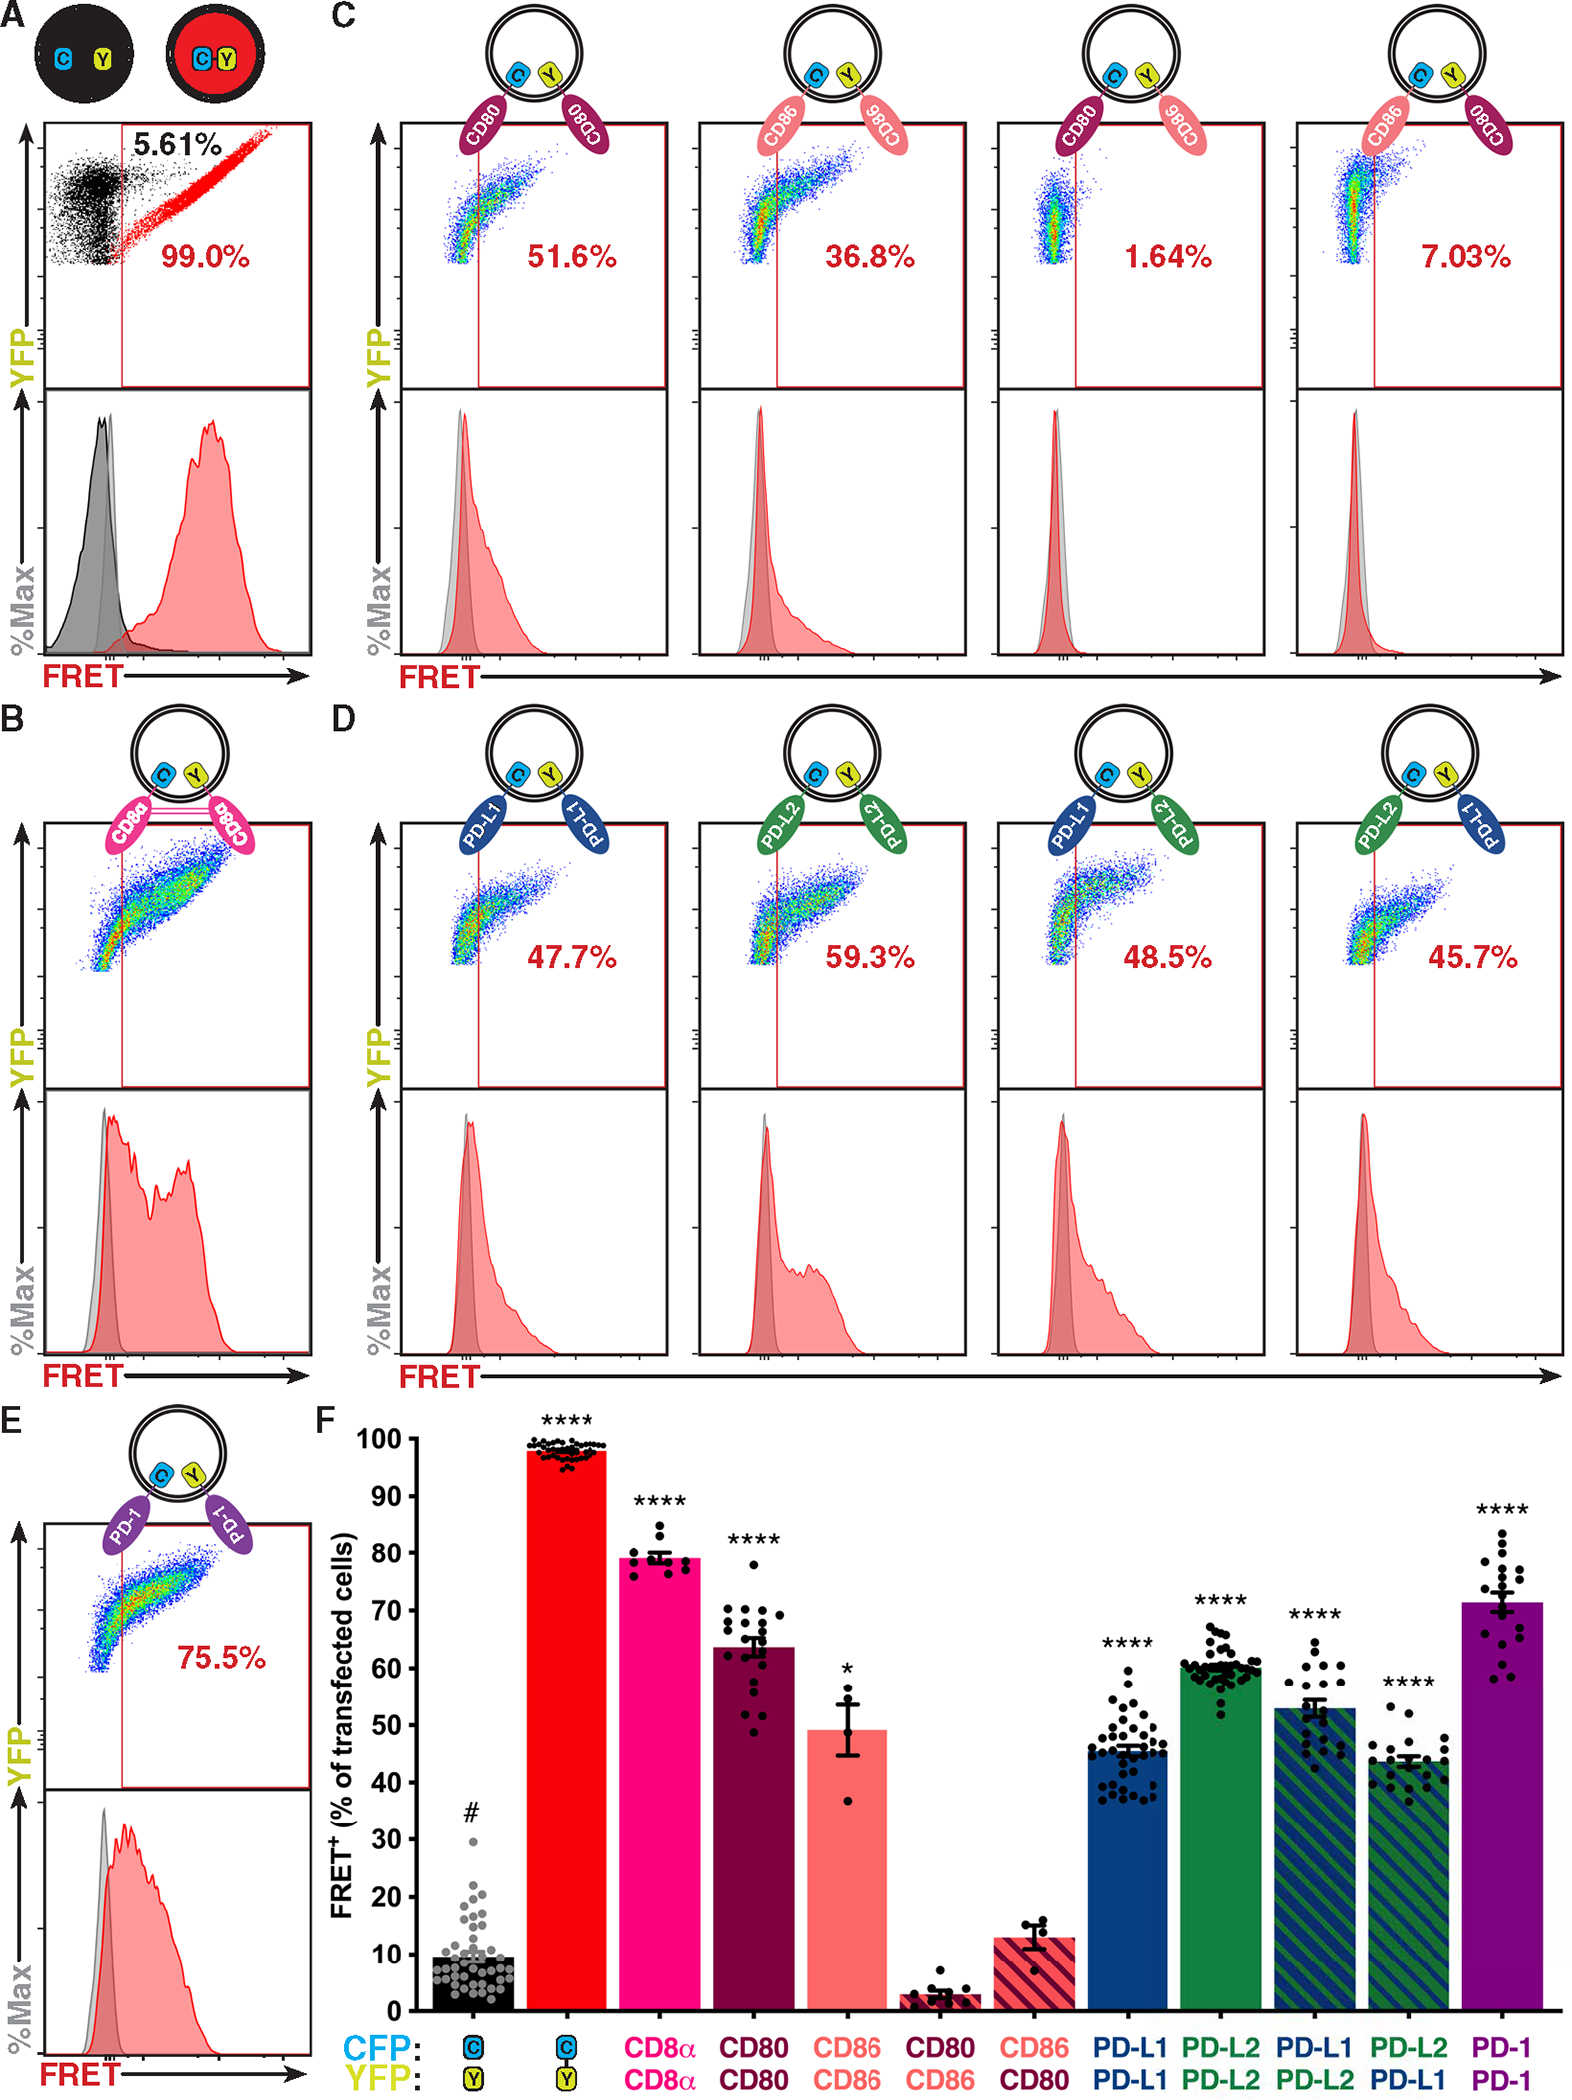
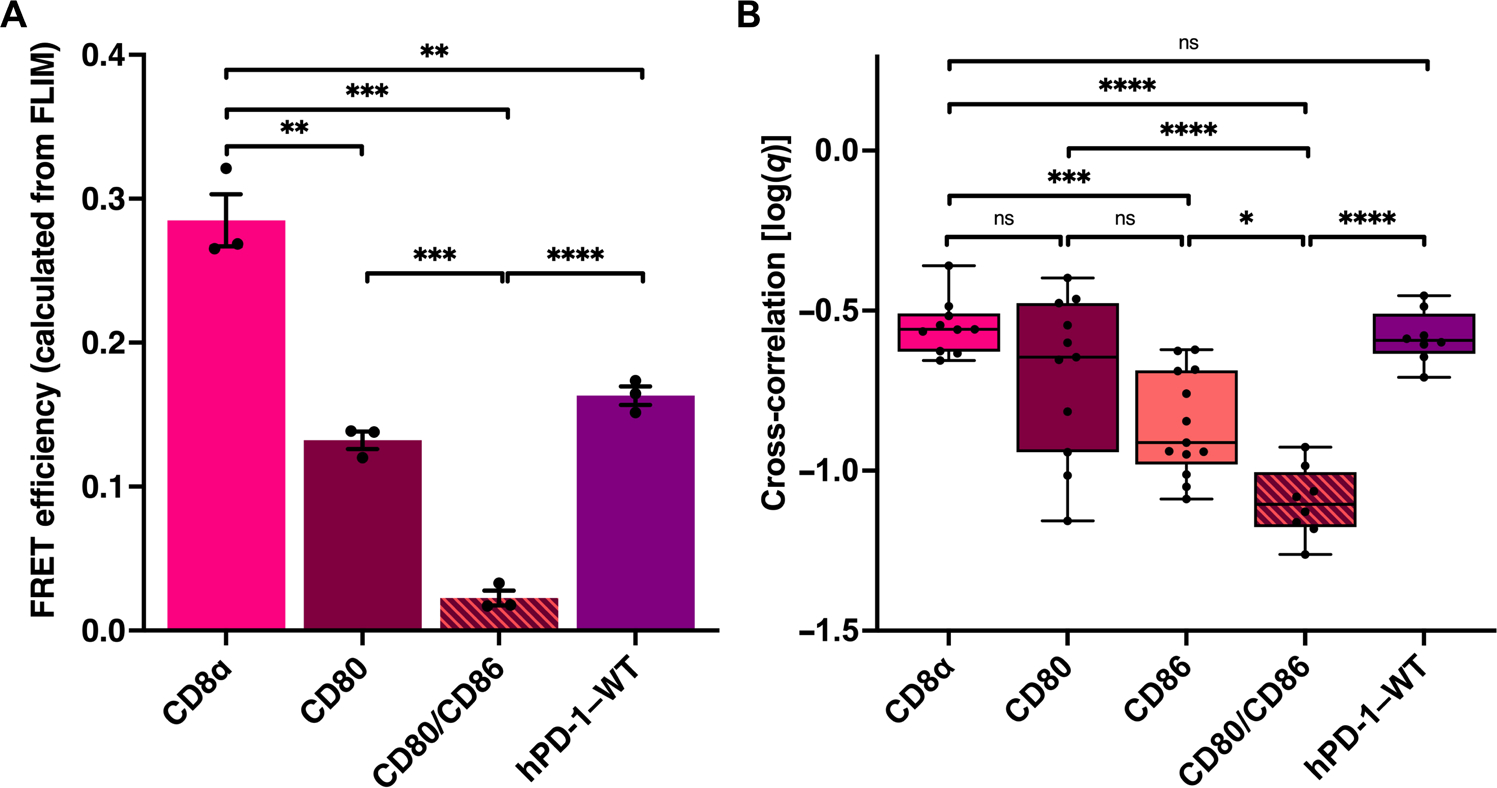
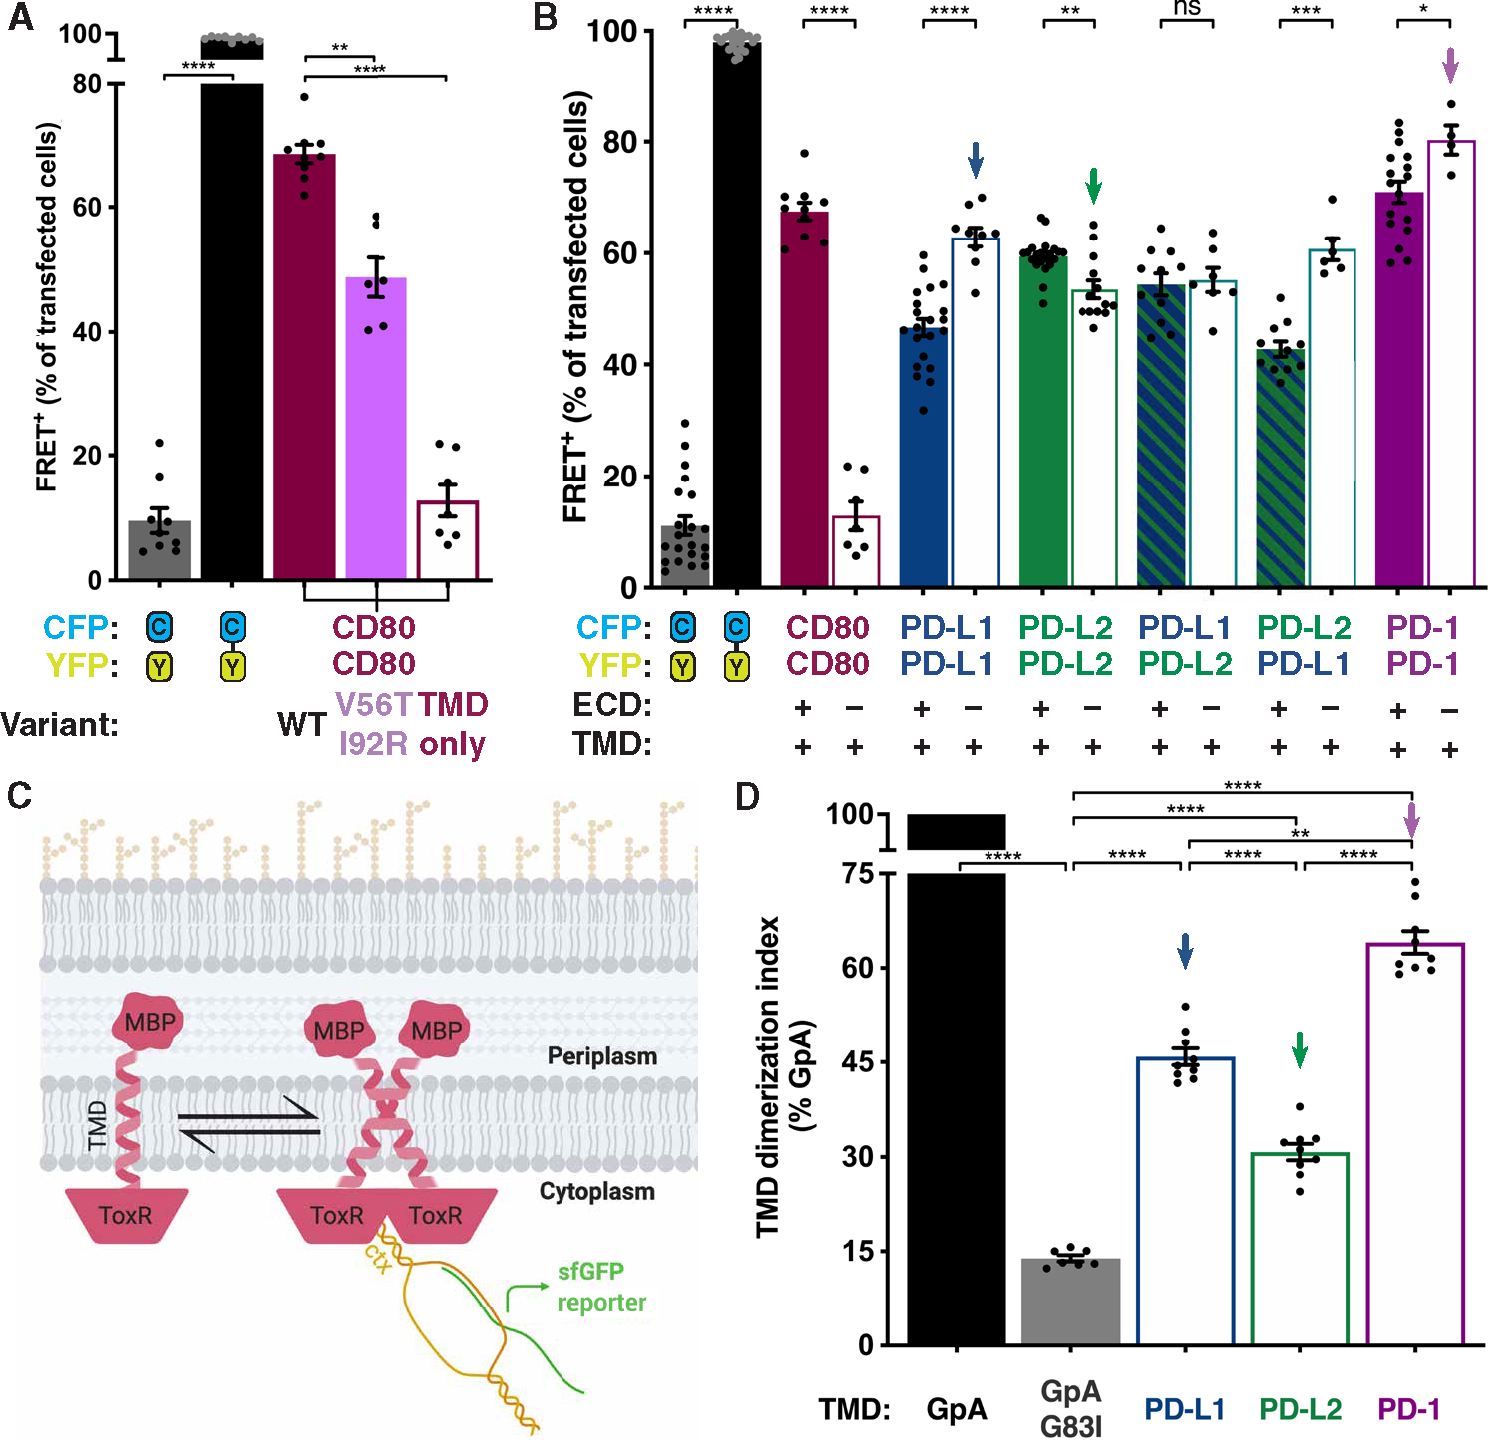
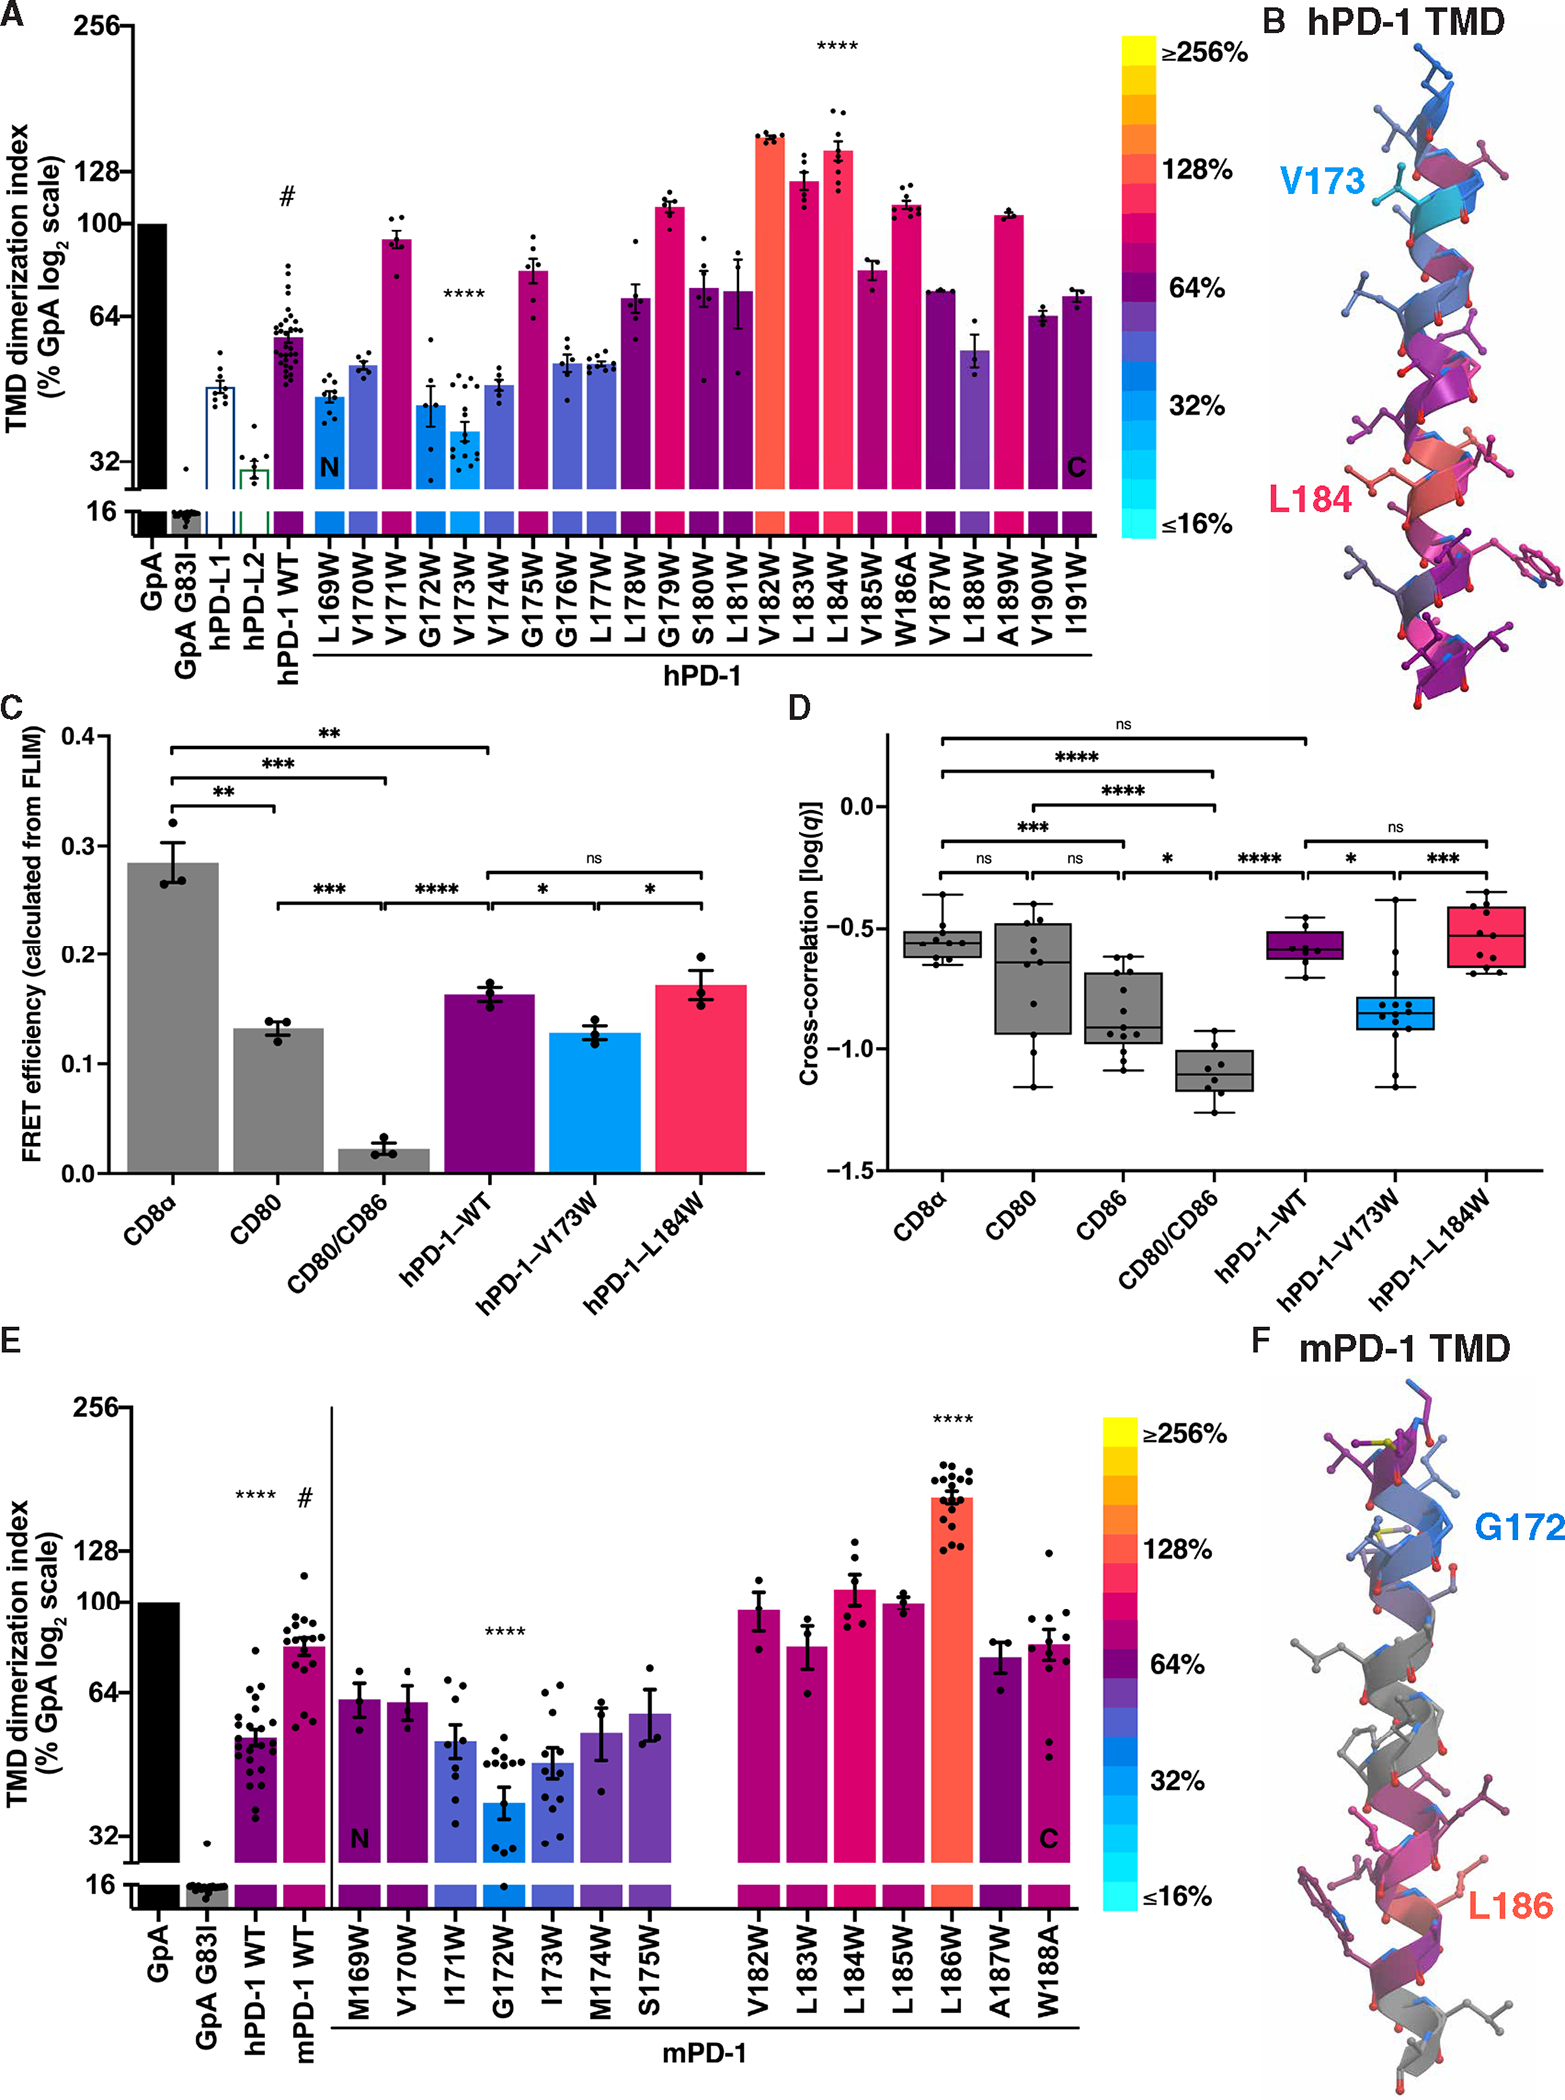
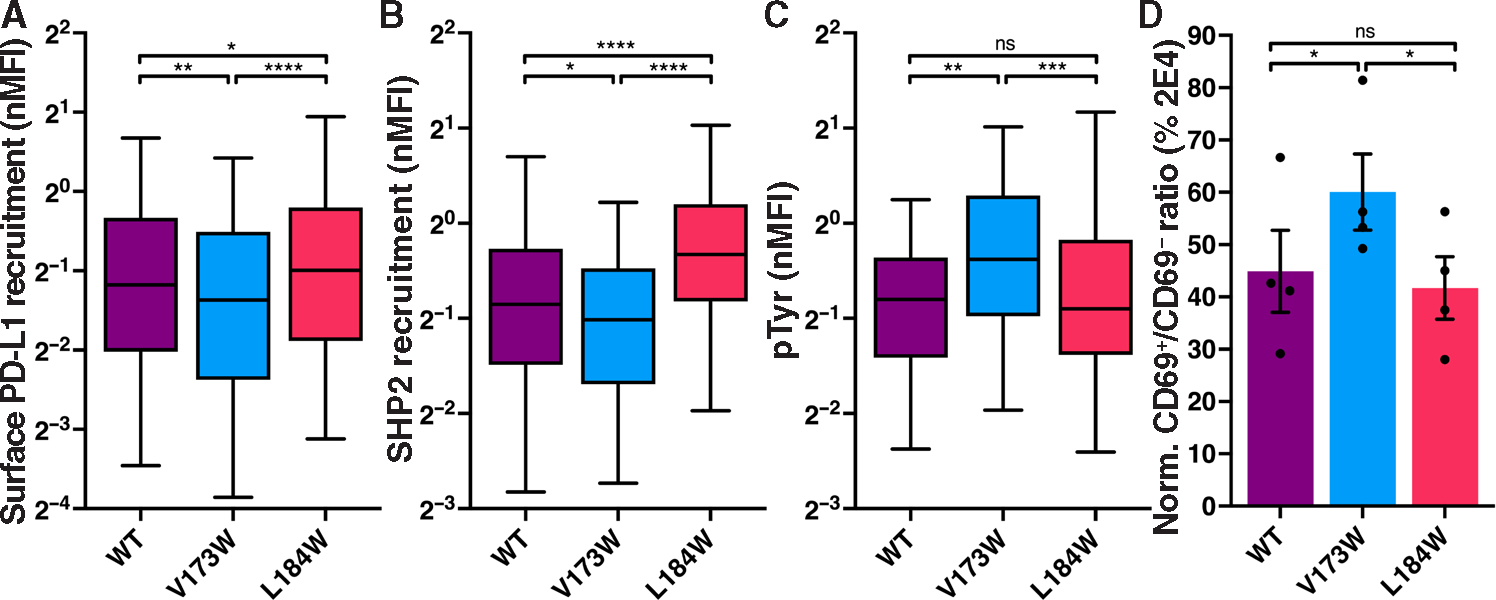
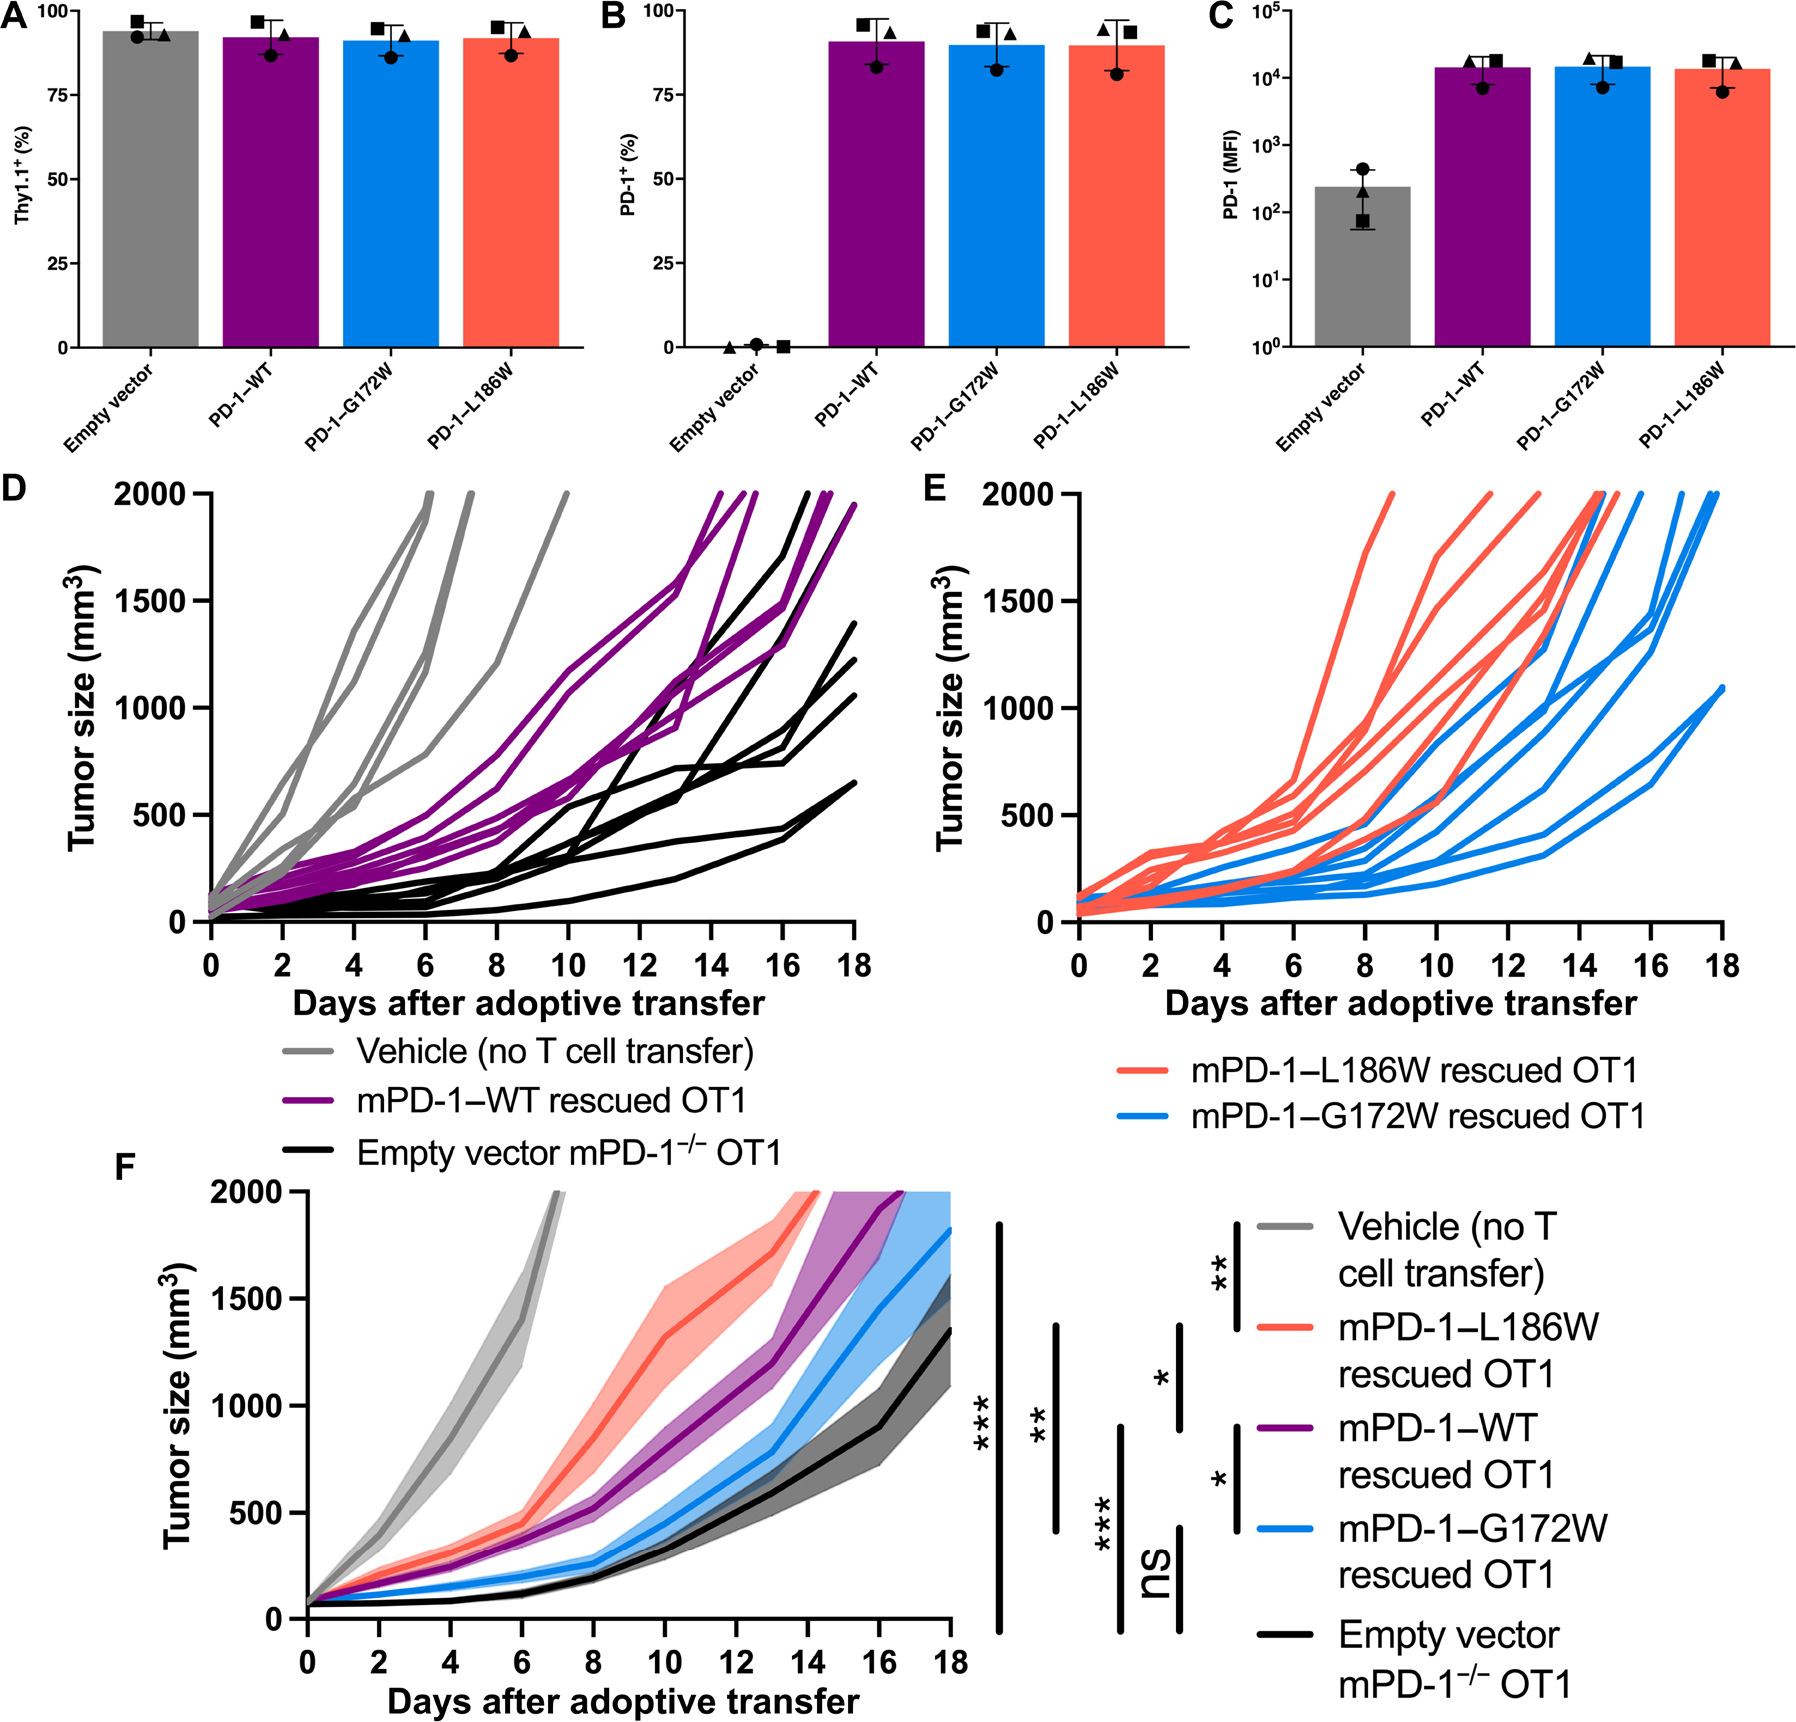
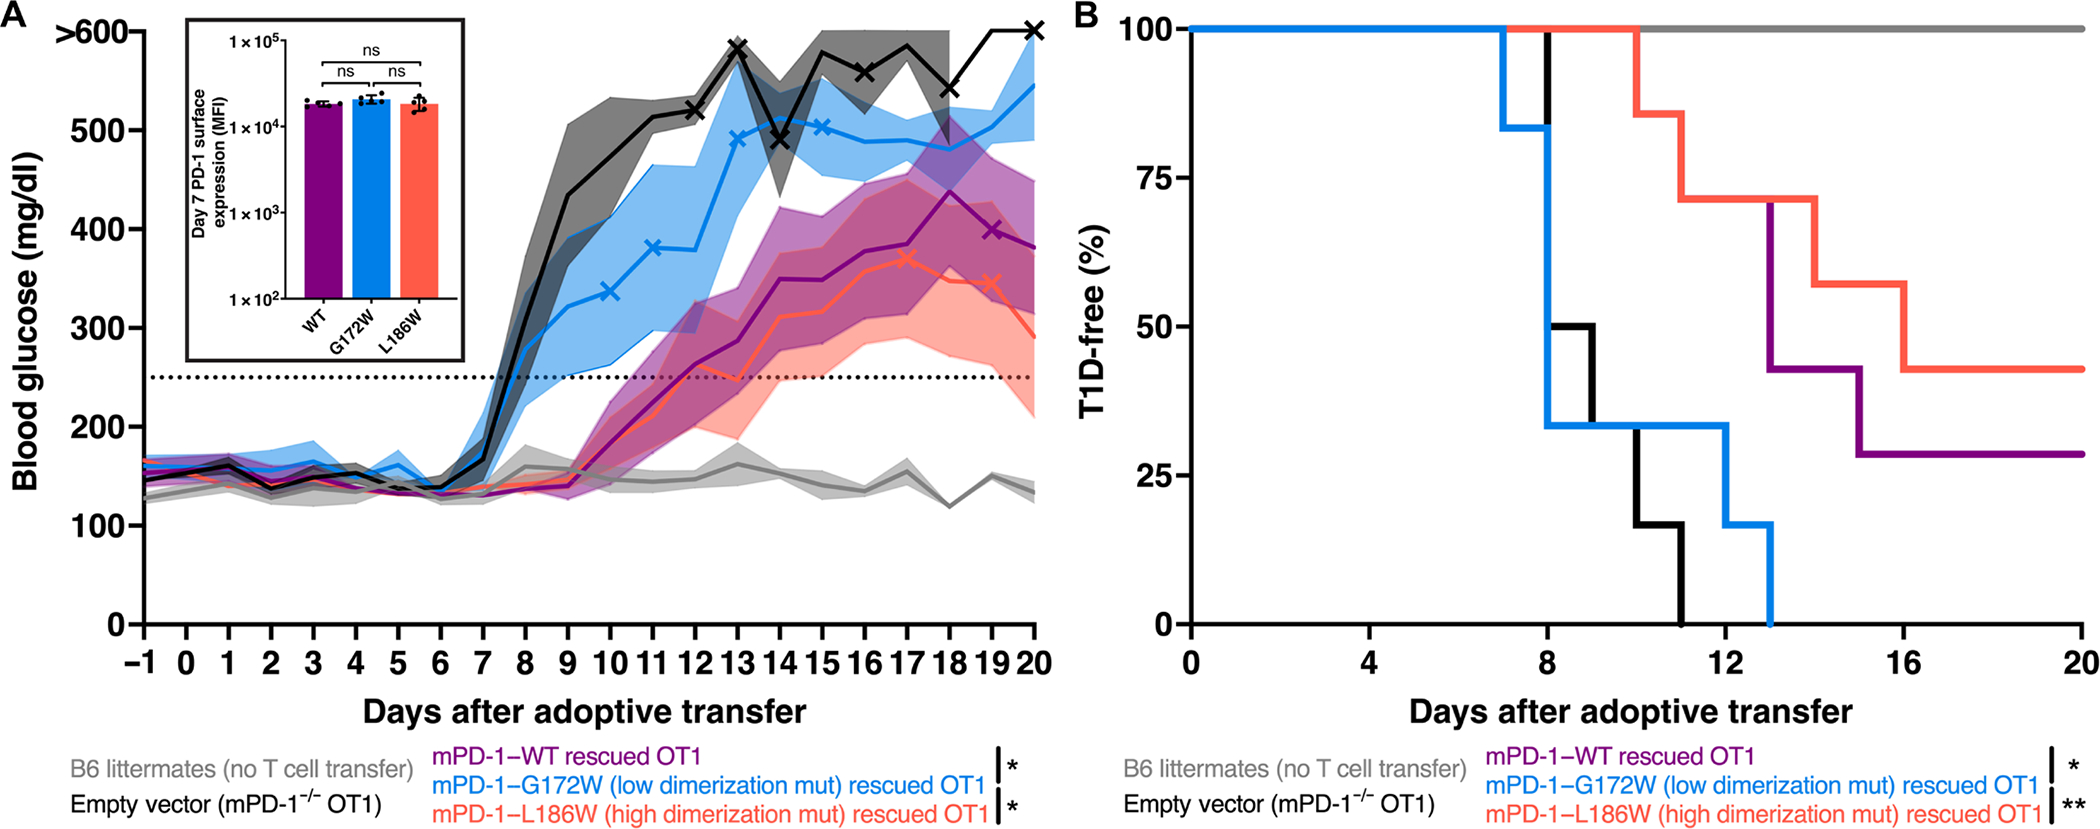
Programmed cell death-1 (PD-1) is a potent immune checkpoint receptor on T lymphocytes. Upon engagement by its ligands, PD-L1 or PD-L2, PD-1 inhibits T cell activation and can promote immune tolerance. Antagonism of PD-1 signaling has proven effective in cancer immunotherapy, and conversely, agonists of the receptor may have a role in treating autoimmune disease. Some immune receptors function as dimers, but PD-1 has been considered monomeric. Here, we show that PD-1 and its ligands form dimers as a consequence of transmembrane domain interactions and that propensity for dimerization correlates with the ability of PD-1 to inhibit immune responses, antitumor immunity, cytotoxic T cell function, and autoimmune tissue destruction. These observations contribute to our understanding of the PD-1 axis and how it can potentially be manipulated for improved treatment of cancer and autoimmune diseases.


Figures

Fig. 1.
Fig. 1.. PD-1 and its ligands dimerize in cis.
(A to E) Flow-FRET analysis of immune receptors expressed in CHO cells as CFP or YFP fusion proteins as depicted above each panel. FRET was determined with gates described in fig. S1A and shown as a representative scatterplot (YFP versus FRET) and histogram (events versus FRET). (A) Controls for minimum (CFP and YFP coexpressed, black) and maximum (CFP fused to YFP, red) flow-FRET. (B) CD8α flow-FRET pair. (C) CD80 and CD86 homo– and hetero–flow-FRET pairs for validation. (D) PD-L1 and PD-L2 homo– and hetero–flow-FRET pairs. (E) PD-1 flow-FRET. (F) Cumulative flow-FRET data (n ≥ 3) displayed as the percent of FRET+ transfected cells ± SEM. Significance shown as paired t tests versus negative control (#): *P < 0.05 and ****P < 0.0001.
Fig. 2.
Fig. 2.. Fluorescence lifetime imaging and cross-correlation spectroscopy demonstrates PD-1 dimerization.
(A) FRET efficiency calculated from FLIM of the indicated mEGFP, mCherry2 fusion protein pairs expressed in baby hamster kidney cells (see fig. S6). (B) FCCS measurements of the indicated mEGFP, mCherry2 fusion protein pairs expressed in HEK293T cells (see fig. S7). Significance tested by unpaired t tests: *P < 0.05, **P < 0.01, ***P < 0.001, and ****P < 0.0001. ns, not significant.
Fig. 3.
Fig. 3.. TMDs drive dimerization of PD-1 and its ligands.
(A and B) Flow-FRET analysis of immune receptors as in Fig. 1. (A) Flow-FRET analysis of CD80: WT, V56T + I92R ECD interface mutations and TMD only to validate assay for ECD-mediated dimerization. (B) Flow-FRET analysis of CD80, PD-L1, PD-L2, and PD-1 TMDs ± ECDs. (C) Schematic of bacterial TOXGREEN TMD dimerization assay (created with BioRender). (D) TOXGREEN analysis of PD-L1, PD-L2, and PD-1 TMD dimerization propensity relative to that of GpA ± G83I mutation that abolished dimerization. Downward arrows in (B) and (D) indicate corresponding conditions. Significance shown as paired t tests: *P < 0.05, **P < 0.01, ***P < 0.001, and ****P < 0.0001.
Fig. 4.
Fig. 4.. hPD-1 and mPD-1 TMDs dimerize using N-terminal contacts.
(A) The effects on dimerization as determined by TOXGREEN of Trp substitutions at the indicated positions in the hPD-1 TMD. Bars were assigned a color on the basis of the log2 scaled look-up table (right). (B) Helical model of the hPD-1 TMD color-coded as in (A) with the V173hPD-1 low and L184hPD-1 high Trp substitutions labeled. (C) FRET efficiency calculated from FLIM of the indicated pairs of mEGFP- and mCherry2-tagged constructs expressed in baby hamster kidney cells. (D) FCCS measurements of mEGFP- and mCherry2-tagged constructs expressed in HEK293T cells pooled across four biological replicates. (E and F) Analysis and color-coding of the mPD-1 TMD as in (A) and (B) revealing G172mPD-1 low and L186mPD-1 high Trp substitutions. Significance in (A), (C), and (E) was determined by unpaired t tests; significance in (D) was determined by ANOVA test with Tukey’s correction for multiple comparisons: *P < 0.05, **P < 0.01, ***P < 0.001, and ****P < 0.0001.
Fig. 5.
Fig. 5.. hPD-1 TMD dimerization affects T cell inhibition.
(A to C) The cells shown in fig. S8 (D to F) were applied to a supported lipid bilayer incorporating ICAM-1, anti-CD3, and PD-L1, and the IS was analyzed by TIRF microscopy. Normalized recruitment of PD-L1, SHP2, or pTyr to the IS is depicted as box and whisker plots. Mean (solid line) and 5 to 5% range (whiskers) are indicated (n ≥ 119). Significance was determined by Mann-Whitney test: *P < 0.05, ***P < 0.001, and ****P < 0.0001. (D) Jurkat cell lines were activated with immobilized anti-CD3 and soluble anti-CD28 in the presence of immobilized PD-L1 and subsequently stained for CD69 expression. Data are displayed as a ratio of CD69+:CD69 cells normalized to the CD69 stain ratio of 2E4 PD-1–KO cells. nMNFI, normalized mean fluorescence intensity.
Fig. 6.
Fig. 6.. PD-1 dimerization limits cytotoxic T cell antitumor activity in vivo.
(A to C) Thy1.1 and PD-1 expression on reconstituted PD-1−/− OT1 CD8+ T cells after RV transduction with the indicated vector. (D to F) B16-OVA tumor growth in WT C57BL/6 mice after adoptive transfer with OT1 T cells retrovirally transduced as in (A) to (C). (D) Spider chart of tumor growth in individual mice with no T cell transfer (gray), PD-1–WT reconstituted OT1 cells (purple), or PD-1−/− EV transduced OT1 cells (black). Spider chart of tumor growth with PD-1–G172W reconstituted OT1 cells (blue) or PD-1–L186W reconstituted OT1 cells (orange). (F) Cumulative B16-OVA tumor growth as in (D) and (E) with SEM indicated by transparent shading. Representative experiment with five mice in the vehicle group and seven mice in the EV, mPD-1–WT, mPD-1–G172W, and mPD-1–L186W groups. Significance was tested by two-way ANOVA: *P < 0.05, **P < 0.01, and ***P < 0.001.
Fig. 7.
Fig. 7.. PD-1 dimerization regulates islet cell–specific cytotoxic T cells that induce T1D in vivo.
(A) Blood glucose measurements after adoptive transfer of indicated OT1 cells into recipient RIP-mOVA mice with SEM indicated by transparent shading. Mice were considered diabetic after two consecutive readings above 250 mg/dl (dotted line). X symbol indicates deaths. Significance was tested by two-way ANOVA on data before day 11: *P < 0.05. Insert: PD-1 surface expression on day 7 after adoptive transfer. (B) Kaplan-Meyer plot of diabetes-free mice from (A). Representative experiment with four mice in the littermates group, six mice in the EV and mPD-1–G172W groups, and seven mice in the mPD-1–WT and mPD-1–L186W groups. Significance was tested by Gehan-Breslow-Wilcoxon test: *P < 0.05 and **P < 0.01.

References

    1. Sharma P, Allison JP, Immune checkpoint targeting in cancer therapy: Toward combination strategies with curative potential. Cell 161, 205–214 (2015). - PMC - PubMed
    1. Wherry EJ, T cell exhaustion. Nat. Immunol. 12, 492–499 (2011). - PubMed
    1. Tai Y, Wang Q, Korner H, Zhang L, Wei W, Molecular mechanisms of T cells activation by dendritic cells in autoimmune diseases. Front. Pharmacol. 9, 642 (2018). - PMC - PubMed
    1. Sharpe AH, Freeman GJ, The B7-CD28 superfamily. Nat. Rev. Immunol. 2, 116–126 (2002). - PubMed
    1. Greenwald RJ, Freeman GJ, Sharpe AH, The B7 family revisited. Annu. Rev. Immunol. 23, 515–548 (2005). - PubMed

Publication types

Substances