. 2024 May;103(5):103582.
doi: 10.1016/j.psj.2024.103582. Epub 2024 Feb 22.

Effects of L-Leu-L-Leu peptide on growth, proliferation, and apoptosis in broiler intestinal epithelial cells

Affiliations

Effects of L-Leu-L-Leu peptide on growth, proliferation, and apoptosis in broiler intestinal epithelial cells

Jing Liang et al. Poult Sci. 2024 May.

Abstract

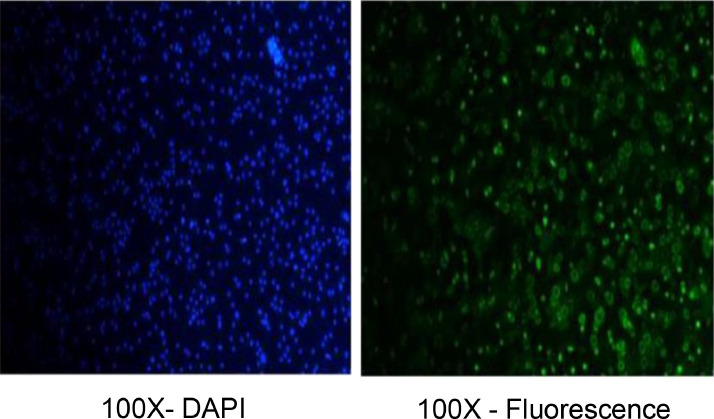
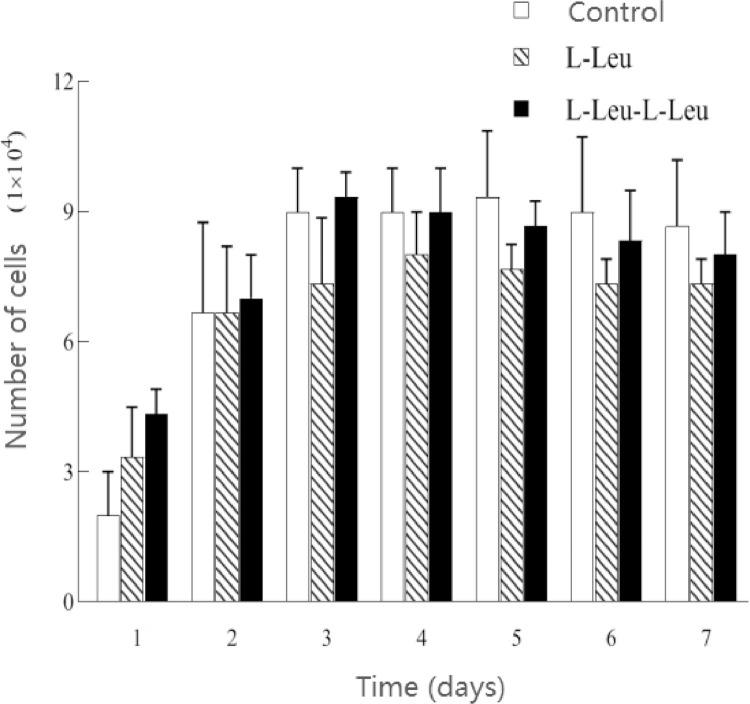
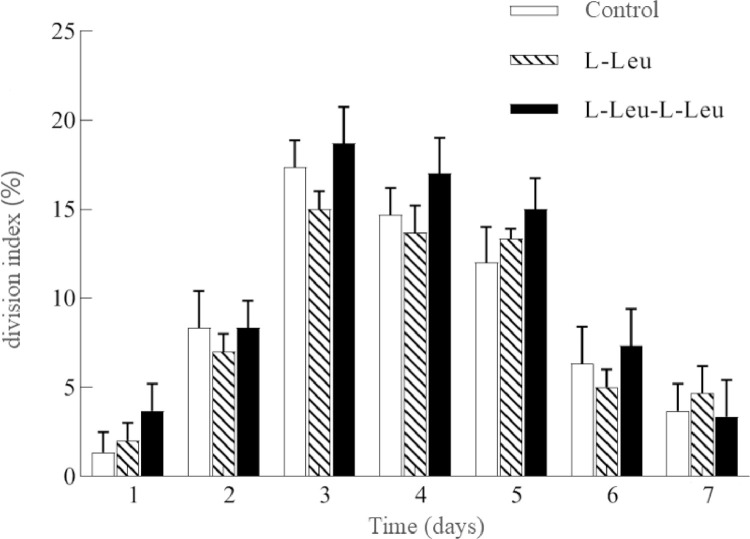
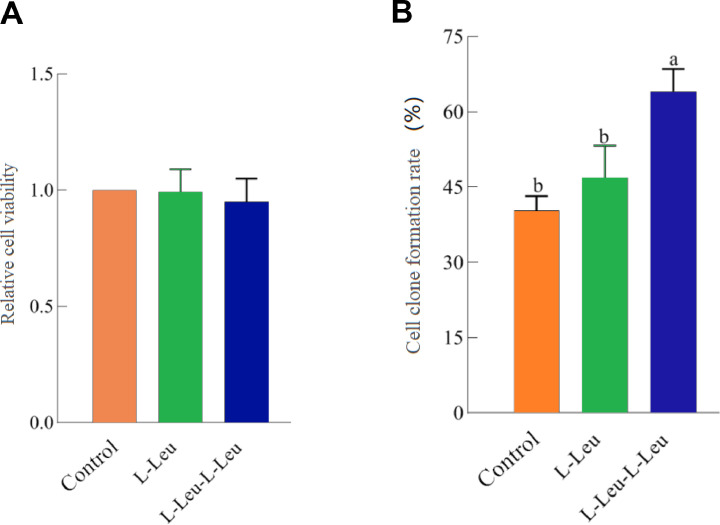
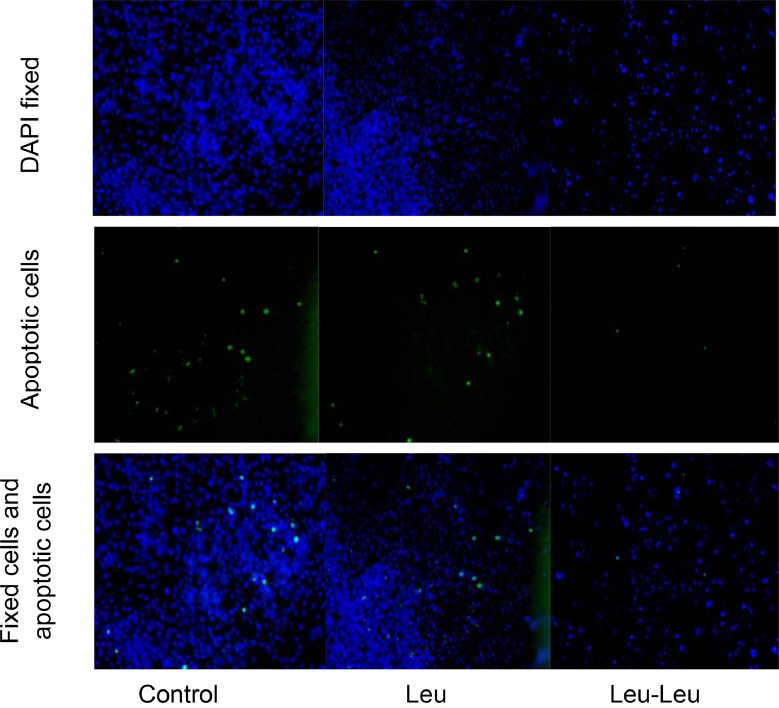
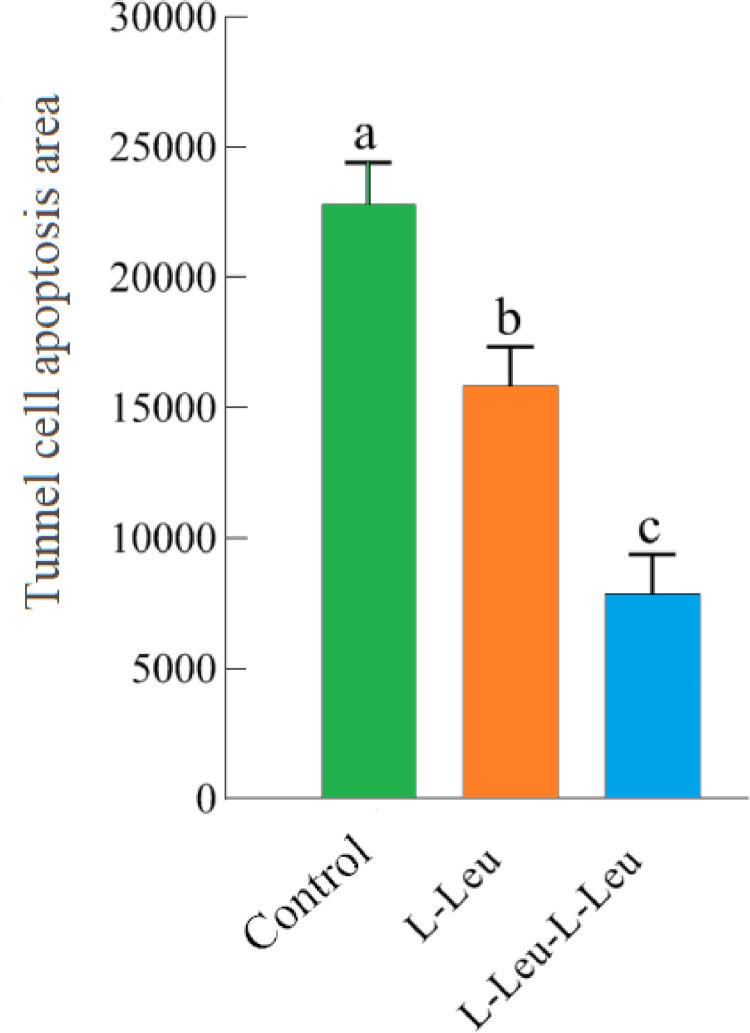
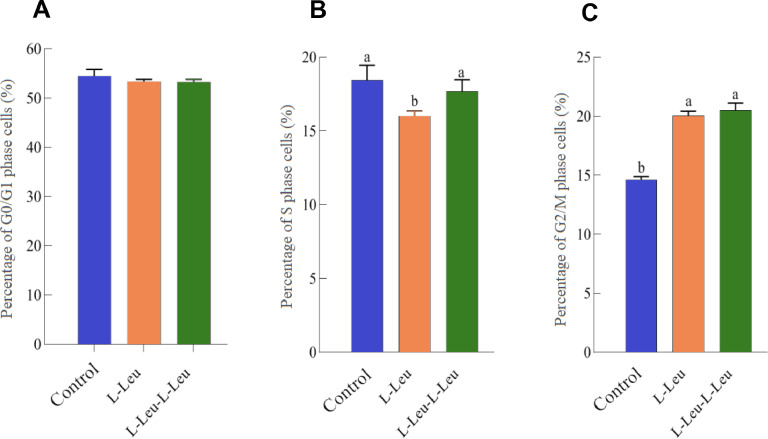
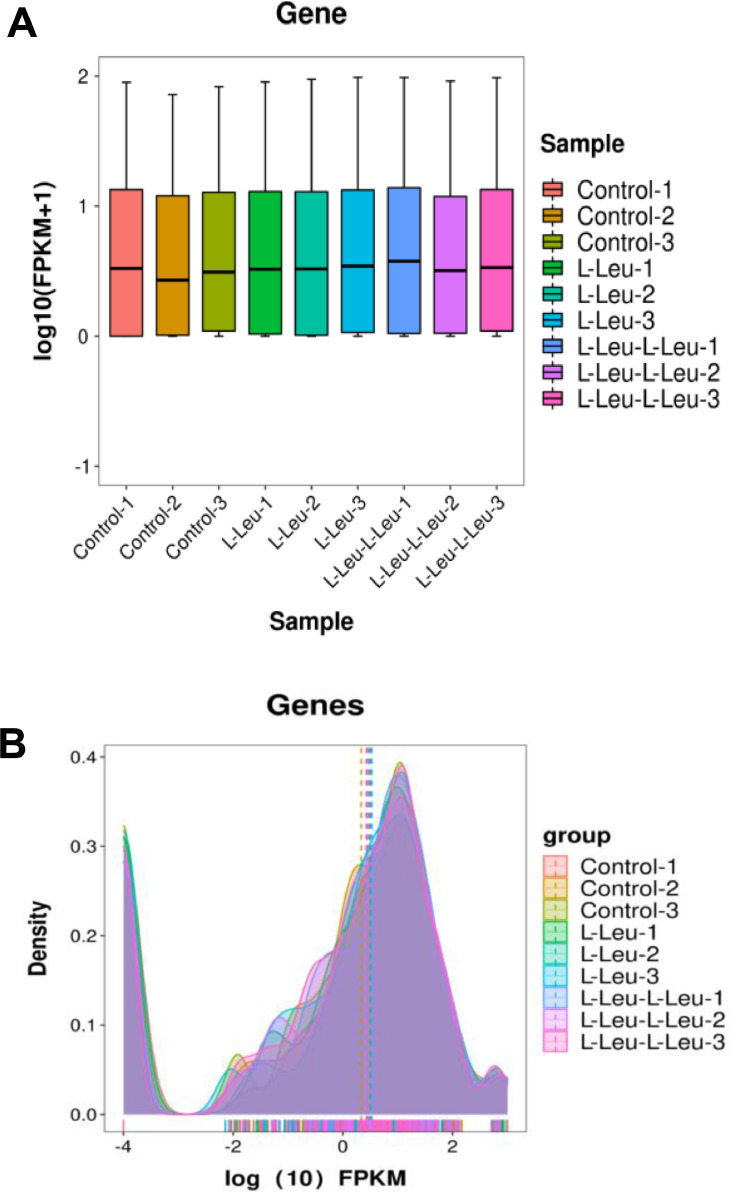
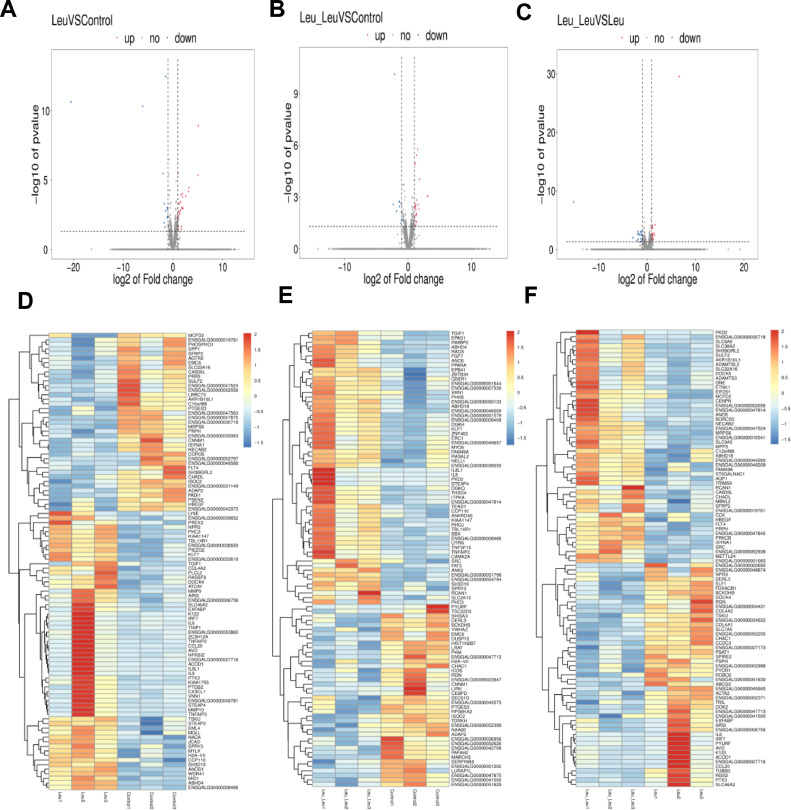
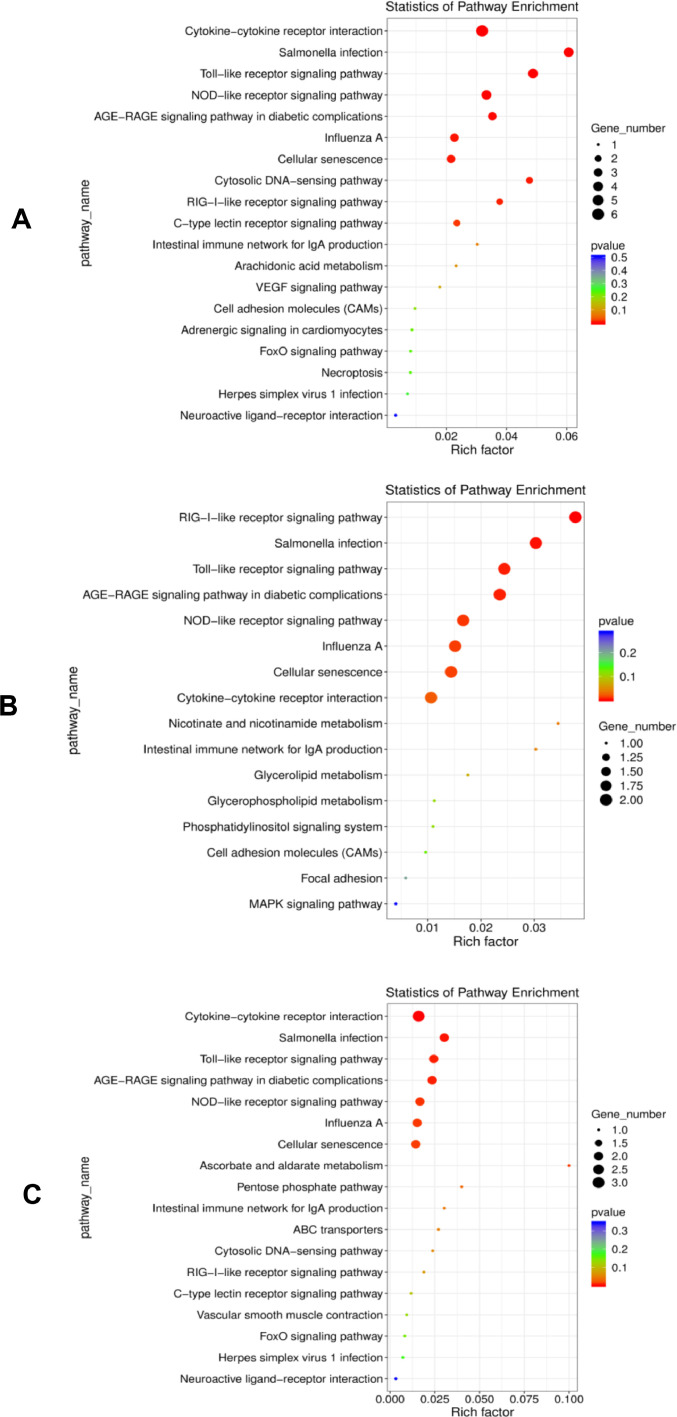
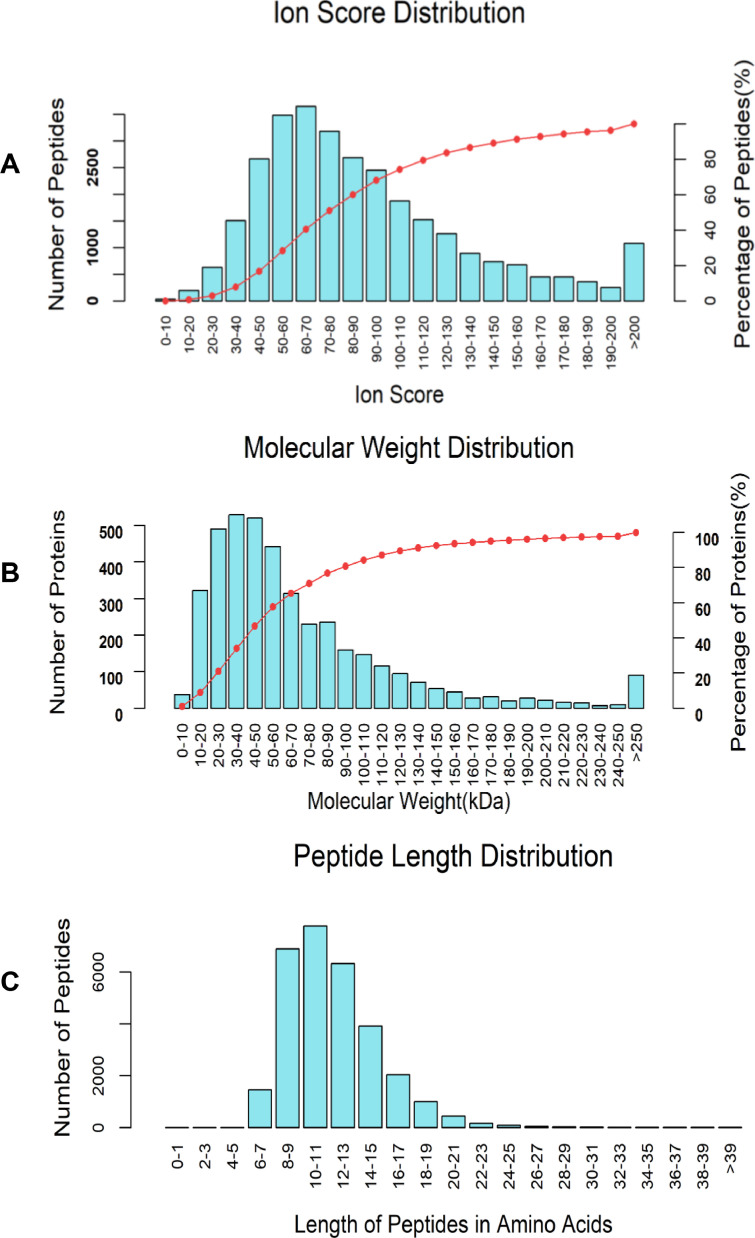
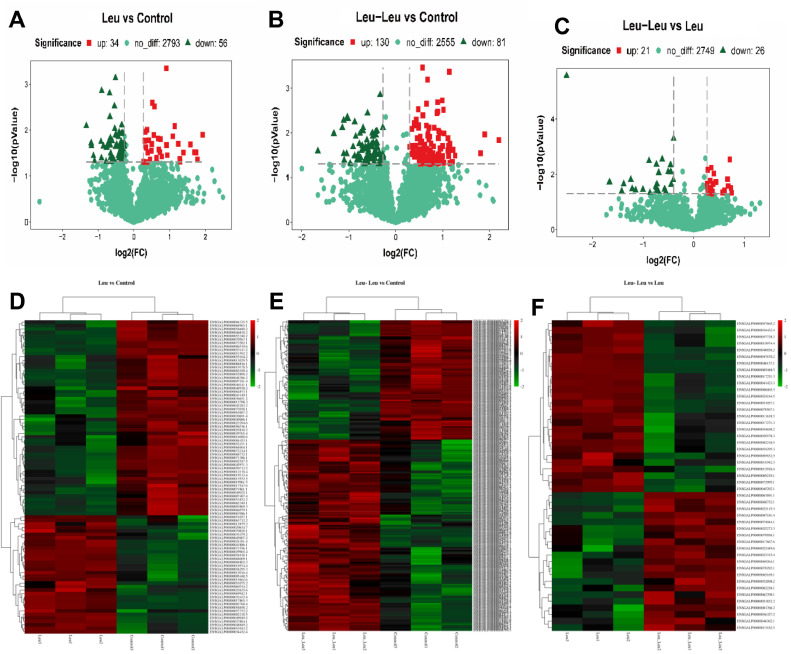
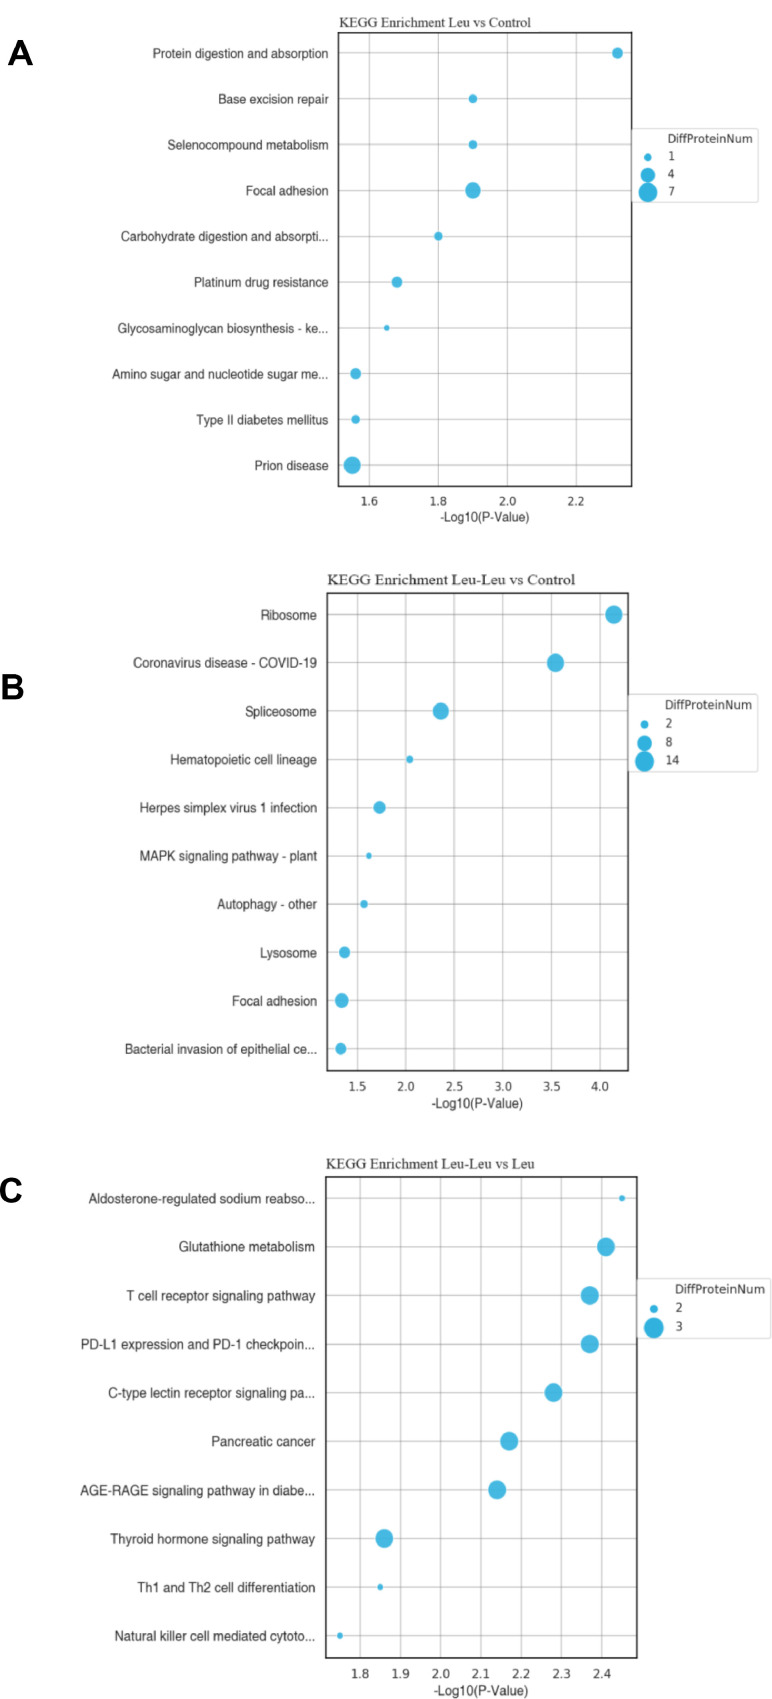
Small peptides are nutrients and bioactive molecules that have dual regulatory effects on nutrition and physiology. They are of great significance for maintaining the intestinal health and production performance of broilers. We here cultured the primary small intestinal epithelial cells (IEC) of chicken in a medium containing L-Leu (Leu) and L-Leu-L-Leu (Leu-Leu) for 24 h. The untreated cells were considered as the control group. The growth, proliferation, and apoptosis of IEC were examined. By combining RNA-seq and label-free sequencing technology, candidate genes, proteins, and pathways related to the growth, proliferation, and apoptosis of IEC were screened. Immunofluorescence detection revealed that the purity of the isolated primary IEC was >90%. The Leu-Leu group significantly promoted IEC growth and proliferation and significantly inhibited IEC apoptosis, and the effect was better than those of the Leu and control groups. Using transcriptome sequencing, four candidate genes, CCL20, IL8L1, IL8, and IL6, were screened in the Leu group, and one candidate gene, IL8, was screened in the Leu-Leu group. Two candidate genes, IL6 and RGN, were screened in the Leu-Leu group compared with the Leu group. Nonquantitative proteomic marker sequencing results revealed that through the screening of candidate proteins and pathways, found one growth-related candidate protein PGM3 and three proliferation-related candidate proteins RPS17, RPS11, and RPL23, and two apoptosis-related candidate proteins GPX4 and PDPK1 were found in the Leu-Leu group compared with Leu group. In short, Leu-Leu could promote IEC growth and proliferation and inhibit IEC apoptosis. On combining transcriptome and proteome sequencing technologies, multiple immune- and energy-related regulatory signal pathways were found to be related to IEC growth, proliferation, and apoptosis. Three candidate genes of IL8, IL6, and RGN were identified, and six candidate proteins of PGM3, RPS17, RPS11, RPL23, GPX4, and PDPK1 were involved in IEC growth, proliferation, and apoptosis. The results provide valuable data for preliminarily elucidating small peptide-mediated IEC regulation pathways, improving the small peptide nutrition theoretical system, and establishing small peptide nutrition regulation technology.

Keywords: apoptosis; candidate gene; candidate protein; cell proliferation; small peptide.


Figures

Figure 1
Figure 1
Immunofluorescence identified of broiler primary intestinal epithelial cells. The cells were fixed with DAPI dye solution, and then stained with specific green dye. Green fluorescence staining indicates apoptotic cells, while blue fluorescence staining indicates fixed cells.
Figure 2
Figure 2
Cell growth curve. Comparison histogram of cell growth curve between different treatment groups. After subculture, the cells grew through four stages: incubation period, logarithmic growth period, flat top period and decline period.
Figure 3
Figure 3
Cell mitotic index. In a given time range, the ratio of the number of dividing cells to the total number of cells is used to judge the speed of cell proliferation. The higher the cell division index, the faster the cell proliferation.
Figure 4
Figure 4
Relative viability and Clone formation rate of cell. (A): Relative viability of cell, (B): Clone formation rate of cell. Cell viability represents the number of viable cells in total cells, and clonogenic rate reflects cell population dependence and proliferation ability, which is used to determine the proliferation ability of cells in vitro.
Figure 5
Figure 5
The fluorescence staining of apoptotic cells. Green fluorescence staining indicates apoptotic cells, while blue fluorescence staining indicates fixed cells. The overlapping part of green fluorescence and blue fluorescence represents that the marked fixed cells have already apoptosis. The more overlapping parts, the more apoptosis of fixed cells. The overlapping part of green fluorescence and blue fluorescence represents that the marked fixed cells have already apoptosis. The more overlapping parts, the more apoptosis of fixed cells.
Figure 6
Figure 6
Histogram of apoptosis. The X-axis is the three test groups, and the Y-axis is the area of apoptosis in each group.
Figure 7
Figure 7
The Cell cycle. Cells undergo a cell cycle from the end of one division to the end of the next division, which mainly includes five phases: G0-G1-S-G2-M phase. (A): Percentage of G0/G1 phase cells, (B): Percentage of S phase cells, (C): Percentage of G2/M phase cells.
Figure 8
Figure 8
(A): The box plot of gene expression FPKM, The horizontal axis is the sample name, and the vertical axis is log10 (FPKM), Each box corresponds to five values of each sample, representing the maximum, upper quartile, median, lower quartile and minimum respectively from top to bottom. (B): Gene expression density map, the horizontal axis is log10 (FPKM), the vertical axis is gene density.
Figure 9
Figure 9
The analysis of genes differential expression. (A), (B) and (C) represent the volcanic map of differential expression genes distribution of Leu vs. Control, Leu-Leu vs. Control, and Leu-Leu vs. Leu, Red dots and blue dots represent the upregulation differentially expressed genes and downregulation differentially expressed genes, respectively. (D), (E), and (F) represent the heat map of differential expression genes distribution of Leu vs. Control, Leu-Leu vs. Control, and Leu-Leu vs. Leu. Red represents a high level of genes expression; blue represents a low level of genes expression.
Figure 10
Figure 10
Scatter diagram of KEGG pathway enrichment of differentially expressed genes (Top 20). (A), (B) and (C) show the up-regulated and down-regulated genes significantly enriched in KEGG pathway in Leu group and control group, Leu-Leu group and control group, Leu-Leu group and Leu group, respectively. the X-axis indicates the enrichment degree, the Y-axis indicates the KEGG pathway of abdominal muscle, the size of dots represents the number of different genes in related pathways, and the color of dots represents different P values, the smaller the P value, the redder the dot color.
Figure 11
Figure 11
(A): distribution of peptide ion scores. The abscissa represents the score of peptide ions, the principal ordinate represents the number of peptides, and the secondary ordinate represents the cumulative percentage of peptides not higher than the score of corresponding ions. (B): Objective: to identify the relative molecular weight distribution map of protein. The abscissa represents the relative molecular weight of protein, the principal ordinate represents the number of proteins, and the secondary ordinate represents the cumulative percentage of proteins not higher than the corresponding relative molecular weight. (C): peptide sequence length distribution. The abscissa represents the number of amino acids in the peptide, and the ordinate represents the number of peptides.
Figure 12
Figure 12
Analysis of protein differential expression. (A), (B) and (C) represent the volcanic map of differential expression protein distribution of Leu vs. Control, Leu-Leu vs. Control and Leu-Leu vs Leu, Red dots and blue dots represent the upregulation differentially expressed protein and downregulation differentially expressed protein, respectively. (D), (E) and (F) represent the heat map of differential expression protein distribution of Leu vs. Control, Leu-Leu vs Control and Leu-Leu vs. Leu, each column in the figure represents a sample, and each row represents a protein. The color indicates the relative abundance of differential expression of this group of proteins, in which red indicates high level expression of proteins and green indicates low level expression.
Figure 13
Figure 13
Scatter diagram of KEGG pathway enrichment of differentially expressed protein (Top 20). (A), (B) and (C) show the up-regulated and down-regulated protein significantly enriched in KEGG pathway in Leu group and control group, Leu-Leu group and control group, Leu-Leu group and Leu group, respectively. the X-axis indicates the enrichment degree, the Y-axis indicates the KEGG pathway of abdominal muscle, the size of dots represents the number of different protein in related pathways, and the color of dots represents different P values, the smaller the P value, the bluer the dot color.

Similar articles

References

    1. Argiles J.M., Lopezsoriano F.J. Intestinal amino-acid-transport-an overview. Int. J. Biochem. Cell B. 1990;22:931–937. - PubMed
    1. Attia Y.A., Bovera F., Wang J., Al-Harthi M.A., Kim W.K. Multiple amino acid supplementations to low-protein diets: Effect on performance, carcass yield, meat quality and nitrogen excretion of finishing broilers under hot climate conditions. Animals. 2020;10:973. - PMC - PubMed
    1. Bandyopadhyay U., Todorova P., Pavlova N.N., Tada Y., Thompson C.B., Finley L.W., Overholtzer M. Leucine retention in lysosomes is regulated by starvation. P. Natl. Acad. Sci. USA. 2022;119 - PMC - PubMed
    1. Boohaker R.J., Lee M.W., Vishnubhotla P., Perez J.M., Khaled A.R. The use of therapeutic peptides to target and to kill cancer cells. Curr. Med. Chem. 2012;19:3794–3804. - PMC - PubMed
    1. Boza J., Martinez O., Baro L., Suarez M.D., Gil A. Influence of casein and casein hydrolysate diets on nutritional recovery of starved rats. Enter. 1995;19:216–221. - PubMed