. 2024 Mar 7;31(3):359-377.e10.
doi: 10.1016/j.stem.2024.02.004.

A mitochondrial NADPH-cholesterol axis regulates extracellular vesicle biogenesis to support hematopoietic stem cell fate

Affiliations

A mitochondrial NADPH-cholesterol axis regulates extracellular vesicle biogenesis to support hematopoietic stem cell fate

Massimo Bonora et al. Cell Stem Cell. .

Abstract

Mitochondrial fatty acid oxidation (FAO) is essential for hematopoietic stem cell (HSC) self-renewal; however, the mechanism by which mitochondrial metabolism controls HSC fate remains unknown. Here, we show that within the hematopoietic lineage, HSCs have the largest mitochondrial NADPH pools, which are required for proper HSC cell fate and homeostasis. Bioinformatic analysis of the HSC transcriptome, biochemical assays, and genetic inactivation of FAO all indicate that FAO-generated NADPH fuels cholesterol synthesis in HSCs. Interference with FAO disturbs the segregation of mitochondrial NADPH toward corresponding daughter cells upon single HSC division. Importantly, we have found that the FAO-NADPH-cholesterol axis drives extracellular vesicle (EV) biogenesis and release in HSCs, while inhibition of EV signaling impairs HSC self-renewal. These data reveal the existence of a mitochondrial NADPH-cholesterol axis for EV biogenesis that is required for hematopoietic homeostasis and highlight the non-stochastic nature of HSC fate determination.

Keywords: HSC self-renewal; NADPH; cholesterol; exosomes; extracellular vesicles; fate determination; fatty acid oxidation; hematopoietic stem cell; metabolism; mitochondria.


Conflict of interest statement

Declaration of interests T.F. is a founder and equity holder in Generian Pharmaceuticals and Coloma Therapeutics. D.T.S. is a director and equity holder of Agios Pharmaceuticals, Magenta Therapeutics, Editas Medicines, Clear Creek Bio, and LifeVaultBio; he is a founder of Fate Therapeutics and Magenta Therapeutics and a consultant to FOG Pharma, VcanBio, and Flagship Pioneering.

Figures
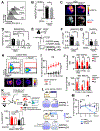
Figure 1.
Figure 1.. Mitochondrial NADPH levels mark stem cell capacity
(A) Flow cytometric histogram of the normalized NAD(P)H autofluorescence in HSCs, FKSL and Lin cells (also see Figure S1A). (B) Normalized NAD(P)H autofluorescence levels in CD34 and CD34+ HSCs. (C) Fluorescence microscopy images of NAD(P)H autofluorescence (top panel) and co-localization with the mitochondrial marker TMRM (bottom panel) obtained from CD34 and CD34+ HSCs. (D) Mitochondrial NAD(P)H determined as the difference of NAD(P)H autofluorescence after exposure to FCCP 1 μM in the HSPC populations investigated. (E) Experimental design for the enzymatic determination of mitochondrial NADPH and NADH. Sorted CD34 or CD34+ HSC were exposed in vitro to FCCP 1 μM to dissipate mitochondrial NAD(P)H. (F and G) Enzymatic determination of levels of mitochondrial NADPH (F) and NADH (G) in CD34 and CD34+ HSCs. (H) Gating strategy to define NAD(P)HHi (red box) and NAD(P)HLo (black box) CD34 HSCs. Images of NAD(P)H autofluorescence of NAD(P)HHi CD34 HSCs, NAD(P)HLo CD34 HSCs or FCCP-exposed CD34 HSCs are also shown (bottom). (I) Hematopoietic contribution of donor cells in peripheral blood of recipient mice during competitive BMT. Five NAD(P)HHi or NAD(P)HLo CD34 HSCs were isolated, then transplanted to the irradiated recipient mice with 4.0x10⁵ competitor bone marrow mononuclear cells (BMMNCs). (J) Percentages of donor-derived cells in the indicate fractions of the bone marrow of the recipient mice 6 months after BMT. (K) Schematic representation (top) and quantitation (bottom) of the % nNAD(P)HHi cells in donor-derived (filled bars) and competitor-derived (open bars) CD34 HSC, 6 months after BMT. (L) Schematic representation of the plasmid encoding for TET inducible expression of TPNOX or mitoTPNOX and their effect on cytoplasmic or mitochondrial NADPH after the induction with Doxycycline (Dox). (M) In vivo repopulation capacity of mitoTPNOX-infected HSPCs. 1000 KSL (Ly5.2) infected with mitoTPNOX (light blue), TPNOX (dark blue) or empty vector (grey) was transplanted into the irradiated recipient mice (Ly5.1) with competitor cells (4.0x10⁵ BMMNCs). % Donor-derived cells in the peripheral blood the indicated weeks after Doxycycline induction (black arrow) were shown. HSC, LinSca-1+c-Kit+CD135CD150+CD48; FKSL, CD135c-Kit+Sca-1+Lin; A.U., arbitrary unit; A.L.U., arbitrary luminescent units; MTS, mitochondrial targeting sequence; PB, peripheral blood; w, week. Bar graphs represent means ± SEM, circles represent each replicate. (B), (F), and (G): Student’s paired T test. (I), (J), and (M): 2-way ANOVA with Sidak’s multiple comparison test. (K): 1-way ANOVA with Dunnet’s multiple comparison test. ****, p < 0.0001; ***, 0.0001 ≤ p < 0.001; **, 0.001 ≤ p ≤ 0.01; *, 0.01 ≤ p < 0.05; N.S., not significant, p ≥ 0.05. See also Figure S1 and 2.
Figure 2.
Figure 2.. Mitochondrial NADPH levels mark HSC fate determination
(A) Experimental strategy for the determination of symmetric or asymmetric segregation of mitochondrial NAD(P)H after first division in the cultured CD34 HSC. Fluorescence microscopic analysis was performed to determine NAD(P)H autofluorescence intensity in the individual mitochondrion of each daughter cells. NAD(P)H intensities were subsequently compared between paired daughter cells by Mann-Whitney U test. (also see Figure S3A). (B) Proportion of distribution of mitochondrial NAD(P)H after first division of the cultured CD34 HSCs (n = 36, right). Images of NAD(P)H of the corresponding daughter cells are also shown (left). (C and D) Determination of NAD(P)H segregation by live imaging. (C) Volcano plot relating the difference in NAD(P)H intensity between each daughter and its mother. (n = 3 independent experiments). Red box: daughters with not statistically different from the mother; gray box: daughter with NAD(P)H significantly lower than the mother; green box: daughter with NAD(P)H significantly higher than the mother. (D) Timelapse traces of NAD(P)H intensity for each class of division. Cytokinesis is marked by a black arrow; the x-axis represents hours of time-lapse imaging since the start of tracking of each mother cell. (E and F) HSC capacity is enriched in NAD(P)HHi cells of Div 1 cells. 36 hours after in vitro culture of CD34 HSCs, single NAD(P)HHi or NAD(P)HLo Div 1 cells were isolated onto 96 well plate (also see Figure 2A) then followed by a long-term culture (E) or single cell transplantation with 4.0 x 10⁵ competitor BMMNCs (F). Colony replating capacity of these single cells (E, n = 48 cells) and the frequency of successful engraftment (> 1% donor contribution in multi-lineage hematopoiesis) (F, n = 20) were determined. (G and H) Percentages of hematopoietic contribution in peripheral blood of recipient mice transplanted with paired daughter cells. Single CD34 HSCs division was identified in vitro then each daughter was imaged to determine NAD(P)H levels, and individually transplanted with 2 x10⁵ competitor BMMNCs into irradiated recipient mice. Chimerism was evaluated at 4 months after BMT (10 divisions, for a total of 20 daughter cells analyzed). The division patterns of the investigated division based on donor contribution (H). BMMNCs bone marrow mononuclear cells; HSC, LinSca-1+c-Kit+CD135CD150+CD48. (E): Student’s paired T test. (F): nonparametric Kolmogorov-Smirnov test. ****, p < 0.0001; *, 0.01 ≤ p < 0.05; N.S., not significant, p ≥ 0.05. See also Figure S3.
Figure 3.
Figure 3.. Identification of NADPH-dependent pathways in HSC
(A) Flow diagram of the pathway analysis used to identify NADPH-dependent reactions differentially regulated in CD34+ compared to CD34 HSCs. (B) NADPH-dependent pathway enriched in the CD34 HSC and ranked after their Graphite score. Dot size represents the number of NADPH-related differentially expressed genes (DEG) identified. (C) Schematic representation of the cholesterol biosynthesis pathway derived from the pathway analysis. Green nodes are differentially expressed genes (all upregulated in CD34 compared to CD34+ HSC). Orange arrows highlight NADPH dependent reactions. (D) Levels of Hsd17b7, MSMO, and Tm7sf2 in sorted CD34 and CD34+ HSC quantified by qRT-PCR relative to ActB. HSC, LinSca-1+c-Kit+CD135CD150+CD48; DEG, differentially expressed genes. Bar graphs represent means ± SEM, circles represent each replicate. (D): unpaired Student’s t test. ***, 0.0001 ≤ p < 0.001; *, 0.01 ≤ p < 0.05. See also Figure S4.
Figure 4.
Figure 4.. NADPH sustains cholesterol biosynthesis in HSC
(A) Partial least squares-discriminant analysis (PLS-DA) of sterol signature (left) and relative quantitation of cholesterol (right) identified by mass spectrometry in NAD(P)HHi or NAD(P)HLo CD34 HSCs (n = 4). Ellipses display confidence level at 95%. (B) Quantitation (left) and staining (right) of the cholesterol sensitive dye filipin in NAD(P)HHi and NAD(P)HLo CD34 HSCs (n = NAD(P)HHi: 85 cells, NADPHLo: 67 cells). (C) Enzymatic detection of total intracellular cholesterol in sorted NAD(P)HHi or NAD(P)HLo CD34 HSCs. (D) Quantitation (left) and images (right) of filipin staining in the cultured KSL expressing TPNOX, mitoTPNOX or empty vector (mock) after 2 weeks of culture with Doxycycline (mock, n = 551 cells; TPNOX, n = 119 cells; mitoTPNOX, n = 140 cells). (E) Quantitation (left) and images of filipin (right) in sorted NAD(P)HHi and NAD(P)HLo CD34 HSCs then cultured for 24 hours with 37.5 nM lovastatin, an inhibitor of cholesterol synthesis, or for 2 hours after cholesterol sequestration by 1.5 mM methyl-β-cyclodextrin [NAD(P)HHi, n = 141 cells; NAD(P)HHi + Lovastatin, n = 137 cells; NAD(P)HHi + MBCD, n = 102 cells; NAD(P)HLo, n = 107 cells]. (F and G) Analysis of BMT of five NAD(P)HHi CD34 HSCs exposed to 37.5 nM lovastatin (for 24 hours in vitro), 1.5 mM MBCD (2 hours in vitro) or Vehicle (Ctrl), with 4.0 x 10⁵ competitor BMMNCs. (F) Percentages of donor-derived cells in the peripheral blood of recipient mice. (G) Percentages of donor-derived cells in HSPCs (left) or mature cells (right) from the bone marrow of recipient mice at 6 months after BMT. (H) Quantitation (left) and images (right) of filipin staining in NAD(P)HLo CD34 HSCs exposed to cholesterol-saturated MBCD. n ≥ 12 replicates, 3 independent experiments. (I) LTC-IC capacity of CD34 HSCs exposed to cholesterol-saturated MBCD (Ctrl, n = 29, MBCD:Chol, n = 64) PLS-DA, Partial least squares-discriminant analysis; Lov, Lovastatin; HSC, LinSca-1+c-Kit+CD135CD150+CD48; MBCD, methyl-β-cyclodextrin. Bar graphs represent means ± SEM, circles represent each replicate. (A): nonparametric Mann-Whitney U test. (B) and (H): unpaired Student’s T test. (C) and (I): Student’s paired T test. (D) and (E): 1-way ANOVA with Dunnet’s multiple comparison test. (F) and (G): 2-way ANOVA with Sidak’s multiple comparison test. ****, p < 0.0001; ***, 0.0001 ≤ p < 0.001; **, 0.001 ≤ p < 0.01; *, 0.01 ≤ p < 0.05; N.S., not significant, p > 0.05. See also Figure S5.
Figure 5.
Figure 5.. FAO sustains NADPH and cholesterol axis
(A) Quantitation of filipin staining in NAD(P)HHi CD34 HSCs exposed to Etomoxir for 24 hours in vitro (Vehicle, n = 30 cells; Etomoxir, n = 31 cells). (B) Proportion of NAD(P)HHi cells in CD34 HSCs from Cpt2f/f Vav-iCre and Vav-iCre+ mice. NAD(P)HHi gate was defined as in Figure 1H. (C) Quantitation (left) and images (right) of filipin staining in CD34 HSCs from Cpt2f/f Vav-iCre and Vav-iCre+ mice (Vav-iCre, n = 40 cells; Vav-iCre+, n = 56). (D and E) Quantification of filipin staining in NAD(P)HHi CD34 HSCs (D; Cpt2f/f Vav-iCre, n = 34, Cpt2f/f Vav-iCre+, n = 47, Cpt2f/f Vav-iCre+ MBCD:Chol, n = 99) and LTC-IC capacity of CD34 HSCs from the indicated genotyped mice (E, n ≥ 12 replicates, 3 independent experiments) exposed to cholesterol-saturated MBCD. (F) Proportion of symmetric high (Sym High), asymmetric (Asym), or symmetric low (Sym low) distribution of mitochondrial NAD(P)H after first division of the cultured CD34 HSCs from Cpt2f/f Vav-iCre and Cpt2f/f Vav-iCre+ mice (left). Asymmetric distribution of NAD(P)H was determined as in Figure 2G (Vav-iCre, n = 22; Vav-iCre+, n = 23). Images of TMRM and NAD(P)H of pair daughter cells are also shown (right). (G) Experimental design for serial transplantation with Cpt2f/f Vav-iCre and Vav-iCre+ CD34 HSCs. Five CD34 HSCs from Cpt2f/f Vav-iCre or Vav-iCre+ were transplanted into lethally irradiated Ly5.1 recipient mice together with 5x10⁵ competitor BMMNCs (1st BMT). After 6 months of follow up, BMMNC were isolated from each recipient mouse with positive reconstitution and transplanted into secondary recipient mice (1 x 10⁶ BMMNCs/secondary recipient mouse). The hematopoiesis of the recipient mice was followed for 16 weeks. (H, F) Percentages of donor-derived cells in peripheral blood (H) or bone marrow HSPCs (F) of recipient mice at the indicated weeks after 1st BMT (also see Figure S6C). BMT, bone marrow transplantation. Bar graphs represent means ± SEM, circles represent each replicate. (A), and (E): Student’s paired T test. (B) and (C): unpaired Student’s T test. (D): 1-way ANOVA with Dunnet’s multiple comparison test. (F), χ2 test. (H) and (I): 2-way ANOVA with Sidak’s multiple comparison test. ****, p < 0.0001; ***, 0.0001 ≤ p < 0.001; **, 0.001 ≤ p < 0.01; *, 0.01 ≤ p < 0.05; N.S., not significant, p > 0.05. See also Figure S6.
Figure 6.
Figure 6.. NADPH supports the biogenesis of extracellular vesicles (EVs) in HSC
(A) Distribution of the diameter of EVs derived from HSCs determined by Nanoparticle Tracking Analysis (NTA). (B) Experimental strategy of EV transfer between donor and acceptor HSCs. Donor CD34 HSCs (black) or compensation beads (white) were sorted into FBS-free media, and stained with the lipid marker, PKH26 (orange). EVs were isolated and supplemented to freshly isolated acceptor HSCs, then EV-related PKH26 signal (orange) was determined by fluorescence microscopy. (C) Images (left) and quantitation (right) of PKH26 staining in acceptor CD34 HSCs exposed to HSC-derived EVs (HSC-EV) or negative control (Bead) (HSC-EV, n = 14 cells; Bead, n = 11 cells). (D) Particle size distributions of EVs from CD34 HSCs, measured by TRPS system. CD34 HSCs isolated from Cpt2f/f Vav-iCre and Vav-iCre+ mice were cultured in vitro for 48 hours. A fraction of cells from Cpt2f/f Vav-iCre+ mice were exposed to cholesterol-enriched methyl-β-cyclodextrin (MBCD:Chol). EVs were isolated and analyzed by TRPS (n = 5 independent experiments), frequency distribution of the diameter (top) and average concentration (bottom) are shown. (E) The expression of EV marker CD63 at single EV level was determined by enhanced super-resolution radial fluctuation (eSRRF). Images of CD63 in CD34 HSCs-derived EVs (top) and quantitation of CD63 (bottom) in each (Cpt2f/f Vav-iCre, n = 87; Cpt2f/f Vav-iCre+, n = 332; Cpt2f/f Vav-iCre+ + MBCD:Chol, n = 138; PBS, n = 10; Beads, n = 83). See also Figure S7G–S7I. (F) Nanometric flow cytometry analysis of HSC-derived EVs immunostained for CD63 and investigated by NanoFCM NanoAnalyzer. (G) Experimental design (left) and percentages of donor-derived cells (right) in various lineages of peripheral blood of recipient mice transplanted with HSCs supplemented with HSC-derived EVs. Per each recipient mouse, 25 CD34 HSCs were sorted and cultured for 48 hours. During this period, HSCs were supplemented with HSC-derived EVs (+ HSC-EV; 1.5x10⁶ EVs per single HSC). EV-free PBS was used as a vehicle. After 48 hours of culture, the whole culture was transplanted into lethally irradiated Ly5.1 recipient mice together with 4x10⁵ competitor BMMNCs. (H) Percentages of donor-derived cells in the indicate fractions of the bone marrow of the recipient mice 28 weeks after BMT. (I) Experimental design (left) and percentages of donor-derived cells (right) in various lineages of peripheral blood of recipient mice after Rab27a interfering. After infection and selection with G418, 2000 live FKSL cells were transplanted into lethally irradiated Ly5.1 recipient mice together with 1x10⁶ competitor BMMNCs. Doxycycline was supplemented in water starting at week 2 after BMT. The x-axis represents weeks after Doxycycline administration. (J) Percentages of donor-derived cells in the indicated fractions of the bone marrow of the recipient mice 20 weeks after BMT. EV, extracellular vesicles; HSC-EV, HSC-derived extracellular vesicles; FKSL, CD135c-Kit+Sca-1+Lin. Bar graphs represent means ± S.E.M, circles represent each replicate. (C): Unpaired Student’s T test. (D) and (E): 1-way ANOVA with Dunnet’s multiple comparison test. (G), (H), (I), and (J): Two-way ANOVA with Sidak’s multiple comparison test. ****, p < 0.0001; ***, 0.0001 ≤ p < 0.001; **, 0.001 ≤ p < 0.01; *, 0.01 ≤ p < 0.05; N.S., not significant, p > 0.05. See also Figure S7.

Similar articles

Cited by

References

    1. Ito K, and Ito K (2018). Hematopoietic stem cell fate through metabolic control. Exp Hematol 64, 1–11. 10.1016/j.exphem.2018.05.005. - DOI - PMC - PubMed
    1. Lackner LL (2019). The Expanding and Unexpected Functions of Mitochondria Contact Sites. Trends Cell Biol 29, 580–590. 10.1016/j.tcb.2019.02.009. - DOI - PMC - PubMed
    1. Bonora M, Giorgi C, and Pinton P (2021). Molecular mechanisms and consequences of mitochondrial permeability transition. Nat Rev Mol Cell Biol. 10.1038/s41580-021-00433-y. - DOI - PubMed
    1. Ito K, Bonora M, and Ito K (2019). Metabolism as master of hematopoietic stem cell fate. Int J Hematol 109, 18–27. 10.1007/s12185-018-2534-z. - DOI - PMC - PubMed
    1. Chandel NS, Jasper H, Ho TT, and Passegue E (2016). Metabolic regulation of stem cell function in tissue homeostasis and organismal ageing. Nat Cell Biol 18, 823–832. 10.1038/ncb3385. - DOI - PubMed

Publication types

MeSH terms

LinkOut - more resources