. 2024 Apr 8;42(4):583-604.e11.
doi: 10.1016/j.ccell.2024.02.010. Epub 2024 Mar 7.

ARID1A orchestrates SWI/SNF-mediated sequential binding of transcription factors with ARID1A loss driving pre-memory B cell fate and lymphomagenesis

Affiliations

ARID1A orchestrates SWI/SNF-mediated sequential binding of transcription factors with ARID1A loss driving pre-memory B cell fate and lymphomagenesis

Darko Barisic et al. Cancer Cell. .

Erratum in

Abstract

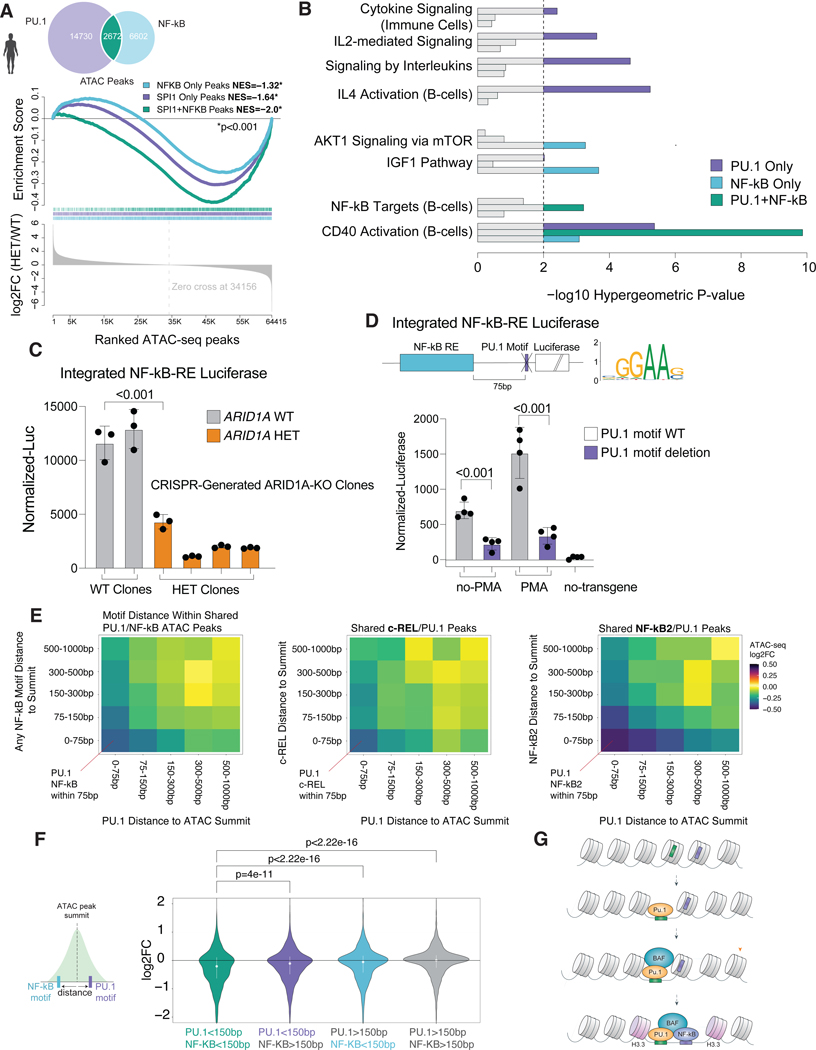
ARID1A, a subunit of the canonical BAF nucleosome remodeling complex, is commonly mutated in lymphomas. We show that ARID1A orchestrates B cell fate during the germinal center (GC) response, facilitating cooperative and sequential binding of PU.1 and NF-kB at crucial genes for cytokine and CD40 signaling. The absence of ARID1A tilts GC cell fate toward immature IgM+CD80-PD-L2- memory B cells, known for their potential to re-enter new GCs. When combined with BCL2 oncogene, ARID1A haploinsufficiency hastens the progression of aggressive follicular lymphomas (FLs) in mice. Patients with FL with ARID1A-inactivating mutations preferentially display an immature memory B cell-like state with increased transformation risk to aggressive disease. These observations offer mechanistic understanding into the emergence of both indolent and aggressive ARID1A-mutant lymphomas through the formation of immature memory-like clonal precursors. Lastly, we demonstrate that ARID1A mutation induces synthetic lethality to SMARCA2/4 inhibition, paving the way for potential precision therapy for high-risk patients.

Keywords: BAF complex; chromatin; chromatin remodeling; clonal precursor cells; epigenetics; humoral immunity; lymphoma; pioneer transcription factors; plasticity; precision therapy.


Conflict of interest statement

Declaration of interests A.M. has research funding from Janssen, Epizyme, and Daiichi Sankyo and consulted for Exo Therapeutics, Treeline Biosciences, AstraZeneca, and Epizyme. C.S. consulted for Seattle Genetics, AbbVie, and Bayer and received research funding from Bristol Myers Squibb, Epizyme, and Trillium Therapeutics Inc. D.W.S. received honoraria from AbbVie, AstraZeneca, Incyte, and Janssen and research funding from Janssen and Roche. C.E.M. is a cofounder and board member for Biotia and Onegevity Health as well as advisor or grantee for AbbVie, Arc Bio, Daiichi Sankyo, DNA Genotek, Tempus Labs, and Whole Biome. M.R.G. reports research funding from Sanofi, Kite/Gilead, AbbVie, and Allogene; consulting for AbbVie, Allogene, and Bristol Myers Squibb; honoraria from BMS, Daiichi Sankyo, and DAVA Oncology; and stock ownership of KDAc Therapeutics. C. Meydan consulted for Thorne HealthTech.

Figures

Figure 1.
Figure 1.. ARID1A facilitates chromatin accessibility for PU.1 and NF-kB during B-cell transitions in germinal centers.
A. Mutational burden of ARID1A in DLBCL patients . B. Assay schematic and quantification of splenic B cells for three independent experiments (each n>3). Horizontal lines indicate mean, t-test was used. C. Heatmap showing log2FC in Arid1a+/− or Arid1a−/− vs. Arid1a+/+ in CB/CC. ATAC-seq peaks shown are union of all samples. Peaks were ordered by log2FC, with individual peaks summarized as a histogram. |log2FC|>1.2 colored as orange or red for Arid1a+/− and Arid1a−/− respectively. D. Peak summary of (A) showing pseudo-median reads as FPKM in CB/CC. E. Box and whisker plot showing the median, first and third quartiles, and the minimum and maximum log2FC of promoter (+/−2kb TSS) and non-promoter peaks in Arid1a+/− or Arid1a−/− mice compared to Arid1a+/+ in CB/CC. Wilcoxon rank sum performed to compare promoter peaks to non-promoter peaks; all comparisons p-values<1.0e-300. F. Cell line generation schematic. G. Same as (C) for human Q474*/WT or sh-KD cells vs. WT/WT. H. Peak summary of (E) showing pseudo-median reads normalized by FPKM in Q474*/WT vs. WT/WT. I. Same as (E) for Q474*/WT vs. WT/WT. J. 3U or 5U MNase-digested nuclei DNA electrophoresis in Q474*/WT or WT/WT. K. Normalized MNase signal centered on ATAC peak summit. L. Genome browser track showing Q474*/WT and WT/WT MNase tracks alongside ATAC peaks. M. Q474*/WT vs. WT/WT nucleosome positions with significant fuzziness score (p.adj<0.05, calculated by DANPOS). Grey box indicates nucleosomes highly positioned in WT/WT that gain fuzziness in Q474*/WT. N. Ranked loci based on Q474*/WT vs. WT/WT fuzziness log2FC. O. CUT&RUN for H3K27me3 in RIVA cells. Heatmaps show +/−10kb of ATAC peak summits with significant loss upon Arid1a deletion (Wald q<0.05, |log2FC|>0). Summary plots show median reads normalized by FPKM. P. Same as (O) for H3.3 CUT&RUN. See also Figure S1
Figure 2.
Figure 2.. ARID1A facilitates chromatin accessibility for PU.1 and NF-kB during B-cell transitions in mouse germinal centers.
A. Mouse Arid1a+/+, Arid1a+/− and Arid1a−/− ATAC-seq Manhattan Distance of CB or CC cells for peaks with SD>0.5. B. Same as (A) for PCA analysis. C. Box and whisker plot showing the median, first and third quartiles, and the minimum and maximum ATAC-seq log2FC of peaks within 10kb of a gene body, categorized by differential gene expression (Wald q<0.05, |log2FC|>0) in Arid1a+/− vs. Arid1a+/+ CB (top) or CC (bottom). P-value calculated using ANOVA. D. Regulatory potential showing top TFs with increased motif accessibility in Arid1a+/+ CC vs. CB ATAC-seq, colored by multivariate adjusted p-value (p-adj). Estimated coefficient shown as bar plots +/− 95% confidence interval (CI). E. Regulatory potential showing top TFs that have decreased motif accessibility in Arid1a+/−vs. Arid1a+/+ (multivariate with cell type regressed out), colored by multivariate p-adj. Estimated coefficient shown as bar plots +/− 95% CI. F. Supervised k-means clustering of differentially accessible peaks between Arid1a+/+, Arid1a+/− and Arid1a−/− CC, normalized to WT/WT CB. G. Peaks from categories shown in (F) linked to the nearest gene within 10kb and corresponding PAGE analysis of GC exit signaling pathways. H. Fisher’s exact test for presence of the indicated TF motif enrichment in each cluster from (F). I. TOBIAS footprint binding score analysis for PU.1 (left) and NF-kB2 (right). P-values generated by TOBIAS-BINDetect function. J. GSEA Normalized Enrichment Score (NES) of PU.1 gene signatures in Arid1a+/+ vs. Arid1a+/− (left) or Arid1a−/− (right) mouse CC cells. FDR calculated through GSEA permutation test. See also Figures S1 and S2 and Table S1.
Figure 3.
Figure 3.. ARID1A facilitates chromatin accessibility for PU.1 and NF-kB during B-cell transitions in human lymphoma cells.
A. Manhattan distance in DLBCL cell line (RIVA/RI-1) of ATAC-seq peaks with a SD>0.5. B. Box and whisker plot showing the median, first and third quartiles, and the minimum and maximum ATAC-seq log2FC of peaks within 10kb to gene body grouped by differential gene expression (Wald q<0.01, |log2FC|>0.58) between WT/WT and Q474*/WT direction C. Differentially (Wald q<0.01, |log2FC|>0.58) opening or closing peaks linked to the nearest gene within 10kb and corresponding PAGE analysis of GC exit signaling pathways in (hypergeometric q<0.05 D. Regulatory potential of top TF motifs closing in Q474*/WT vs. WT/WT (top) or KD vs. WT/WT (bottom), colored by multivariate p-adj. Estimated coefficient shown as bar plots +/− 95% CI. E. Bar plot representing TOBIAS footprint binding score of PU.1 (top) or NF-kB2 (bottom) in Q474*/WT, WT/WT and KD cells. P-values generated by TOBIAS-BINDetect function. F. Overlap of ChIP-seq (PBRM1 and SMARCA4) and CUT&RUN (ARID1A and BRD9) peaks in WT/WT RIVA/RI-1 cells. G. Venn diagram showing the overlap of ARID1A WT/WT CUT&RUN peaks and significantly (Wald q<0.05) opening/closing ATAC peaks in Q474*/WT vs. WT/WT. H. Heatmaps showing log2FC for ARID1A, PRBM1 or IgG control at differentially (Wald q<0.05) closing ATAC peaks in order of decreasing ARID1A log2FC. Summary plots show mean FPKM of Q474*/WT and WT/WT binding signal. I. Same as in (H) for PU.1 ChIP-seq motif shown in the order of PU.1 log2FC. J. PAGE Analysis of genes closest to IgG or PU.1 peaks for GC exit signatures. K. Genome browser track showing PU.1, ARID1A and H3.3. L. Unsupervised clustering of peaks based on WT/WT and Q474*/WT ATAC-seq, H3K27Ac and H3K27me3 signal. Delta indicates Q474*/WT vs. WT/WT unless stated otherwise. M. Summaries of region size and peak number for each peak cluster. Dots in violin plots represent median, lines represent first and third quartiles. N. Median of RNA expression log2 fold-change for genes closest to respective peaks in each cluster. O. Log2FC difference between genotypes for the indicated BAF subunit and cluster. P. Peak cluster annotation percentage for promoter, enhancer or super-enhancer. Q. Peak cluster percentage containing motifs from SPI1/SPIB, NF-kB or both. See also Figure S2 and Table S2.
Figure 4.
Figure 4.. NF-kB mediated gene-activations requires both ARID1A and PU.1.
A. Venn diagram showing ATAC-seq peaks across all genotypes with motifs for SPI1, NF-kB, or both (top). GSEA enrichment scores for each category (middle), based on ATAC log2FC ranking of Q474*/WT vs. WT/WT (bottom). GSEA permutation test p-values<0.001. B. Enrichment of gene signatures based on hypergeometric analysis of genes within 10kb of peaks grouped by motif presence. Bar plots show -log10 Hypergeometric P-values. C. NF-kB luciferase reporter assay in Raji cells WT/WT and Q474*/WT. Bar chart of mean with error bars representing SD and replicates as dots shown. t-test was used. D. Same as (C) for NF-kB luciferase reporter assay in Raji cells with and without CRISPR targeted to the PU.1 motif in the NF-kB reporter, 48h post-CRISPR. E. Heatmap of ATAC-seq peaks binned by distance of TF motif (SPI1 and NF-kB) to peak summit, colored by log2FC of ATAC signal. Includes only peaks that contain both motifs. F. Violin plot showing median and interquartile range of log2FC of peaks in (F) divided into two bins: motif within 150bp of the ATAC summit, or motif situated more than 150bp away from the summit. Wilcoxon rank sum was performed between different bins. G. Proposed model of PU.1, cBAF and NF-kB chromatin remodeling. See also Figure S3.
Figure 5.
Figure 5.. Loss of ARID1A alters cell-fate towards a Pre-Memory state by disrupting sequential PU.1 then NF-kB function on chromatin.
A. UMAP of Multiome RNA- and ATAC-seq with cell types labels from a reference dataset based on RNA expression. B. UMAP of cells split and colored by genotype. C. UMAP projection of indicated gene expression (Klf2, Cd38). D. Cell type density along pseudotime based on RNA expression for each cell type in the lineage, anchored at CB. E. Density difference between Arid1a+/− and Arid1a+/+ along pseudotime. Wilcoxon Rank Sum p-value of Arid1a+/− vs. Arid1a+/+ pseudotime <2.2e-16. F. Expression of prememory genes (GSE89897) across pseudotime, 99% confidence interval shown in grey. G. Difference in prememory gene expression across pseudotime between Arid1a+/− and Arid1a+/+. Pseudotime values were broken into 10 deciles and Wilcoxon rank sum was performed between genotypes. Each significant decile is colored red with the minimum p<1.82e-45. H. Motif accessibility across pseudotime of the indicated TF, 95% confidence interval shown in grey. I. Motif accessibility difference across pseudotime for specified TF between genotypes (bottom). Significant deciles are red with minimum PU.1 p<3.83e−4, and minimum significant NF-KB p<1.84e−3; grey for non-significant. J. TPM log2FC RNA-seq expression of MB cell genes for each replicate of RIVA/RI-1 cells Q474*/WT and WT/WT. Genes ranked on average log2FC. CXCR4 is included to highlight similarity between mouse CB expansion phenotype with transcriptional regulation of human DLBCL cells upon ARID1A deletion. K. RT-PCR relative mRNA abundance of individual memory B cell genes normalized to GAPDH, dots represent mean of three technical replicates, bars represent the mean of a different CRISPR clone, error bars represent SD. L. TOBIAS motif footprinting score of KLF2 and BCL6 based on ATAC-seq from Q474*/WT, WT/WT and KD cells. P-values generated by TOBIAS BINDetect function. M. GSVA of Memory B cell signature in Q474*/WT or WT/WT cells. See also Figure S4.
Figure 6.
Figure 6.. ARID1A loss boosts the generation of premature memory B cells predisposed to engage in germinal centers upon antigen recall.
A. Experimental scheme and timeline for (C)–(E). B. Representative FC plots and gating strategy of total splenocytes in mixed-bone marrow chimera animals (n=3 per group). C. Relative GC B cell proportions compare to total naïve B cells as defined in (B). Horizontal lines represent median, dots represent replicates. D. Relative MB cell proportions compare to total naïve B cells as defined in (B). Horizontal lines represent median, dots represent replicates. E. Relative MB cell proportions compare to total GC B cells as defined in (B). Horizontal lines represent median, dots represent replicates. F. Experimental scheme and timeline for (G) and (H). G. Time-course FC analysis and quantification of cell type composition of antigen-specific MB cells. Bar plots showing mean, error bars represent SD, dots represent individual mice. t-test was used. H. Day 49 FC analysis and quantification of cell type composition of antigen-specific MB cells. Bar plots of mean. Error bars represent SD and dots represent replicates. t-test was used. I. FC analysis and quantification of GCB cells showing Arid1a+/− MB cells preferentially become GCB cells upon antigen recall (n=2). Non-immunized control mouse received Arid1a+/+ MB NP+ cells (generated by the initial NP-KLH immunization) but was not immunized with NP-OVA. Bar plots of mean. Error bars represent SD, dots represent replicates. t-test was used. See also Figure S5.
Figure 7.
Figure 7.. Arid1a deletion in mice decreases survival within lymphoma context and ARID1A deletion in follicular lymphoma patients is linked to transformation to aggressive disease.
A. Experimental scheme and lymphomagenesis timeline for (B)–(F). B. Representative FC plots and quantification of total B cells at the early lymphomagenesis time-point (n=4 per group). Bar plots of means. Error bars represent SD, dots represent individual mice. t-test was used. C. Representative FC plots and quantification of GC B cells at the early lymphomagenesis time-point (n=4 per group). Bar plots of means. Error bars represent SD, dots represent individual mice. t-test was used. D. Survival curves for lymphoma cohort mice. log-rank test was used. E. Spleen size quantification at time of necropsy. Bar chart displaying mean spleen to body weight ratios, error bars representing SD, dots representing individual mice. F. H&E of spleen sections from animals in (A) late time-point. Scale 100μm. Arrow indicates a mitotic figure. G. Box and whisker plot showing the median, first and third quartiles, and the minimum and maximum of human ortholog GSVA scores of the mouse RNA signature comparing Arid1a+/− vs. Arid1a+/+ for Arid1a in patients from the NCI-DLBCL cohort. P-values were calculated by Wilcoxon rank-sum test. H. UMAP dimensional reduction of CyTOF B cell data obtained from the combined analysis of 36 reactive lymph node (rLN) and 155 FL patient samples. Each dot in the plot represents a single cell, with cells colored according to their assigned cluster. The normal B cell populations in reactive lymph node (rLN) samples annotated based on the expression patterns of marker proteins as per . The contour lines on the plot represent the density of cells in the combined dataset. I. UMAP as in (I) but with cells colored by patients (only patients with ARID1A mutations shown). J. UMAP as in (I) but with cells colored by cluster (only memory-like B and D clusters are shown). K. Number of cases with (ARID1A*) or without (WT) ARID1A mutations categorized. P-value calculated through Fisher’s Exact Test. L. Kaplan-Meier curve showing risk of DLBCL transformation for patients in clusters B or D. See also Figure S5.
Figure 8.
Figure 8.. ARID1A deletion creates therapeutic vulnerability to BAF complex inhibition both in vitro and in vivo.
A. Viability measurement over time for Q474*/WT and WT/WT cells treated with 10nM SMARCA4/2 inhibitor (FHD-286) including DMSO controls (black). Two independent experiments were performed, each with n=2. Line plot show viability measurement with lines connecting biological replicates. Points represent viability measurements. 2-way ANOVA applied. B. Same as in (A) with 100nM FHD-286 treatment. C. Apoptosis analysis using AnnexinV and 7-AAD. Bar plot of mean. Error bars represent SD, dots represent individual replicates. t-test was used. D. DepMap Chronos score by tissue, ranked by ARID1A dependency. E. Same as (A) but for cell lines with lymphoid tissue annotation. F. In Vivo tumor growth inhibition means for xenograft animals (n=10 per genotype). Grey area represents 95% confidence interval. G. Survival curves for all animals in the xenograft experiment. H. Q474*/WT and WT/WT (either DMSO or FHD-286 treated) ATAC-seq PCA based on peaks with SD>0.5. I. Heatmaps showing log2FC of differentially closing ATAC-seq loci upon FHD-286 treatment (WT-FHD-286 and HET-FHD-286 vs. WT DMSO). J. Pseudo-median FPKM ATAC-seq of ATAC-seq WT DMSO, WT-FHD-286 and HET-FHD-286. K. Regulatory potential showing top TFs with decreased motif accessibility upon FHD-286 treatment compared to DMSO colored by multivariate p.adj. Estimated coefficient shown as bar plots +/− 95% CI. L. Genome browser ATAC-seq track showing Q474*/WT and WT/WT, DMSO or FHD-286 treated, we well as non-treated PU.1 CUT&RUN. IRF4 enhancer has been functionally verified previously . M. Line plot showing mean viability measurement for WT and PU.1-KD cells treated with 100nM FHD-286. n=3. Error bars represent SD. 2-way ANOVA was used to calculate significance. N. Same as in (M), except 10nM FHD-286 was used. See also Figure S6 and Table S3.

References

    1. Delmas V, Stokes DG, and Perry RP (1993). A mammalian DNA-binding protein that contains a chromodomain and an SNF2/SWI2-like helicase domain. Proceedings of the National Academy of Sciences 90, 2414–2418. 10.1073/pnas.90.6.2414. - DOI - PMC - PubMed
    1. Shen X, Mizuguchi G, Hamiche A, and Wu C. (2000). A chromatin remodelling complex involved in transcription and DNA processing. Nature 406, 541–544. 10.1038/35020123. - DOI - PubMed
    1. Tsukiyama T, Daniel C, Tamkun J, and Wu C. (1995). ISWI, a member of the SWl2/SNF2 ATPase family, encodes the 140 kDa subunit of the nucleosome remodeling factor. Cell 83, 1021–1026. 10.1016/0092-8674(95)90217-1. - DOI - PubMed
    1. Tamkun JW, Deuring R, Scott MP, Kissinger M, Pattatucci AM, Kaufman TC, and Kennison JA (1992). brahma: A regulator of Drosophila homeotic genes structurally related to the yeast transcriptional activator SNF2SWI2. Cell 68, 561–572. 10.1016/0092-8674(92)90191-E. - DOI - PubMed
    1. Whitehouse I, Flaus A, Cairns BR, White MF, Workman JL, and Owen-Hughes T. (1999). Nucleosome mobilization catalysed by the yeast SWI/SNF complex. Nature 400, 784–787. 10.1038/23506. - DOI - PubMed