. 2024 Mar 19;5(3):101448.
doi: 10.1016/j.xcrm.2024.101448. Epub 2024 Mar 8.

An immune cell map of human lung adenocarcinoma development reveals an anti-tumoral role of the Tfh-dependent tertiary lymphoid structure

Affiliations

An immune cell map of human lung adenocarcinoma development reveals an anti-tumoral role of the Tfh-dependent tertiary lymphoid structure

Wei Liu et al. Cell Rep Med. .

Abstract

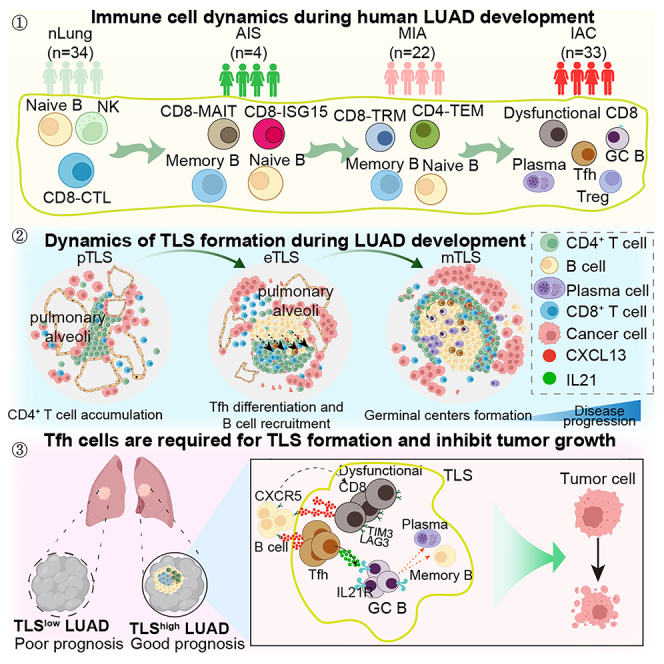
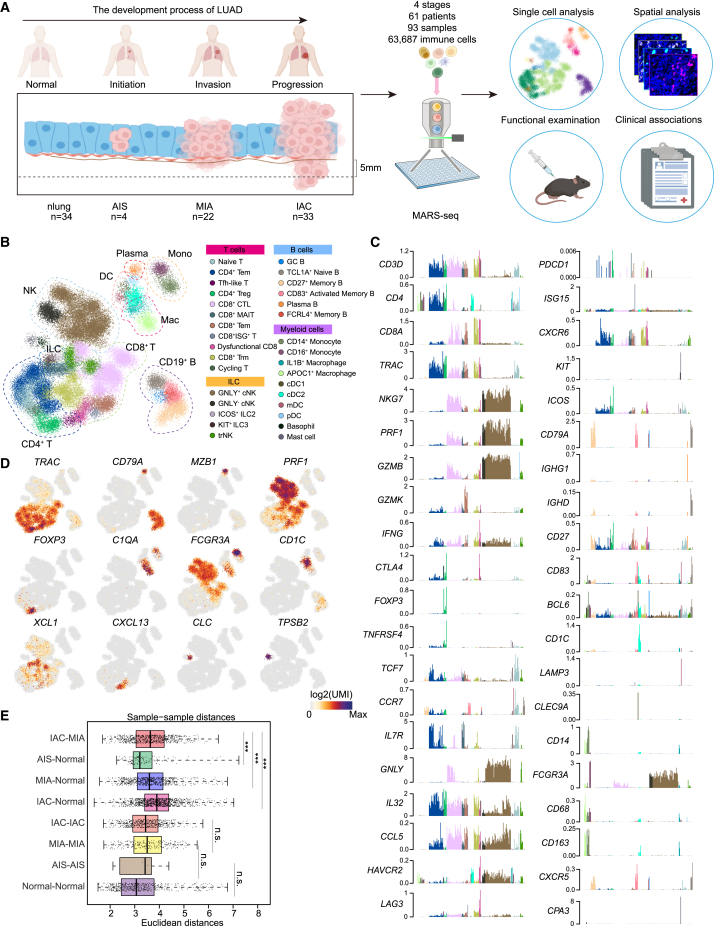
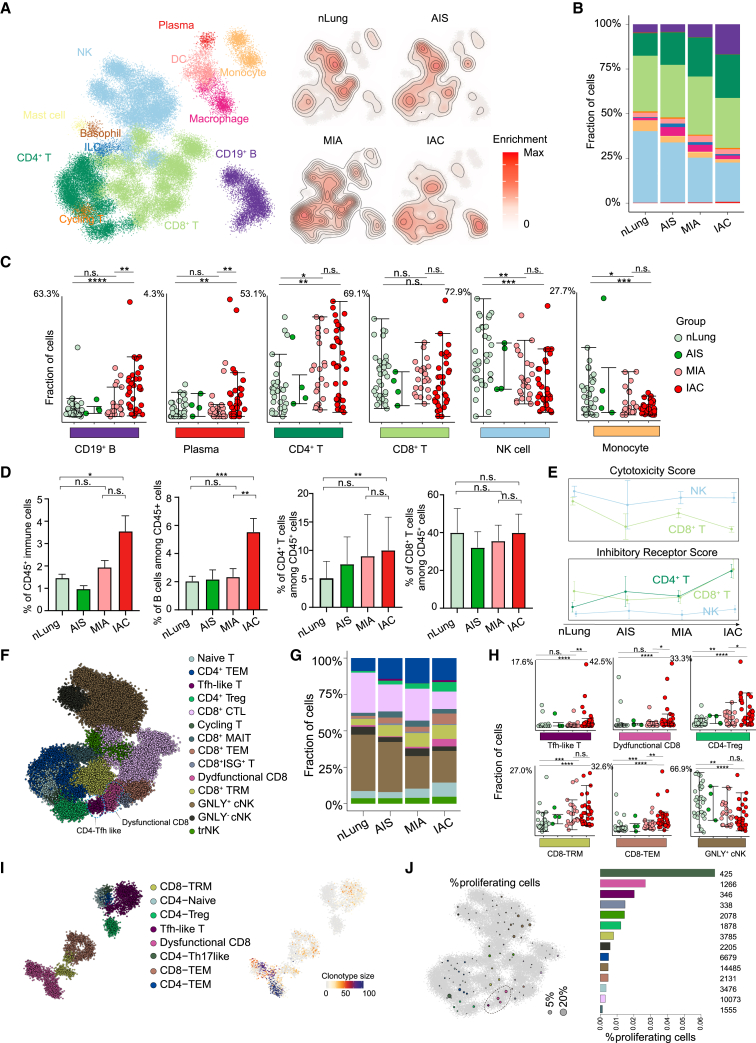
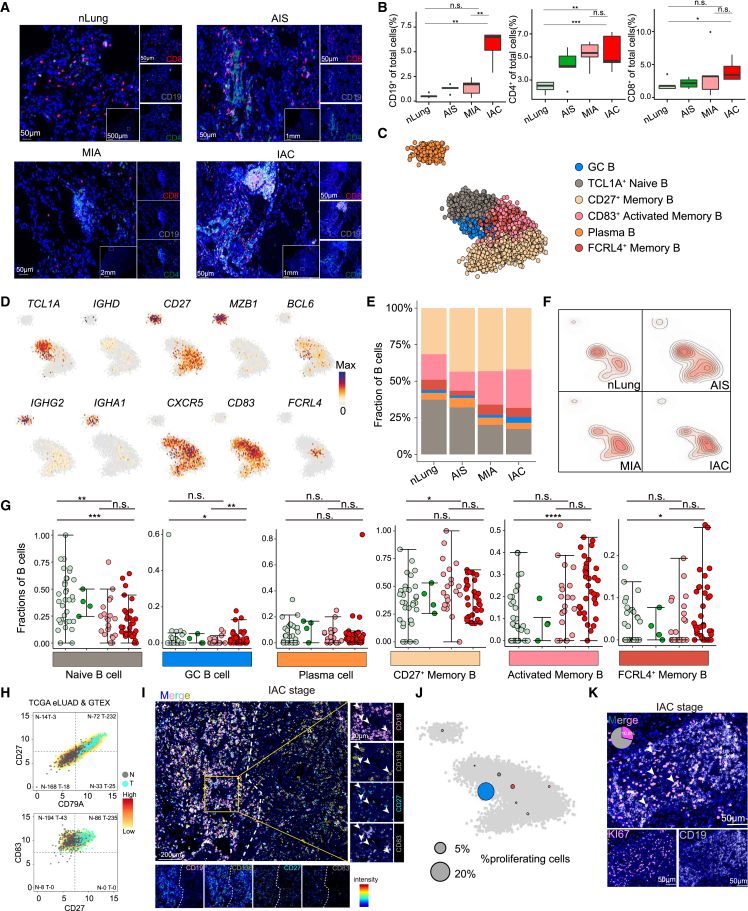
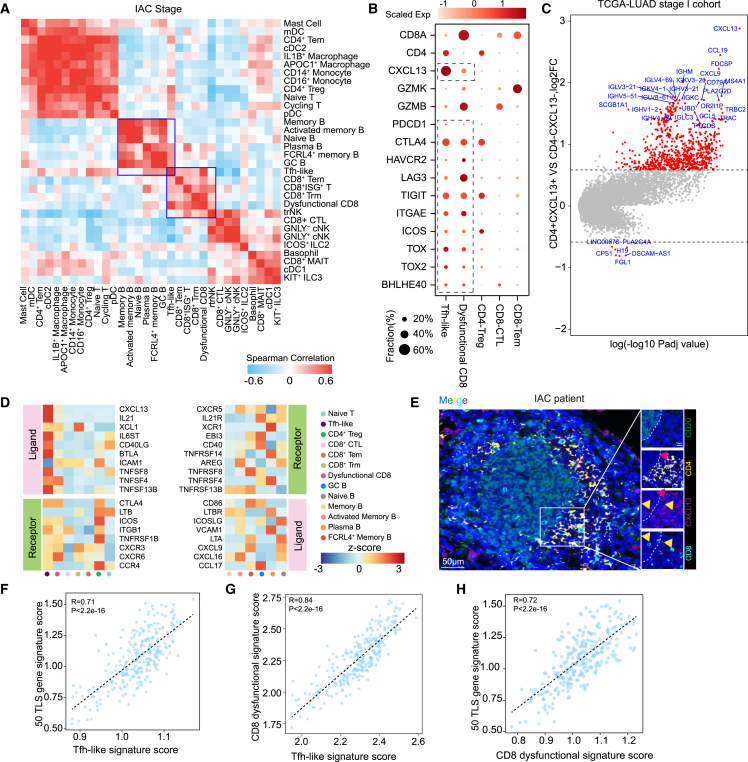
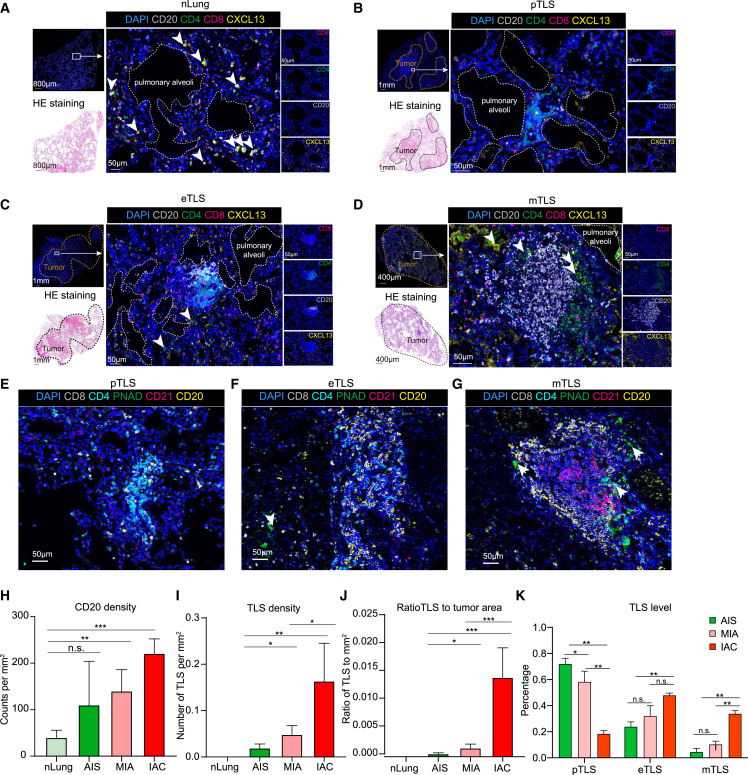
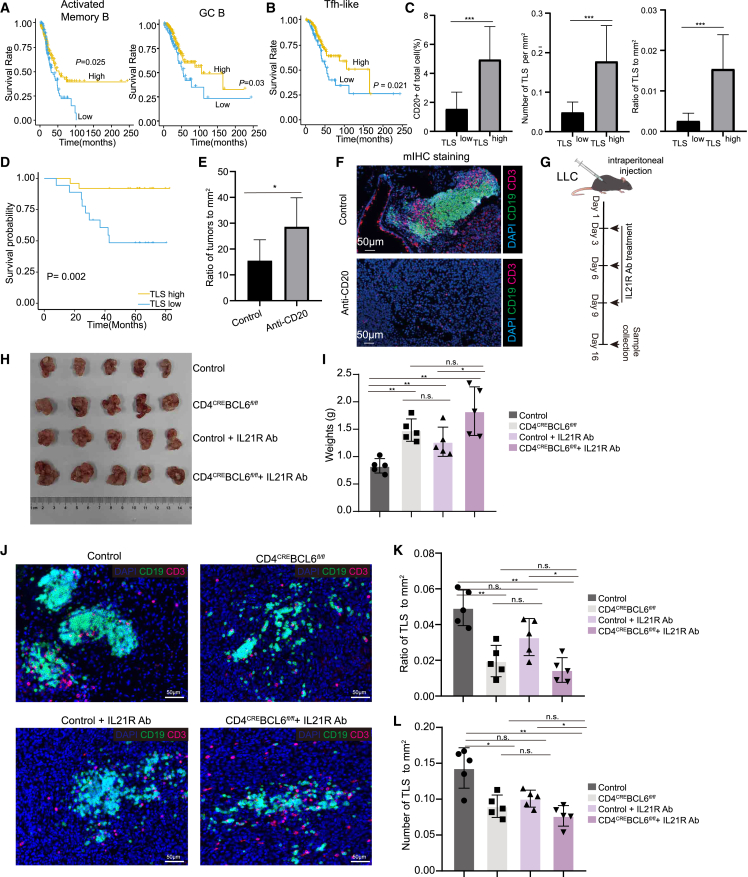
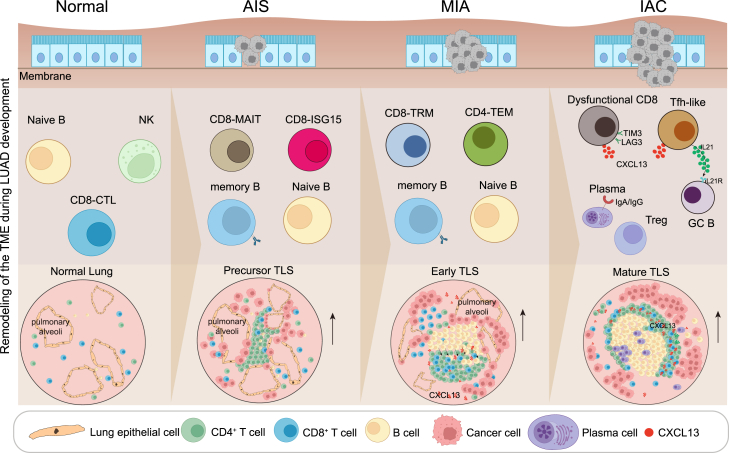
The immune responses during the initiation and invasion stages of human lung adenocarcinoma (LUAD) development are largely unknown. Here, we generated a single-cell RNA sequencing map to decipher the immune dynamics during human LUAD development. We found that T follicular helper (Tfh)-like cells, germinal center B cells, and dysfunctional CD8+ T cells increase during tumor initiation/invasion and form a tertiary lymphoid structure (TLS) inside the tumor. This TLS starts with an aggregation of CD4+ T cells and the generation of CXCL13-expressing Tfh-like cells, followed by an accumulation of B cells, and then forms a CD4+ T and B cell aggregate. TLS and its associated cells are correlated with better patient survival. Inhibiting TLS formation by Tfh or B cell depletion promotes tumor growth in mouse models. The anti-tumoral effect of the Tfh-dependent TLS is mediated through interleukin-21 (IL-21)-IL-21 receptor signaling. Our study establishes an anti-tumoral role of the Tfh-dependent TLS in the development of LUAD.


Conflict of interest statement

Declaration of interests The authors declare no competing interests.

Figures

None
Graphical abstract
Figure 1
Figure 1
Single-cell atlas of CD45+ immune cells from early-stage LUAD and normal lung tissues (A) Graphical overview of the experimental setting. Tumor samples of patients with LUAD dissociated into single cells. CD45+ cells were processed by massively parallel single-cell RNA sequencing (MARS-seq) for transcriptional profiling. nLung, normal lung; AIS, invasive adenocarcinoma in situ; MIA, microinvasive adenocarcinoma; IAC, invasive adenocarcinoma. (B) 2D projection of subclustered nLung and LUAD immune cells. A total of 63,687 immune cells were annotated and are marked by a color code. (C) Normalized expression of selected genes over the metacell model. Each bar represents one metacell, colored as in (B). (D) 2D projection of a selected set of marker genes over the metacell model. (E) Euclidean distances between sample pairs among nLung only (normal-normal), tumor only (AIS-AIS, MIA-MIA, IAC-IAC, IAC-MIA), or between nLung and tumor (MIA-normal, IAC-normal, AIS-normal). Distances between pairs of patient-matched samples were excluded. ∗∗∗p < 0.001, two-sided Mann-Whitney U test.
Figure 2
Figure 2
Composition of immune cells during LUAD progression (A) 2D density plots showing immune cell population enrichment over the metacell model in groups of patients with LUAD. (Left) Reference map of nLung and tumor immune populations as in Figure 1B. (Right) Immune cells of nLung and patients with AIS, MIA, and IAC are shown with contour lines indicating the density of projected cells (STAR Methods). (B) Bar plots showing the immune cell-type composition within the nLung and patients with AIS, MIA, and IAC in each group. Cell types are colored the same as in (A). (C) Dot plots showing percentages of partial immune cell subpopulation within nLung and patients with AIS, MIA, and IAC. ∗p < 0.05, ∗∗p < 0.01, and ∗∗∗p < 0.001, two-sided Mann-Whitney U test. Error bars indicate mean ± SEM. (D) Bar plots showing proportion of CD45+ cells in all live cells and CD19+, CD4+, and CD8+ cells in all CD45+ cells; data from fluorescence-activated cell sorting (FACS) analysis. Data are presented as mean ± SEM. ∗p < 0.05, ∗∗p < 0.01, and ∗∗∗p < 0.001, two-sided Mann-Whitney U test. Bars and error bars represent mean +/- standard error. (E) Line plots showing changes for the activity score of inhibitory receptor genes and cytotoxic genes across four stages (STAR Methods). (F) 2D projection of subclustered T and NK cells with subpopulations marked by a color code. (G) Bar plots showing the T and NK cell-type composition within the nLung and patients with AIS, MIA, and IAC in each group. Cell types are colored the same as in (F). (H) Dot plots showing percentages of partial T and NK cell subpopulation within nLung and patients with AIS, MIA, and IAC. ∗p < 0.05, ∗∗p < 0.01, and ∗∗∗p < 0.001, two-sided Mann-Whitney U test. Error bars indicate mean ± SEM. (I) Projection of T cell subclusters and TCR clonotype size from 5′ 10× Genomics data. (J) Fraction of proliferating cells per metacell calculated by defining a cell as proliferative by its fraction of cell-cycle gene expression out of total expression (STAR Methods). Circle size reflects the percentages of proliferating cells in the metacell using the 2D projection as in (F).
Figure 3
Figure 3
Characteristics and dynamics of B cells in each group of early-stage LUAD (A) Tumor sections from patients with LUAD stained with anti-CD4 monoclonal antibody (mAb; green), anti-CD8 mAb (red), anti-CD19 mAb (white), and DAPI (4′,6-diamidino-2-phenylindole; blue). Scale bars, 50 μm, 500 μm, 1 mm, and 2 mm. nLung (n = 11), AIS (n = 6), MIA (n = 10), and IAC (n = 10). (B) Boxplot showing quantification of CD19+/CD4+/CD8+ cells in total cells, respectively; data from multiplex immunostaining analysis. Data are presented as mean ± SEM. ∗p < 0.05, ∗∗p < 0.01, and ∗∗∗p < 0.001, two-sided Mann-Whitney U test. (C) 2D projection of subclustered of B cells from all nLung and LUAD samples, showing the formation of six main clusters. A total of 6,475 cells were annotated and are marked by color code. (D) 2D projection of a selected set of B cell marker genes over the metacell model. (E) Bar plots showing the B cell-type composition within the nLung and patients with AIS, MIA, and IAC in each group. Cell types are colored the same as in (C). (F) B cells of nLung and patients with AIS, MIA, and IAC are shown with contour lines indicating the density of projected cells. (G) Dot plots showing percentages of B cell subpopulation within nLung and patients with AIS, MIA, and IAC. ∗p < 0.05, ∗∗p < 0.01, and ∗∗∗p < 0.001, two-sided Mann-Whitney U test. Error bars indicate mean ± SEM. (H) Density plots showing the proportions of tumor samples and nLung tissues that express high levels of CD79A and CD27 and CD27 and CD83, respectively, in TCGA stage I LUAD and Genotype-Tissue Expression (GTEx) nLung data. Expression level was measured by log2 (count + 1). (I) Tumor sections from patients with LUAD stained with anti-CD83 mAb (white), anti-CD138 mAb (yellow), anti-CD27(green), anti-CD19 mAb (red), and DAPI (blue). Scale bars, 20 and 200 μm. (J) Fraction of proliferating B cells per metacell. Circle size reflects the percentages of proliferating cells in the metacell using the 2D projection as in (C). (K) Tumor sections from patients with LUAD stained with anti-KI67 mAb (red), anti-CD19 mAb (white), and DAPI (blue). Scale bars, 50 μm.
Figure 4
Figure 4
Tfh-like, dysfunctional CD8+ T, and GC B cells form a TLS (A) Correlation of lineage-normalized cell-type frequencies in 33 IAC tumors. (B) Expression of selected genes in IAC-infiltrating T cell clusters. (C) Volcano plots showing differentially expressed genes (DEGs) of TCGA patients with LUAD in stage I grouped by the expression levels of CD4 and CXCL13 (STAR Methods). (D) Heatmap showing the expression of ligand-receptor pairs highly expressed in B and T cells. (E) Tumor sections from patients with IAC stained with anti-CXCL13 mAb (red), anti-CD20 mAb (green), anti-CD4 mAb (yellow), anti-CD8 mAb (cyan), and DAPI (blue). Scale bars, 50 and 10 μm. (F) Scatterplots showing gene expression of the 50 TLS gene signature scores (y axis) with the difference of Tfh-like signature scores (x axis). (G) Scatterplots showing gene expression of dysfunctional CD8+ T signature scores (y axis) with the difference of Tfh-like signature scores (x axis). (H) Scatterplots showing gene expression of the 50 TLS gene signature scores (y axis) with the difference of dysfunctional CD8+ T signature scores (x axis).
Figure 5
Figure 5
The formation of TLS during the progression of early-stage LUAD (A–D) Multiplex immunostaining analysis of TLSs for the following markers: CD20, CD4, CD8, CXCL13, and DAPI. Scale bars, 1 mm, 800 μm, 400 μm, and 50 μm. (E–G) Multiplex immunostaining analysis of TLSs for the following markers: CD20, CD4, CD8, CD21, PNAd, and DAPI. The yellow, green, and red arrows refer to B cells, high endothelial venules, and follicular DCs. Scale bars, 50 μm. (H–J) Quantification of CD20+ B cells, density of TLSs, and ratio of tumor area occupied by TLSs in nLung and patients with AIS, MIA, and IAC. nLung (n = 6), AIS (n = 6), MIA (n = 7), and IAC (n = 9). ∗p < 0.05, ∗∗p < 0.01, and ∗∗∗p < 0.001, two-sided Mann-Whitney U test. Bars and error bars represent mean +/- standard error. (K) Quantification of different stages of TLSs in patients with AIS, MIA, and IAC. AIS (n = 6), MIA (n = 7), and IAC (n = 9). ∗p < 0.05, ∗∗p < 0.01, and ∗∗∗p < 0.001, two-sided Mann-Whitney U test.
Figure 6
Figure 6
The Tfh-dependent TLS predicts tumor prognosis of patients with early-stage LUAD and inhibits tumor growth (A) Kaplan-Meier curves showing the overall survival values of activated memory B (left) and GC B (right) cell scores in TCGA database (STAR Methods). (B) Kaplan-Meier curves showing the overall survival values of Tfh-like cell signature scores in TCGA database. (C) Quantification of CD20+ cells, density of TLSs, and ratio of tumor area occupied by TLSs in TLShigh and TLSlow patients. TLShigh, n = 27; TLSlow, n = 15. Bars and error bars represent mean +/- standard error. (D) Kaplan–Meier estimates of overall survival shown by in TLShigh and TLSlow patients. TLShigh, n = 27; TLSlow, n = 15. (E) Ratio of tumors to mm2 of the lung tissues obtained from anti-CD20-Ab-treated KPC mice. Control (n = 6) and anti-CD20-treated KPC mice (n = 6). (F) Multiplex immunostaining assay of TLSs for the following markers: CD3, CD19, and DAPI in anti-C20-treated KPC mice. Scale bars, 50 μm. Control (n = 6) and anti-CD20-treated KPC mice (n = 6). (G) Schematic illustration showing IL-21R Ab neutralization of control and tumor-bearing CD4CRE; Bcl6fl/fl mice. (H and I) LLC cells were intraperitoneally injected into 8-week-old controls, CD4CRE; Bcl6fl/fl mice, control+IL-21R Ab and CD4CRE; Bcl6fl/fl+IL-21R Ab mice. The image and weight of tumors were obtained at 16 days post-tumor inoculation. Control (n = 5), CD4CRE; Bcl6fl/fl (n = 5), control+IL-21R Ab (n = 5), and CD4CRE; Bcl6fl/fl+ IL-21R Ab mice (n = 5). ∗p < 0.05, ∗∗p < 0.01, and ∗∗∗p < 0.001, two-sided Mann-Whitney U test. Error bars indicate mean ± SEM. (J) Multiplex immunostaining assay of TLS for the following markers: CD3, CD19, and DAPI in controls, CD4CRE; Bcl6fl/fl mice, control+IL-21R Ab, and CD4CRE; Bcl6fl/fl+IL-21R Ab mice. Scale bars, 50 μm. (K and L) Density of TLSs and ratio of tumor area occupied by controls, CD4CRE; Bcl6fl/fl mice, control+IL-21R Ab, and CD4CRE; Bcl6fl/fl+IL-21R Ab mice. ∗p < 0.05, ∗∗p < 0.01, and ∗∗∗p < 0.001, two-sided Mann-Whitney U test. Error bars indicate mean ± SEM.
Figure 7
Figure 7
Summary of immune cell features and dynamics during LUAD initiation and invasion Schematic illustration showing characteristics and dynamics of key immune cell subsets in different stages. New insights involved in TLS formation during the progression of early-stage LUAD were provided.

References

    1. Hanahan D., Weinberg R.A. Hallmarks of Cancer: The Next Generation. Cell. 2011;144:646–674. doi: 10.1016/j.cell.2011.02.013. - DOI - PubMed
    1. Schreiber R.D., Old L.J., Smyth M.J. Cancer Immunoediting: Integrating Immunity's Roles in Cancer Suppression and Promotion. Science. 2011;331:1565–1570. doi: 10.1126/science.1203486. - DOI - PubMed
    1. Altorki N.K., Markowitz G.J., Gao D., Port J.L., Saxena A., Stiles B., McGraw T., Mittal V. The lung microenvironment: an important regulator of tumour growth and metastasis. Nat. Rev. Cancer. 2019;19:9–31. doi: 10.1038/s41568-018-0081-9. - DOI - PMC - PubMed
    1. Tian Y., Li Q., Yang Z., Zhang S., Xu J., Wang Z., Bai H., Duan J., Zheng B., Li W., et al. Single-cell transcriptomic profiling reveals the tumor heterogeneity of small-cell lung cancer. Signal Transduct. Target. Ther. 2022;7:346. doi: 10.1038/s41392-022-01150-4. - DOI - PMC - PubMed
    1. Pelka K., Hofree M., Chen J.H., Sarkizova S., Pirl J.D., Jorgji V., Bejnood A., Dionne D., Ge W.H., Xu K.H., et al. Spatially organized multicellular immune hubs in human colorectal cancer. Cell. 2021;184:4734–4752.e20. doi: 10.1016/j.cell.2021.08.003. - DOI - PMC - PubMed