. 2024 Apr 4;84(7):1224-1242.e13.
doi: 10.1016/j.molcel.2024.02.010. Epub 2024 Mar 7.

CDK-independent role of D-type cyclins in regulating DNA mismatch repair

Affiliations

CDK-independent role of D-type cyclins in regulating DNA mismatch repair

Gergely Rona et al. Mol Cell. .

Abstract

Although mismatch repair (MMR) is essential for correcting DNA replication errors, it can also recognize other lesions, such as oxidized bases. In G0 and G1, MMR is kept in check through unknown mechanisms as it is error-prone during these cell cycle phases. We show that in mammalian cells, D-type cyclins are recruited to sites of oxidative DNA damage in a PCNA- and p21-dependent manner. D-type cyclins inhibit the proteasomal degradation of p21, which competes with MMR proteins for binding to PCNA, thereby inhibiting MMR. The ability of D-type cyclins to limit MMR is CDK4- and CDK6-independent and is conserved in G0 and G1. At the G1/S transition, the timely, cullin-RING ubiquitin ligase (CRL)-dependent degradation of D-type cyclins and p21 enables MMR activity to efficiently repair DNA replication errors. Persistent expression of D-type cyclins during S-phase inhibits the binding of MMR proteins to PCNA, increases the mutational burden, and promotes microsatellite instability.

Keywords: AMBRA1; CDK4; D-type cyclins; DNA repair; DNA repair pathway choice; G0 DNA repair; G1 DNA repair; PCNA; base excision repair; cell cycle; cullin-RING ubiquitin ligases; cyclin D1; genome stability; mismatch repair; oxidative DNA damage.


Conflict of interest statement

Declaration of interests P.S. has been a consultant at Novartis, Genovis, Guidepoint, The Planning Shop, ORIC Pharmaceuticals, Cedilla Therapeutics, Syros Pharmaceuticals, Blueprint Medicines, Curie Bio, Differentiated Therapeutics, Excientia, Blueprint, Ligature Therapeutics, Merck, Redesign Science, Sibylla Biotech, and Exo Therapeutics; his laboratory receives research funding from Novartis. M.P. is or has been an advisor for and has financial interests in SEED Therapeutics, Triana Biomedicines and CullGen, Kymera Therapeutics, and Umbra Therapeutics.

Figures

Figure 1.
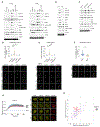
Figure 1.. D-type cyclins are recruited to DNA lesions in a p21 dependent manner.
A) U-2OS cells stably expressing EGFP-tagged cyclins, EGFP, and mPlum-PCNA were subjected to laser induced damage. DNA damage recruitment dynamics were captured by live cell imaging for 4 minutes. For each condition, ≥25 cells were evaluated from 3 independent experiments. Mean relative fluorescence values and standard errors were plotted against time. Representative images are shown in Figure S1A. B) U-2OS cells stably expressing mAzGreen-cyclin D1 or NLS-mAzGreen-cyclin D1 (in green) together with mPlum-PCNA (in red) were transfected with siRNAs targeting p21, p27, p57 or a non-targeting control (NT). Cells were treated and analyzed as in (A). Representative images are shown below the graphs. C) Parental or p21−/− U-2OS cells stably expressing mAzGreen-cyclin D1, D2, or D3 and mPlum-PCNA were analyzed as in (A). D) Left panel: HEK-293T cells were co-transfected with the indicated FFSS-cyclin D1 constructs together with p21-HA or EV (empty vector). Cyclin D1(MV) denotes mutations M56A/V60A. Cyclin D1(HP) denotes mutations M56A/V60A/W63A. Cell lysates were immunoprecipitated with an anti-FLAG resin and immunoblotted. Whole cell extract (WCE) is from the EV sample. Middle and right panels: U-2OS cells stably expressing the indicated mAzGreen-cyclin D1 constructs and mPlum-PCNA were analyzed as in (A). E) Confocal images of U-2OS cells after laser micro-irradiation stained for γH2A.X, EdU, D-type cyclins, and DAPI. Nuclei are highlighted by a dashed line. F) Left panel: G1-synchronized RPE1 cells harboring tagged endogenous proteins (mRuby-PCNA, mVenus-cyclin D1, and p21-mTurquoise2) were treated and analyzed as in (B). MidDle panel: representative images. Right panel shows depletion efficiency. Scale bars represent 10 μm. See also Figures S1, S2, and S3.
Figure 2.
Figure 2.. D-type cyclins are recruited to oxidative DNA lesions in the proximity of BER proteins.
A) G1-synchronized U-2OS and RPE1 cells were treated with the indicated DNA damaging agents, fractionated into soluble and chromatin fractions, and immunoblotted. Chromatin fractions are shown here and soluble fractions in Figure S4A. B) G1-synchronized parental and p21−/− U-2OS cells were treated with H2O2 for 20 minutes and analyzed as in (A). Chromatin fractions are shown here and soluble fractions in Figure S4B. C) Parental or CDK4/6 double knock-out NCI-H1048 cells were treated with H2O2 for 20 minutes and analyzed as in (A). Chromatin fractions are shown here and soluble fractions in Figure S4F. D) 2-6-3 U-2OS cells were transfected with the indicated constructs and immunostained for γH2A.X (green) and endogenous cyclin D1 (grey). White arrowheads indicate the position of the LacO (red) in the nucleus that is outlined by a dashed line. Quantification of the cyclin D1 relative mean fluorescence intensity (RMFI) derived from 3 independent experiments as in . Dashed lines represent the median on the plots. E) 2-6-3 U-2OS cells were co-transfected with mAzGreen-cyclin D1 (grey) and the indicated constructs, and subsequently immunostained for γH2A.X (green). Samples were processed and quantified as in (D). F) 2-6-3 U-2OS cells were transfected with the indicated constructs and siRNAs targeting p21 or a non-targeting control (NT), and then processed and quantified as in (D). G) RPE1 cells harboring tagged endogenous proteins (mRuby-PCNA, mVenus-cyclin D1, and p21-mTurquoise2) were micro-irradiated as in . DNA damage recruitment dynamics were captured by live-cell imaging. Non-S-phase cells were identified and analyzed as in Figure 1A. H) Scatter plot of fold-changes in PSM (peptide spectral match) counts of H2O2-treated vs. non-treated U-2OS cells expressing TurboID or TurboID-fused cyclin D1. Raw values are reported in Supplementary Table S1. Known DNA repair proteins are highlighted in purple, except BER proteins that are in red. Among DNA repair pathways, only the BER pathway was significantly enriched (p=0.005711, Fisher’s exact test). Scale bars represent 10 μm. See also Figures S4, and S5.
Figure 3.
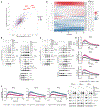
Figure 3.. D-type cyclins inhibit the binding of MMR proteins to PCNA.
A) Scatter plot of fold-changes in PSM counts of H2O2-treated vs. non-treated RPE1 cells expressing TurboID-PCNA. Cells were transfected with either non-targeting (siNT) or siRNA targeting cyclins D1/D3, and subsequently synchronized in G1. Raw values are reported in Supplementary Table S2. B) RPE1 cells were transfected with siNT or siRNA to cyclins D1/D3 or KIPs, and subsequently synchronized in G1. Cells were treated with H2O2 before fractionation into soluble and chromatin fractions (right panels). PCNA was immunoprecipitated from the chromatin fraction and co-purified proteins were immunoblotted (left panel). Asterix denotes a non-specific band. C) G1-synchronized parental or AMBRA1−/− RPE1 cells were treated with H2O2 before fractionation into soluble and chromatin fractions, which were analyzed as in (B). D) U-2OS cells stably expressing mCherry- or mNeonGreen-tagged BER pathway proteins or AcGFP-tagged MMR pathway proteins were transfected with siNT or siRNA targeting D-type cyclins, and subsequently synchronized in G1. Each row in the heatmap shows recruitment of a BER or MMR protein at micro-irradiation sites that is either higher (red) or lower (blue) in D-type cyclin depleted cells when compared to control cells. Columns represent standardized recruitment values that were averaged over 15 second intervals. Column label units refer to seconds post-irradiation. The “p” column indicates if the mean intensity of the normalized difference between control and D-type cyclin-depleted cells was significant over a window of 60 seconds across the entire 10 minutes (+=p<0.01). Raw curves are reported in Supplementary Figure S7. E) U-2OS cells stably expressing AcGFP-tagged MSH2, MSH3, or MSH6 were transfected with siNT or siRNAs to D-type cyclins, KIPs, and subsequently synchronized in G1. Mean relative fluorescence values and standard errors were plotted against time. Statistical analysis was performed as in (D). F) U-2OS cells expressing AcGFP-tagged MSH2, MSH3, or MSH6 were stably infected with inducible FFSS-cyclin D1(WT), FFSS-cyclin D1(HP), or an EV, transfected with siNT or siRNAs targeting D-type cyclins, and synchronized in G1. Endogenous cyclin D1 was targeted by a 3’UTR siRNA and exogenous cyclin D1 was induced by doxycycline. DNA damage recruitment dynamics were analyzed as in (E). The efficiency of protein depletion and overexpression is shown in the right panel. See also Figures S6, and S7.
Figure 4.
Figure 4.. D-type cyclins promote the proper repair of oxidative DNA lesions during G1.
A) Two CCND1−/−; CCND2−/− (D1/D2−/−) U-2OS clones (clones #KO1 and #KO2) and parental U-2OS cells were transfected with the indicated siRNAs, and synchronized in G1. Cells were then treated with H2O2 for 15 minutes or left untreated (UT). Half of the treated cells were allowed to recover in media without H2O2 for 4 hours (Recov.), after which all samples were subjected to comet assay. Comet tail moment values were normalized to the siNT “H2O2” samples. Lines represent mean values on the plots from 4 independent experiments. The efficiency of protein depletion is shown in the right panel. B) U-2OS cells were transfected with the indicated siRNAs and synchronized in G1. Cells were then treated and analyzed as in (A). Where indicated, cells were pretreated for 2 hours with palbociclib (CDK4/6i) and kept in palbociclib during the 4 hours recovery. Lines represent mean values on the plots from 3 independent experiments. The efficiency of protein depletion and CDK4/6 inhibition is shown in the right panel. C) Cells listed in (A) were treated with the indicated concentrations of H2O2 or NCS. Graphs show normalized cell viability measured after 96 hours. Silencing efficiencies are shown in the right panel. D and E) RPE1 cells were transfected with the indicated siRNAs and synchronized in G1. Where indicated, cells were treated with H2O2 for 30 minutes and then allowed to recover for 1.5 hours in DMEM supplemented with EdU. The EdU signal was normalized to the untreated siNT samples. Measurements were carried out from 3 independent experiments. Dashed lines represent the median on the plots. Silencing efficiencies are shown in the right panel. F) RPE1 cells treated as in (D). The measurements of the number of RPA2 foci/nucleus were carried out from 3 independent experiments. Dashed lines represent the mean value on the plots. Silencing efficiencies are shown in the right panel. G) RPE1 cells were transfected with the indicated siRNAs and synchronized in G0. Cells were then nucleoporated with the indicated FM-HCR reporter plasmids and released into serum containing media. Eight hours later, cells, now in G1, were subjected to FACS analysis. DNA repair activity for each siRNA was normalized to siNT while also correcting for transfection efficiency and was represented as normalized repair activity. Graphs show average and standard deviation from at least 3 independent experiments. Schematics of the fluorescent reporters are shown next to the graphs. Silencing efficiencies are shown in the right panel. H) Parental and AMBRA1−/− RPE1 cells (clones #KO1 and #KO2) were treated and analyzed as in (G). See also Figures S8, S9, S10, and S11.
Figure 5.
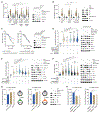
Figure 5.. D-type cyclins stabilize p21, which competes with MMR proteins to bind PCNA.
A) Parental and AMBRA1−/− cells (clones #KO1 and #KO2) were treated with cycloheximide (CHX) and MG132 as indicated, and lysates were immunoblotted. The graph at the bottom shows the quantification of p21 levels from three independent experiments. Error bars indicate standard deviation. B) AMBRA1−/− RPE1 cells were transfected with the indicated siRNAs and analyzed as in (A). C) RPE1 cells were transfected with the indicated siRNAs, synchronized in G1, and analyzed as in (A). D) RPE1 cells were transfected with the indicated siRNAs, synchronized in G0, and analyzed as in (A). E) Parental and CDK4/6 knock-out NCI-H1048 cells (sgRNA #1 and sgRNA#2) were treated and analyzed as in (A). F) HEK-293T cells were transfected with either EV or HA-p21, together with increasing amounts of a FFSS-cyclin D1, FFSS-cyclin D2, or FFSS-cyclin D3 vector. p21 was immunoprecipitated from the lysates using HA-beads and immunoblotted together with co-purified proteins. G) HCT-116 cells were transfected with EV, FLAG-SKP2 or FLAG-CDT2, in the absence or presence of SS-cyclin D1, SS-cyclin D2, or SS-cyclin D3. SKP2 and CDT2 were immunoprecipitated from the lysates using FLAG-beads and immunoblotted with co-purified proteins. H) Stably transduced RPE1 cells harboring a doxycycline-inducible HA-p21, HA-p21(ΔPCNA), or EV were synchronized into G0. Transgenes were induced by doxycycline for 12 hours before serum re-addition. G1 cells were treated with H2O2 before fractionation into soluble and chromatin fractions (right panels). PCNA was immunoprecipitated from the chromatin fraction and immunoblotted with co-purified proteins (left panel). See also Figures S12, S13, and S14.
Figure 6.
Figure 6.. Degradation of D-type cyclins in S-phase is necessary for proper MMR function.
A) Laser-induced DNA damage recruitment dynamics in S-phase parental or AMBRA1−/− U-2OS cells stably expressing mAzGreen-cyclin D1 (green) and mPlum-PCNA (red) were analyzed as in Figure 1A. B) U-2OS cells stably expressing mAzGreen-cyclin D1 (green) and mPlum-PCNA (red) were infected with viruses expressing inducible p21, p21(ΔPCNA), p21(RxL) or EV constructs. DNA damage recruitment dynamics were captured as in (A). Efficiency of p21 induction is shown in the bottom immunoblot. C) S-phase-enriched parental or AMBRA1−/− RPE1 cells were fractionated into soluble and chromatin fractions (right panels). PCNA was immunoprecipitated from the chromatin fraction and immunoblotted with co-purified proteins (left panel). Asterix denoted a non-specific band. D) S-phase-enriched parental or AMBRA1−/− RPE1 cells were nucleoporated with the indicated FM-HCR reporter plasmids. Eight hours later, cells were subjected to FACS analysis. DNA repair activity for each sample was normalized to AMBRA1+/+ cells while also correcting for transfection efficiency and is represented as normalized repair activity. Graphs show average and standard deviation from at least 3 independent experiments. E) DNA damage recruitment dynamics were captured by live-cell imaging in S-phase-enriched parental or AMBRA1−/− U-2OS cells stably expressing AcGFP-tagged MSH2, MSH3, or MSH6, and analyzed as in Figure 3E. F) S-phase-enriched parental or AMBRA1−/− RPE1 cells were treated and analyzed as in (C), except that, where indicated, they were treated with H2O2 before fractionation. Scale bars represent 10 μm. See also Figure S15.
Figure 7.
Figure 7.. Degradation of D-type cyclins in S-phase is necessary to limit mutation burden and microsatellite instability.
A) Schematic representation of the CherryOFF reporter assay. B) Quantification of the mutational frequencies in U-2OS and MCF10Am cells measured with the mCherryOFF reporter. mCherry signal was evaluated 18 days after infecting the cells with lentiviruses expressing the stable cyclin D1(T286A) mutant, wild-type cyclin D1, or EV. Graphs show average and standard error from at least 3 independent experiments. Cyclin D1 and p21 levels are shown in the panels next to the graphs. C) Quantification of the mutational frequencies in HCT-116 (MMR deficient) and HCT-116+ch3 (MMR proficient) cells, measured as in (B). D) Schematic representation of the (CA)18-NanoLuc reporter assay. E and F) Graphs show relative NanoLuc signal in the indicated cells normalized to cell viability from 3 independent experiments. NanoLuc signal was evaluated 96 hours after transfecting cells with the indicated siRNAs. Error bars show standard deviation. Silencing efficiencies are shown in the panels next to the graphs. G) Graphs show NanoLuc signal in U-2OS and MCF10Am cells normalized to cell viability. NanoLuc signal was evaluated 144 hours after infecting the cells with lentiviruses expressing either the stable cyclin D1(T286A) mutant, wild-type cyclin D1, or EV. Graphs show average and standard deviation from at least 3 independent experiments. Cyclin D1 and p21 levels are shown in the panels next to the graphs. H) Graphs show NanoLuc signal in HCT-116 (MMR deficient) and HCT-116+ch3 (MMR proficient) evaluated as in (G). See also Figure S15.

Update of

References

    1. Lukas J, Pagano M, Staskova Z, Draetta G, and Bartek J (1994). Cyclin D1 protein oscillates and is essential for cell cycle progression in human tumour cell lines. Oncogene 9, 707–718. - PubMed
    1. Chen JY, Lin JR, Tsai FC, and Meyer T (2013). Dosage of Dyrk1a shifts cells within a p21-cyclin D1 signaling map to control the decision to enter the cell cycle. Mol Cell 52, 87–100. 10.1016/j.molcel.2013.09.009. - DOI - PMC - PubMed
    1. Pagano M, Theodoras AM, Tam SW, and Draetta GF (1994). Cyclin D1-mediated inhibition of repair and replicative DNA synthesis in human fibroblasts. Genes Dev 8, 1627–1639. 10.1101/gad.8.14.1627. - DOI - PubMed
    1. Stallaert W, Kedziora KM, Taylor CD, Zikry TM, Ranek JS, Sobon HK, Taylor SR, Young CL, Cook JG, and Purvis JE (2022). The structure of the human cell cycle. Cell Syst 13, 230–240 e233. 10.1016/j.cels.2021.10.007. - DOI - PMC - PubMed
    1. Zerjatke T, Gak IA, Kirova D, Fuhrmann M, Daniel K, Gonciarz M, Muller D, Glauche I, and Mansfeld J (2017). Quantitative Cell Cycle Analysis Based on an Endogenous All-in-One Reporter for Cell Tracking and Classification. Cell Rep 19, 1953–1966. 10.1016/j.celrep.2017.05.022. - DOI - PMC - PubMed

MeSH terms

Substances