. 2024 Sep;144(9):2029-2038.
doi: 10.1016/j.jid.2024.02.014. Epub 2024 Mar 6.

CASZ1 Is Essential for Skin Epidermal Terminal Differentiation

Affiliations

CASZ1 Is Essential for Skin Epidermal Terminal Differentiation

Stephenie H Droll et al. J Invest Dermatol. 2024 Sep.

Abstract

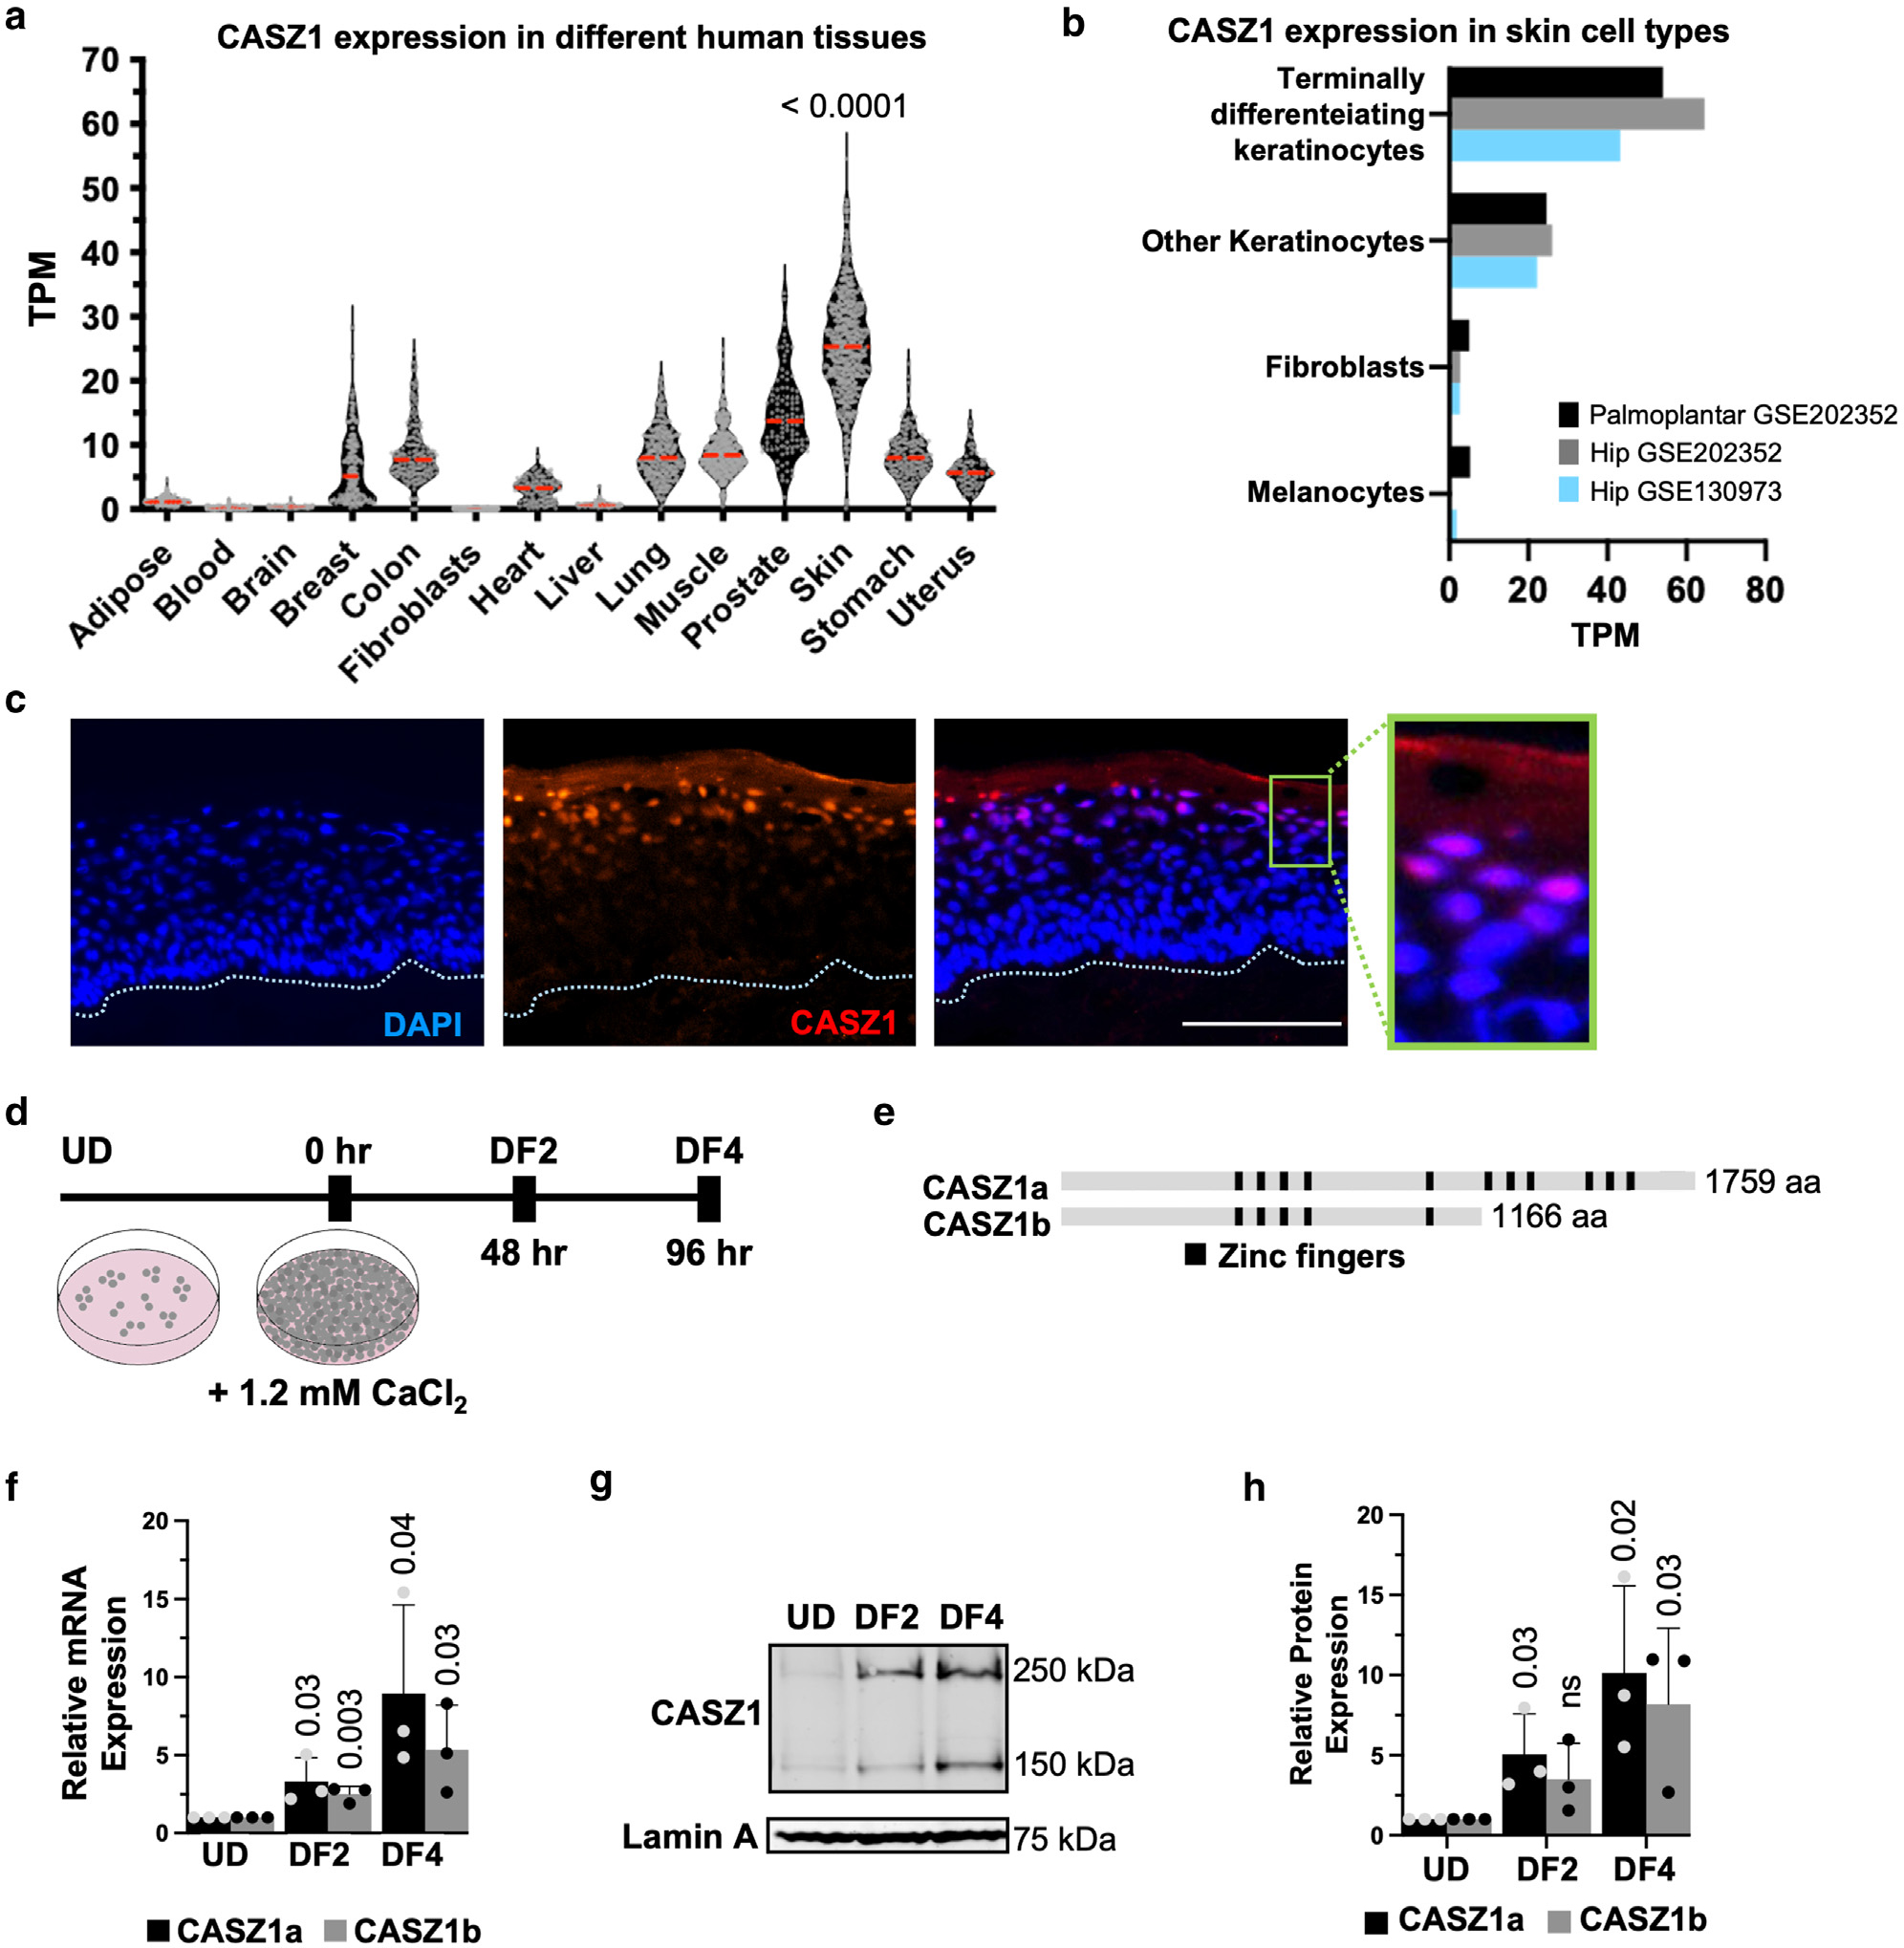
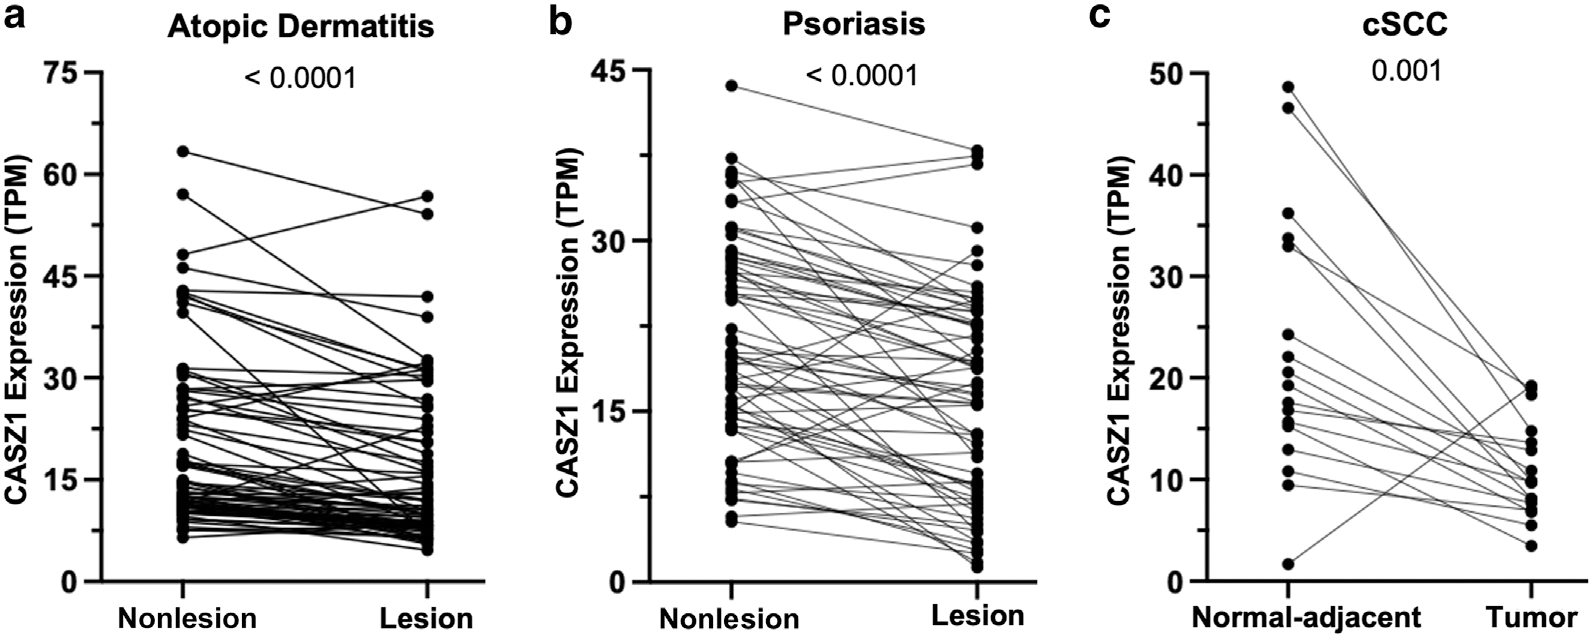
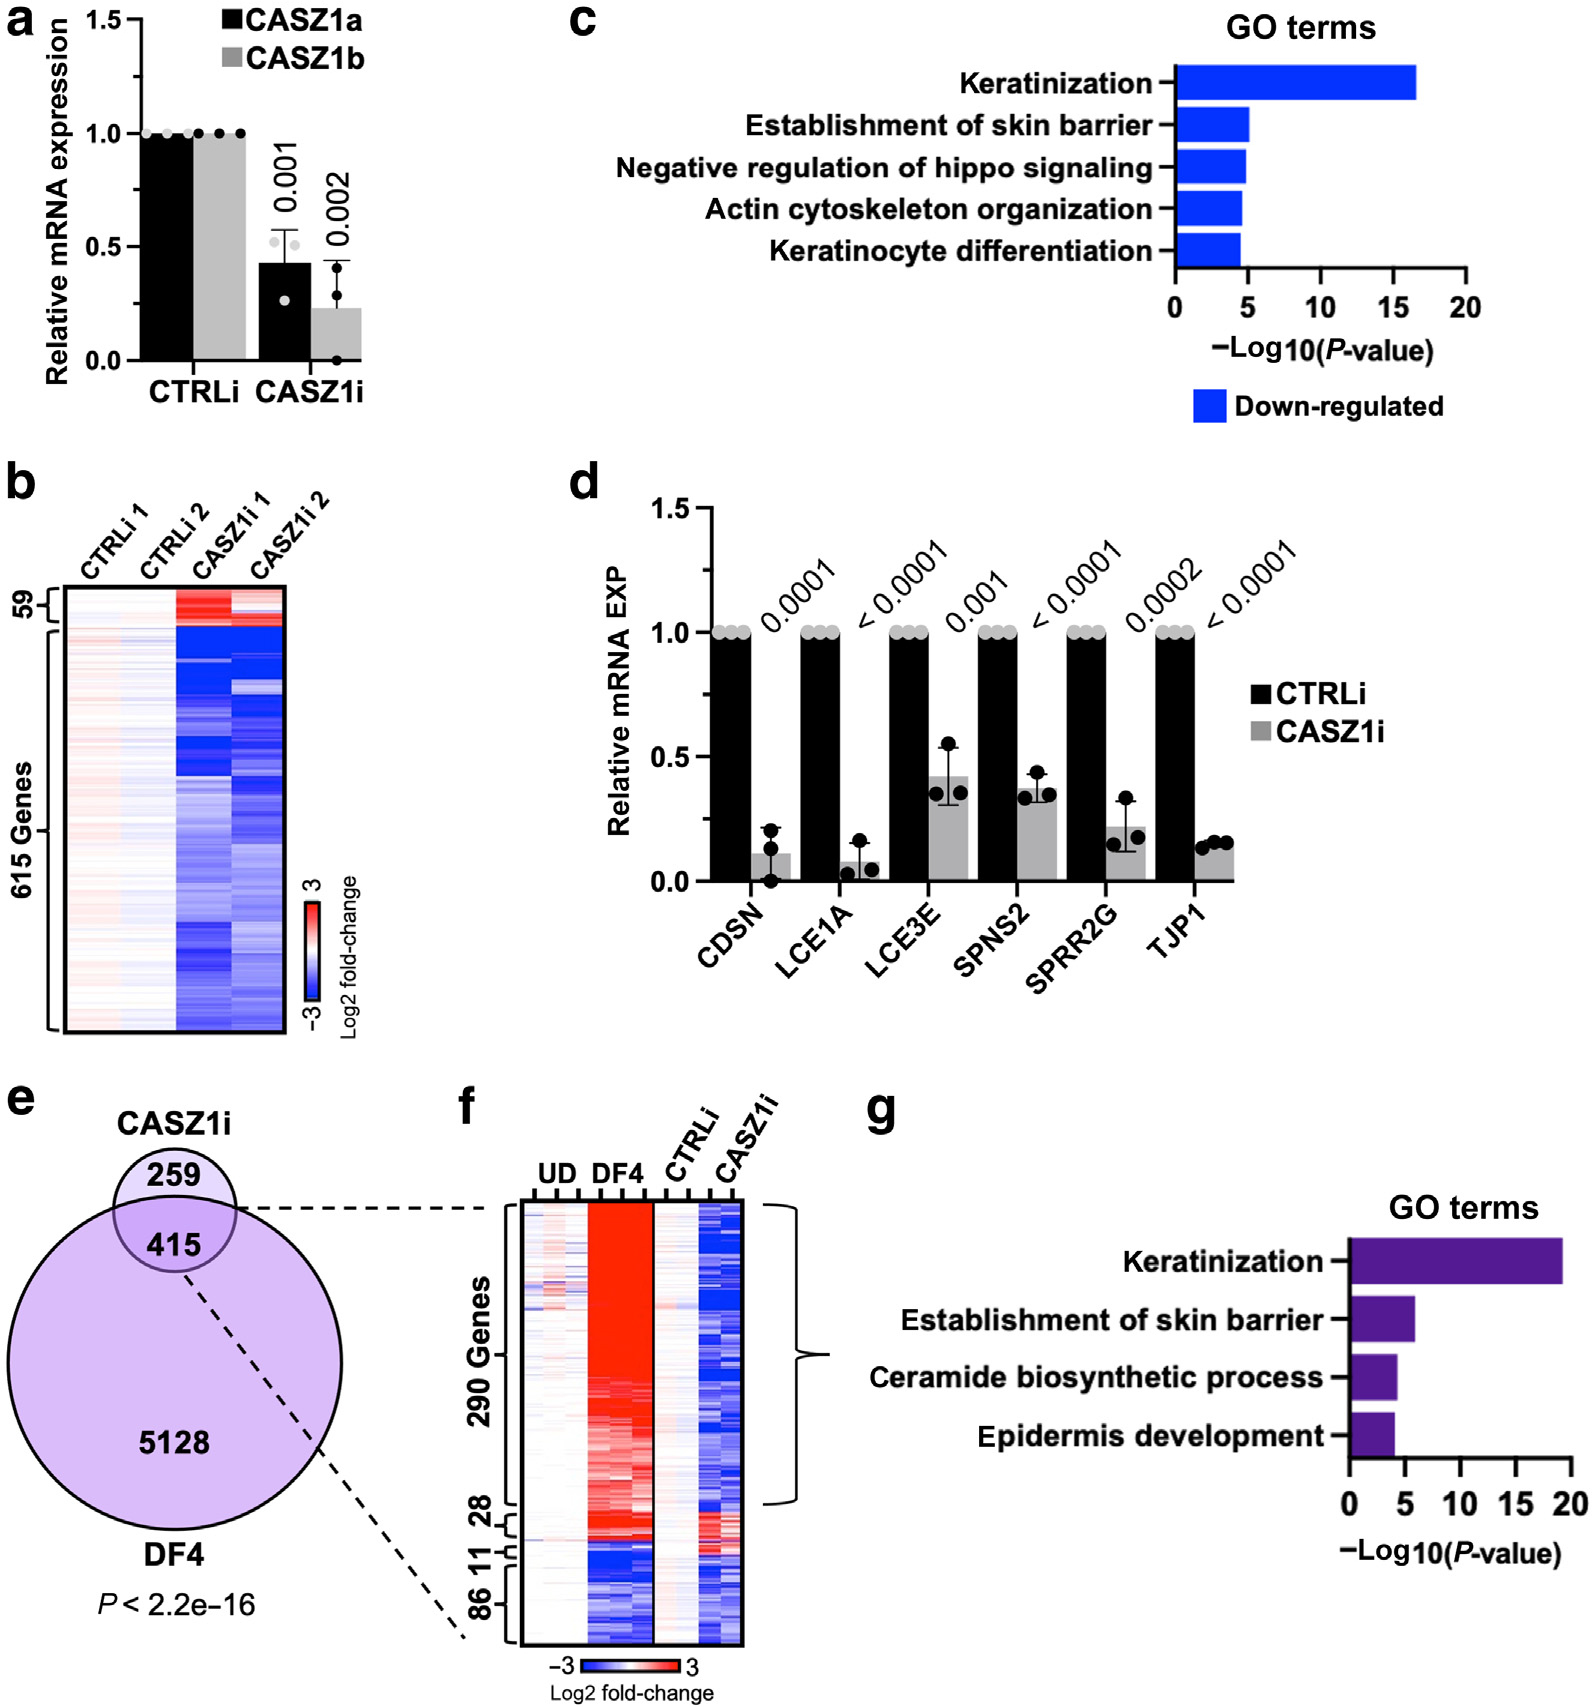
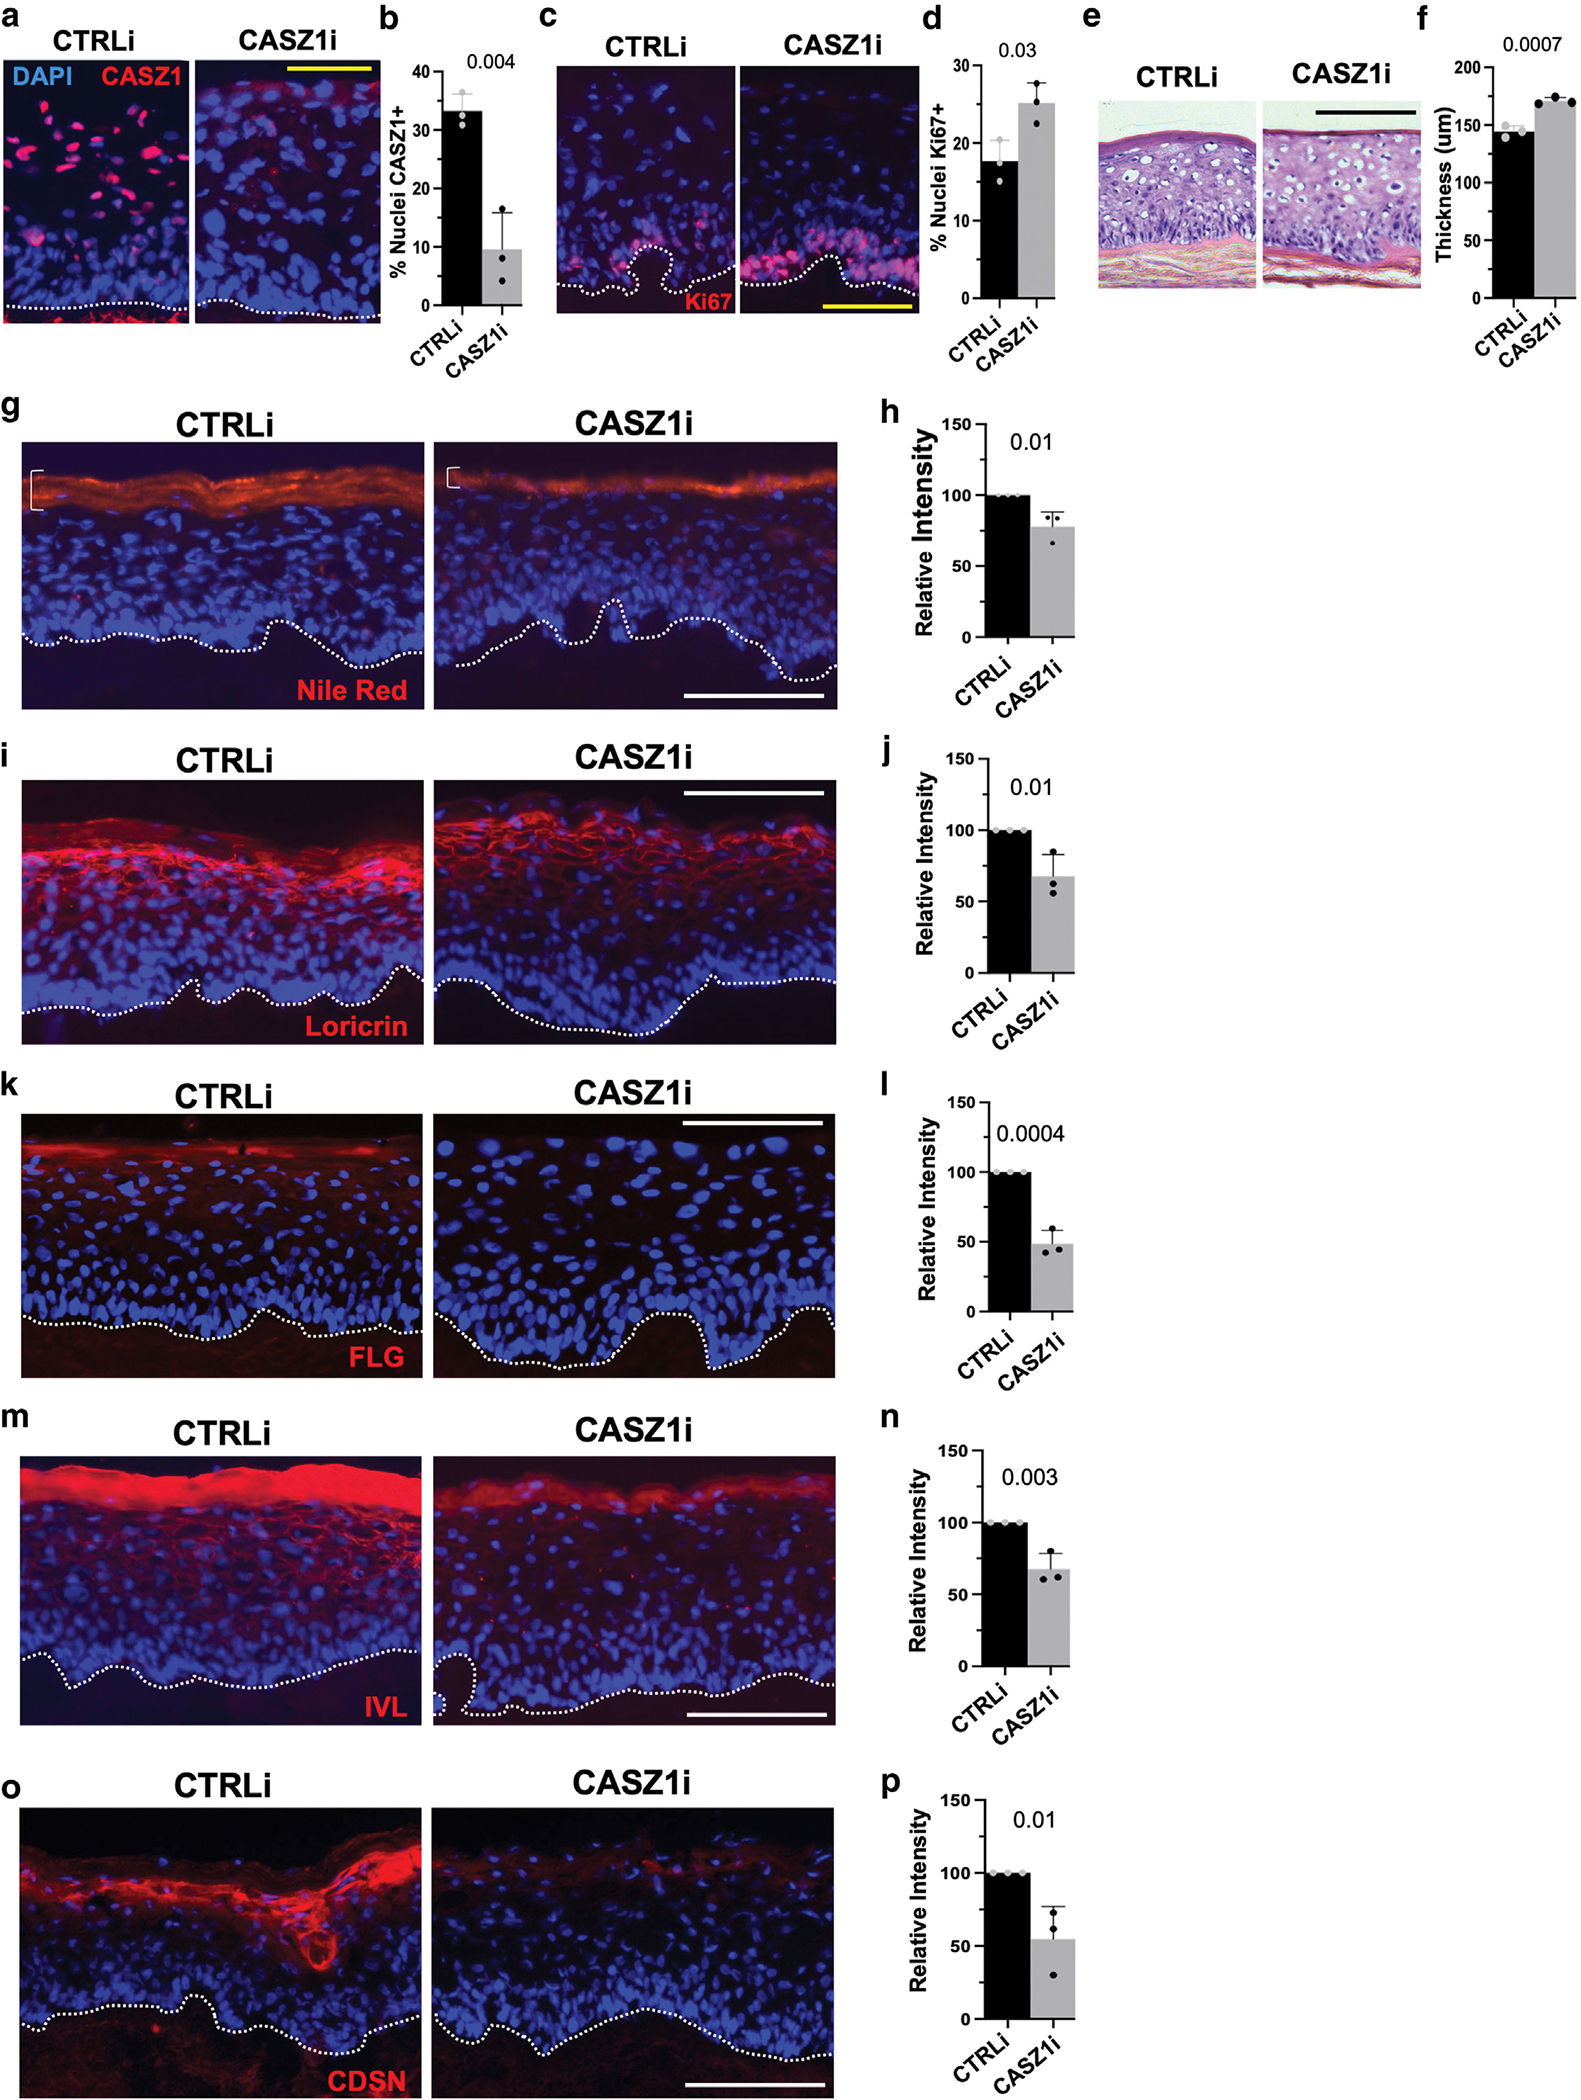
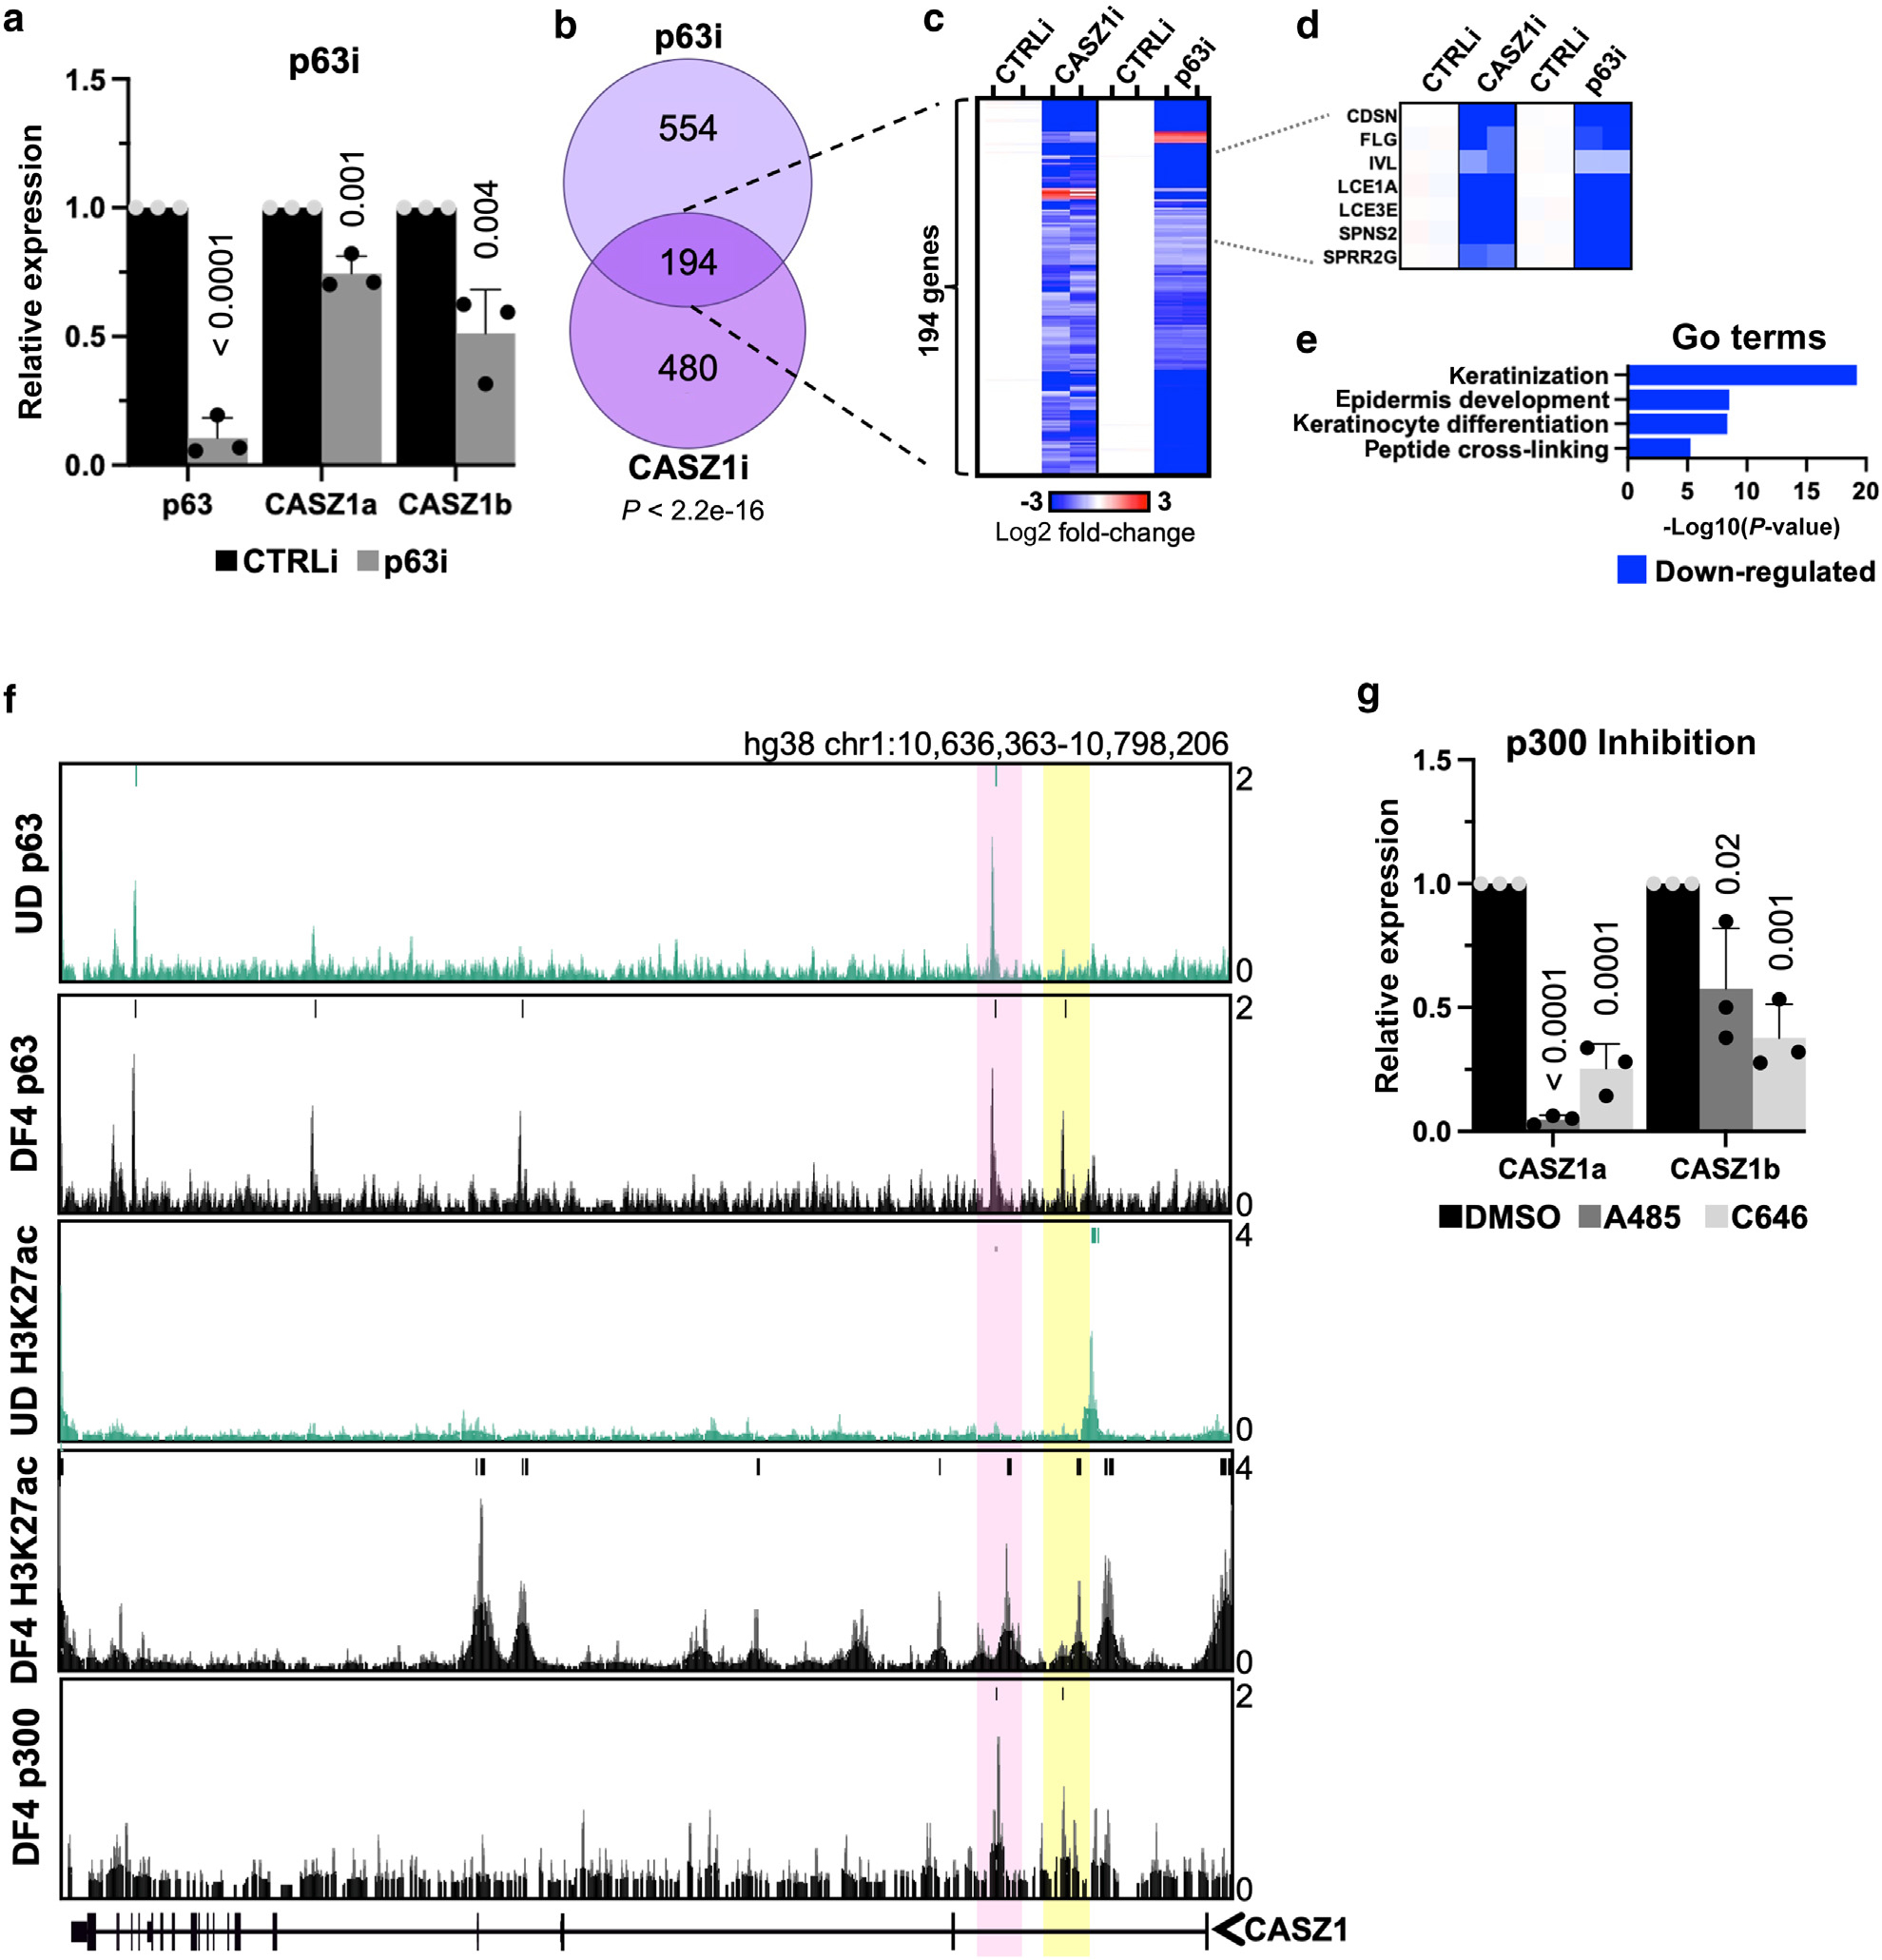
The barrier function of skin epidermis is crucial for our bodies to interface with the environment. Because epidermis continuously turns over throughout the lifetime, this barrier must be actively maintained by regeneration. Although several transcription factors have been established as essential activators in epidermal differentiation, it is unclear whether additional factors remain to be identified. In this study, we show that CASZ1, a multi zinc-finger transcription factor previously characterized in nonepithelial cell types, shows highest expression in skin epidermis. CASZ1 expression is upregulated during epidermal terminal differentiation. In addition, CASZ1 expression is impaired in several skin disorders with impaired barrier function, such as atopic dermatitis, psoriasis, and squamous cell carcinoma. Using transcriptome profiling coupled with RNA interference, we identified 674 differentially expressed genes with CASZ1 knockdown. Downregulated genes account for 91.2% of these differentially expressed genes and were enriched for barrier function. In organotypic epidermal regeneration, CASZ1 knockdown promoted proliferation and strongly impaired multiple terminal differentiation markers. Mechanistically, we found that CASZ1 upregulation in differentiation requires the action of both the master transcription factor, p63, and the histone acetyltransferase, p300. Taken together, our findings identify CASZ1 as an essential activator of epidermal differentiation, paving the way for future studies understanding of CASZ1 roles in skin disease.

Keywords: Barrier function; CASZ1; Differentiation; Keratinocytes; p63.


Conflict of interest statement

CONFLICT OF INTEREST

The authors state no conflict of interest.

Figures

Figure 1.
Figure 1.. CASZ1 expression increases during epidermal differentiation.
(a) GTEx mRNA expression data showing that CASZ1 expression is significantly greater in skin than in other human tissues. Red lines denote medians. One-way ANOVA was used. (b) Single-cell RNA-sequencing data showing CASZ1 expression in skin-resident cell types in palmoplantar and hip skin samples. (c) Representative images of CASZ1 staining in the skin. CASZ1 is detectable in the differentiated layers of epidermal tissue. Dotted line indicates the basement membrane. The area in green box is enlarged to the far right to show CASZ1 and DAPI colocalization. White bar indicates 125 μm. (d) Diagram showing the time points used in keratinocyte differentiation time course for CASZ1 expression analyses. (e) Diagram showing the CASZ1a and CASZ1b protein isoforms. (f) RT-qPCR showing the relative CASZ1a and CASZ1b expression during keratinocyte differentiation. Student’s t-tests (UD vs DF2 and UD vs DF4) were used. Mean ± SD of 3 biological replicates are shown. (g) Representative western blot showing increasing expression of both CASZ1 isoforms during differentiation. (h) Quantification of western blots. Student’s t-tests (UD vs DF2 and UD vs DF4) were performed. Mean ± SD of 3 biological replicates are shown. DF2 and DF4 denote day 2 and day 4 of differentiation, respectively. UD denotes undifferentiated. CaCl2, calcium chloride; GTEx, Genotype-Tissue Expression; hr, hour; TPM, transcripts per million.
Figure 2.
Figure 2.. CASZ1 expression is dysregulated in several types of skin diseases.
(a) Paired expression data from nonlesional and lesional skin from patients with atopic dermatitis. Paired t-test was performed. (b) Paired expression data from nonlesional and lesional skin from patients with psoriasis. Paired t-test was performed. (c) Paired expression data from normal-adjacent skin and cSCC tumors. Paired t-test was performed. cSCC, cutaneous squamous cell carcinoma; TPM, transcripts per million.
Figure 3.
Figure 3.. CASZ1 knockdown impairs keratinocyte differentiation.
(a) RT-qPCR showing CASZ1 knockdown efficiency in differentiated keratinocytes after siRNA treatment. Mean ± SD of 3 biological replicates are shown. Student’s t-tests. (b) Heatmap showing differentially expressed genes (log2 fold change > 1, P < .05) by RNA-seq in the differentiated state after siRNA treatment. (c) GO terms derived from differentially expressed genes. (d) RT-qPCR validation of RNA sequencing confirming decreased expression of epidermal differentiation markers. Mean ± SD of 3 biological replicates are shown. Student’s t-tests were performed. (e) Identification of genes differentially expressed in both calcium induced differentiation and CASZ1 siRNA treatment. Fisher’s exact test was performed. (f) Heatmap showing the relative expression of the 415 shared genes from CASZ1i and differentiation RNA-seq data sets. (g) GO terms of 290 shared genes of interest. UD denotes undifferentiated, and DF4 denotes day of differentiation. GO, Gene Ontology; RNA-seq, RNA sequencing; siRNA, small interfering RNA.
Figure 4.
Figure 4.. CASZ1 knockdown impairs epidermal terminal differentiation.
(a) Representative images of CASZ1 staining in control and CASZ1 siRNA organotypic cultures. Dotted white lines indicate basement membrane for all images in this figure. All yellow bars = 75 μm. (b) Quantification of the percentage of nuclei that are positive for CASZ1 expression. All graphs in this figure display mean ± SD of 3 biological replicates with student’s t-tests. (c) Representative images of Ki-67 staining. (d) Quantification of the percentage of nuclei that are positive for Ki-67 expression. (e) Representative H&E images. Black bar = 150 μm. (f) Quantification of epidermal thickness. (g) Representative images of Nile red staining. White brackets indicate epidermis with positive Nile red staining. All white bars = 125 μm. (h) Quantification of Nile red intensity. (i) Representative images of loricrin staining. (j) Quantification of loricrin intensity. (k) Representative images of FLG staining. (l) Quantification of FLG intensity. (m) Representative images of involucrin staining. (n) Quantification of involucrin intensity. (o) Representative images of CDSN staining. (p) Quantification of CDSN intensity. siRNA, small interfering RNA.
Figure 5.
Figure 5.. CASZ1 upregulation in differentiation requires p63 and p300.
(a) RT-qPCR showing p63 knockdown efficiency in differentiated keratinocytes and CASZ1 expression in response to p63i. Mean ± SD of 3 biological replicates with student’s t-tests are shown. (b) Overlap of differentially expressed genes p63i and CASZ1i RNA-seq data sets. Fisher’s exact test. (c) A heatmap of the differentially expressed genes shared by CASZ1i and p63i. (d) A zoom in of the heatmap showing epidermal differentiation markers validated in this study. (e) Top GO terms of the 194 shared genes. (f) The pink and yellow highlights indicate the regions of interest. Genome browser tracks at the CASZ1 locus showing p63 binding in intron 1 overlapping with increased H3K27ac and p300 peaks in DF4. (g) RT-qPCR showing decreased CASZ1 expression in response to p300 inhibitor treatments. Mean ± SD of 3 biological replicates with student’s t-tests are shown. DF4, day 4 of differentiation; GO, Gene Ontology; RNA-seq, RNA-sequencing.

Similar articles

Cited by

References

    1. Bao X, Rubin AJ, Qu K, Zhang J, Giresi PG, Chang HY, et al. A novel ATAC-seq approach reveals lineage-specific reinforcement of the open chromatin landscape via cooperation between BAF and p63. Genome Biol 2015;16:284. - PMC - PubMed
    1. Bhaskaran N, Liu Z, Saravanamuthu SS, Yan C, Hu Y, Dong L, et al. Identification of Casz1 as a regulatory protein controlling T helper cell differentiation, inflammation, and immunity. Front Immunol 2018;9:184. - PMC - PubMed
    1. Borsari B, Villegas-Mirón P, Pérez-Lluch S, Turpin I, Laayouni H, Segarra-Casas A, et al. Enhancers with tissue-specific activity are enriched in intronic regions. Genome Res 2021;31:1325–36. - PMC - PubMed
    1. Boxer LD, Barajas B, Tao S, Zhang J, Khavari PA. ZNF750 interacts with KLF4 and RCOR1, KDM1A, and CTBP1/2 chromatin regulators to repress epidermal progenitor genes and induce differentiation genes. Genes Dev 2014;28:2013–26. - PMC - PubMed
    1. Christine KS, Conlon FL. Vertebrate CASTOR is required for differentiation of cardiac precursor cells at the ventral midline. Dev Cell 2008;14:616–23. - PMC - PubMed

MeSH terms