. 2024 Mar 8;15(3):200.
doi: 10.1038/s41419-024-06582-0.

p66Shc signaling and autophagy impact on C2C12 myoblast differentiation during senescence

Affiliations

p66Shc signaling and autophagy impact on C2C12 myoblast differentiation during senescence

Yaiza Potes et al. Cell Death Dis. .

Abstract

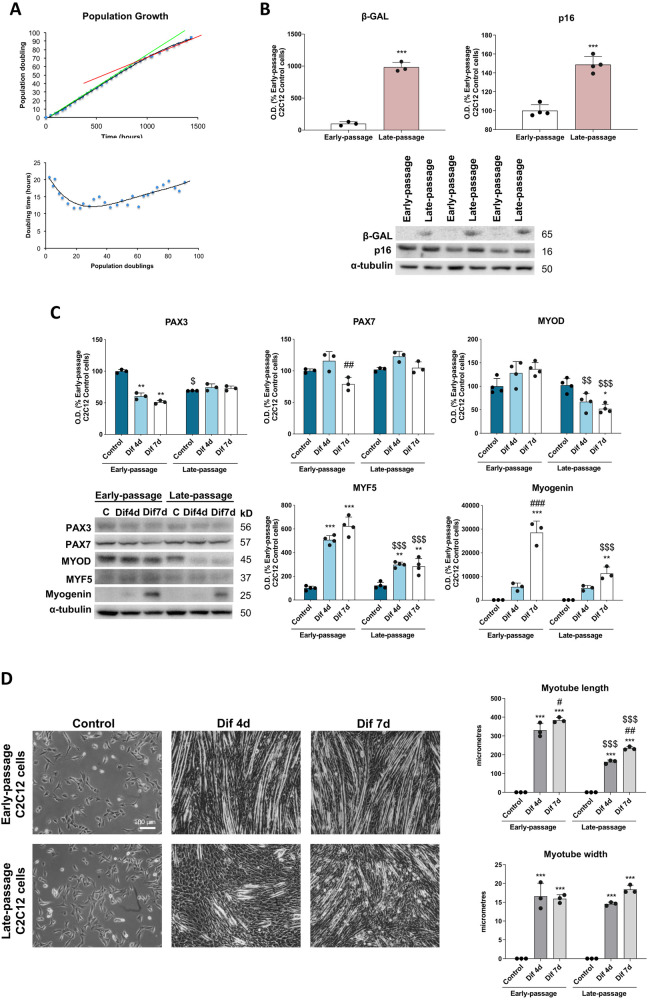
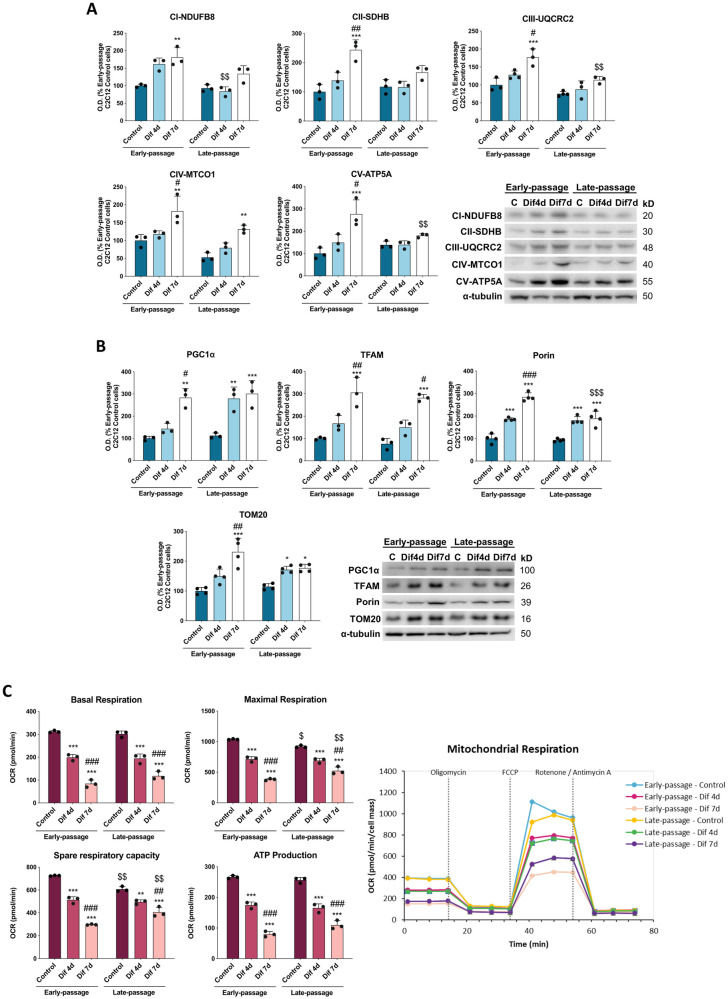
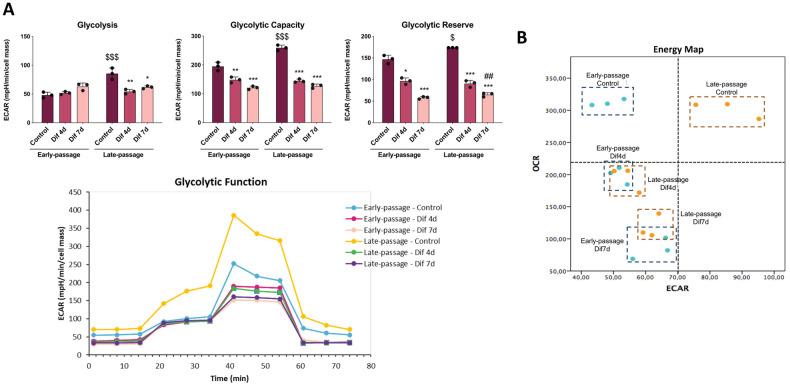
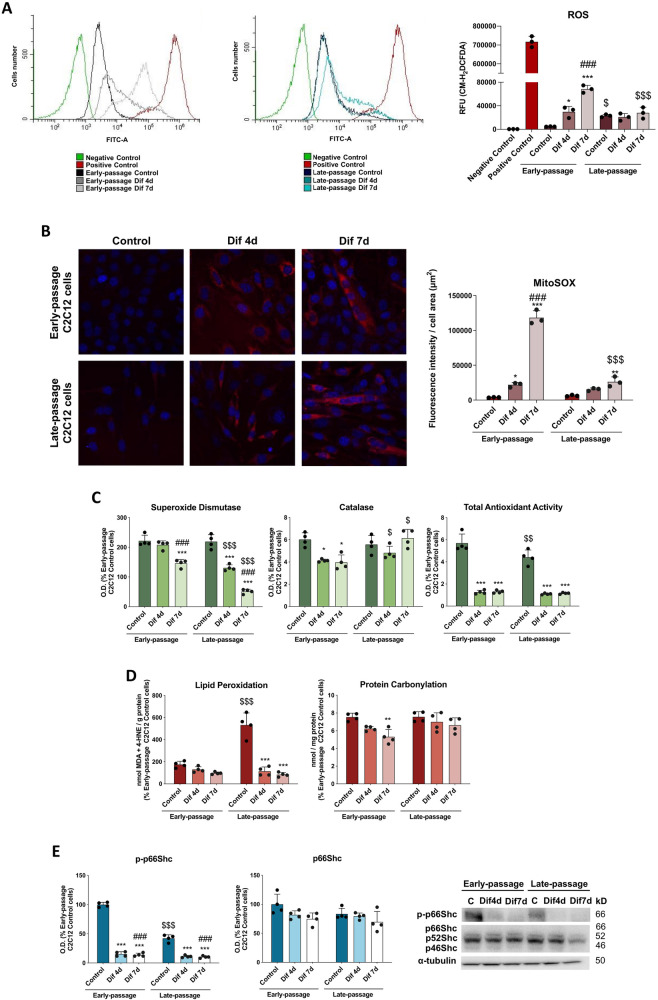
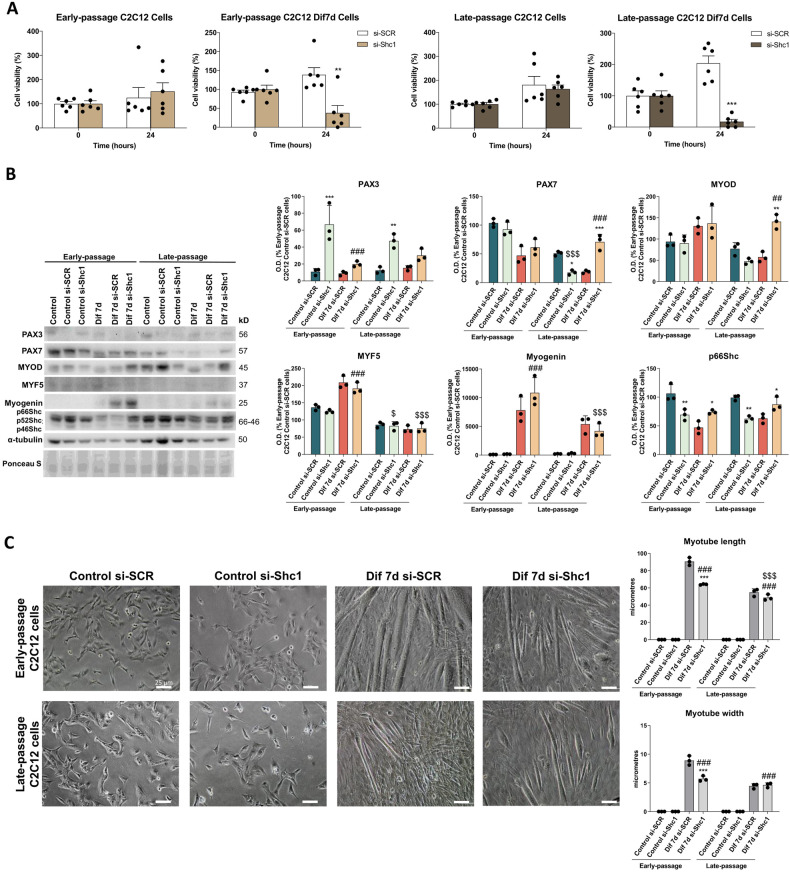
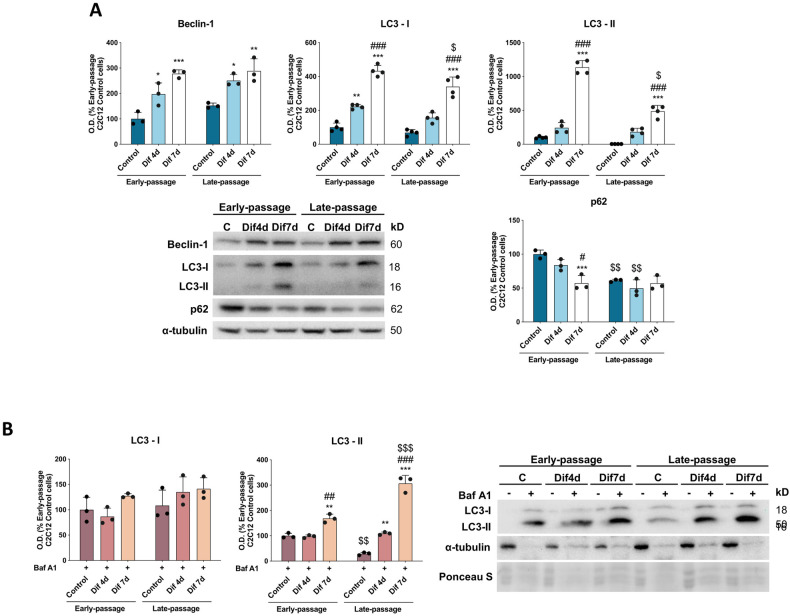
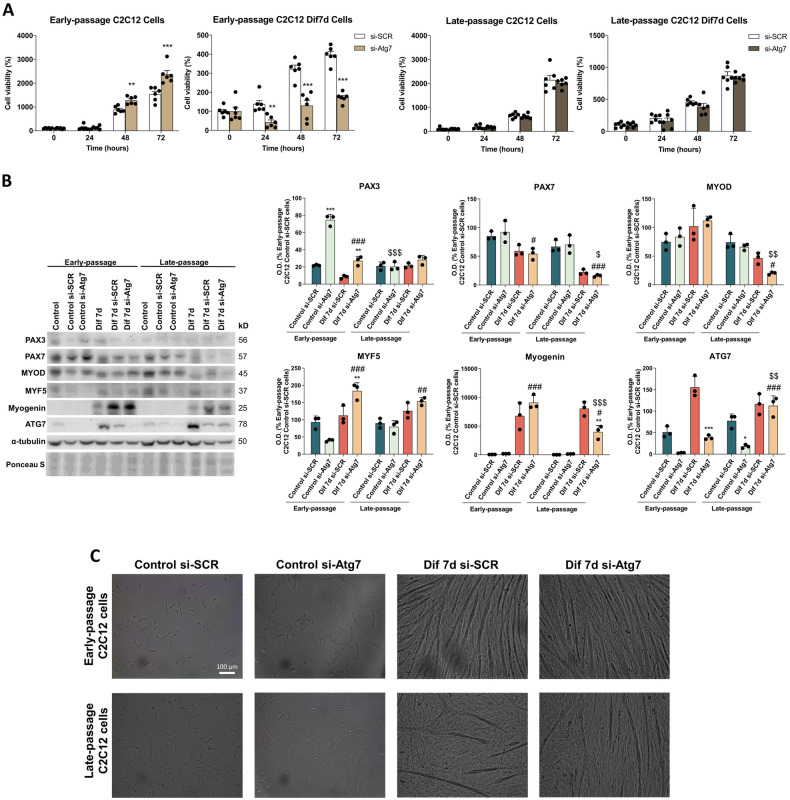
During aging, muscle regenerative capacities decline, which is concomitant with the loss of satellite cells that enter in a state of irreversible senescence. However, what mechanisms are involved in myogenic senescence and differentiation are largely unknown. Here, we showed that early-passage or "young" C2C12 myoblasts activated the redox-sensitive p66Shc signaling pathway, exhibited a strong antioxidant protection and a bioenergetic profile relying predominantly on OXPHOS, responses that decrease progressively during differentiation. Furthermore, autophagy was increased in myotubes. Otherwise, late-passage or "senescent" myoblasts led to a highly metabolic profile, relying on both OXPHOS and glycolysis, that may be influenced by the loss of SQSTM1/p62 which tightly regulates the metabolic shift from aerobic glycolysis to OXPHOS. Furthermore, during differentiation of late-passage C2C12 cells, both p66Shc signaling and autophagy were impaired and this coincides with reduced myogenic capacity. Our findings recognized that the lack of p66Shc compromises the proliferation and the onset of the differentiation of C2C12 myoblasts. Moreover, the Atg7 silencing favored myoblasts growth, whereas interfered in the viability of differentiated myotubes. Then, our work demonstrates that the p66Shc signaling pathway, which highly influences cellular metabolic status and oxidative environment, is critical for the myogenic commitment and differentiation of C2C12 cells. Our findings also support that autophagy is essential for the metabolic switch observed during the differentiation of C2C12 myoblasts, confirming how its regulation determines cell fate. The regulatory roles of p66Shc and autophagy mechanisms on myogenesis require future attention as possible tools that could predict and measure the aging-related state of frailty and disability.


Conflict of interest statement

The authors declare no competing interests.

Figures

Fig. 1
Fig. 1. Replicative senescence alters C2C12 growth dynamics and myogenic differentiation.
A Growth dynamics were evaluated by measuring population doublings at the end of every passage and the doubling population time. B Protein expression analysis of senescence markers (β-GAL and p16) (n = 4). Data are mean of optical density (O.D.) ± SD expressed as percentage of Early-passage C2C12 Control cells. α-tubulin was used as loading control. Statistical comparisons: *Early-passage vs. Late-passage. The number of symbols represents the level of statistical significance: one for P < 0.05, two for P < 0.01 and three for P < 0.001. C Protein expression analysis of myogenic markers (PAX3, PAX7, MYOD, MYF5 and myogenin) (n = 4). Data are mean of optical density (O.D.) ± SD expressed as percentage of Early-passage C2C12 Control cells. α-tubulin was used as loading control. D Phase contrast light microscopy of proliferating early- and late-passage C2C12 myoblasts and differentiating myotubes on day 4 (Dif4d) and day 7 (Dif7d) and myotube length and width quantification) (n = 3). Scale bar represents 100 μm. Statistical comparisons: *Control vs. Differentiation; # Dif4d vs. Dif7d; $ Early-passage vs. Late-passage. The number of symbols represents the level of statistical significance: one for P < 0.05, two for P < 0.01 and three for P < 0.001.
Fig. 2
Fig. 2. Senescence remodels OXPHOS complexes and mitochondrial respiration.
A Protein expression analysis of OXPHOS subunits from each complex (NFUFB8, SDHB, UQCRC2, MTCO1, ATP5A) (n = 3). Data are mean of optical density (O.D.) ± SD expressed as percentage of Early-passage C2C12 Control cells. α-tubulin was used as loading control. B Protein expression analysis of the mitochondrial biogenesis markers PGC1α and TFAM and the mitochondrial mass markers Porin and TOM20) (n = 3). Data are mean of optical density (O.D.) ± SD expressed as percentage of Early-passage C2C12 Control cells. α-tubulin was used as loading control. C Mitochondrial bioenergetics evaluation by measuring basal respiration, maximal respiration, spare respiratory capacity and respiration associated to ATP production, following addition of oligomycin, FCCP and rotenone/antimycin A (n = 3). Data are mean ± SD. Statistical comparisons: *Control vs. Differentiation; # Dif4d vs. Dif7d; $ Early-passage vs. Late-passage. The number of symbols represents the level of statistical significance: one for P < 0.05, two for P < 0.01 and three for P < 0.001.
Fig. 3
Fig. 3. Senescence promotes glycolytic metabolism.
A Extracellular acidification rates indirectly representing glycolysis, glycolytic capacity and glycolytic reserve based on the responses to glucose, oligomycin and 2-deoxy-d-glycose. Data are mean ± SD. B Energy map showing the correlation between oxygen consumption rate (OCR) and extracellular acidification rate (ECAR) (n = 3). Statistical comparisons: *Control vs. Differentiation; # Dif4d vs. Dif7d; $ Early-passage vs. Late-passage. The number of symbols represents the level of statistical significance: one for P < 0.05, two for P < 0.01 and three for P < 0.001.
Fig. 4
Fig. 4. Senescence represses p66Shc activation and alters oxidative stress status in C2C12 cells.
A Determination of reactive oxygen species (ROS) levels by flow cytometric analysis of CM-H2DCFDA staining (n = 3). Data are mean of relative fluorescence unit (RFU) ± SD. B The fluorogenic substrate MitoSOX was used to study mitochondrial-derived ROS production by confocal microscopy analysis (n = 3). Data are mean of fluorescence intensity ± SD. C Antioxidant system evaluation by the activity determination of superoxide dismutase and catalase enzymes and the total antioxidant activity (n = 4). The inhibition of hematoxylin autoxidation to hematin was assessed to determine SOD activity (n = 4). Catalase activity was assayed by measuring H2O2 conversion in O2 and H2O (n = 4). Total antioxidant activity was analyzed using ABTS/H2O2/HRP method (n = 4). D Levels of lipid peroxidation and protein carbonylation were also analyzed. MDA and 4-HNE end-products were measured to determine lipid peroxidation levels (n = 4). Protein carbonylation was evaluated by measuring the reaction of 2,4-dinitrophenylhydrazine with the carbonyl groups of damaged proteins (n = 4). Data are mean ± SD. E Protein expression analysis of the Shc-transforming protein 1 p66Shc and p-p66Shc (n = 4). Data are mean of optical density (O.D.) ± SD expressed as percentage of Early-passage C2C12 Control cells. α-tubulin was used as loading control. Statistical comparisons: *Control vs. Differentiation; # Dif4d vs. Dif7d; $ Early-passage vs. Late-passage. The number of symbols represents the level of statistical significance: one for P < 0.05, two for P < 0.01 and three for P < 0.001.
Fig. 5
Fig. 5. Silencing the adaptor gene Shc1 alters C2C12 cell commitment and differentiation.
A Effect of Shc1 silencing (si-Shc1) on cell viability of Early-passage and Late-passage Control C2C12 and Dif7d C2C12 cells after 0- and 24-h treatment (n = 6). Data are mean ± SD. Statistical comparisons: *si-SCR vs. si-Shc1. The number of symbols represents the level of statistical significance: one for P < 0.05, two for P < 0.01 and three for P < 0.001. B Protein expression analysis of myogenic markers (PAX3, PAX7, MYOD, MYF5 and myogenin) and p66Shc levels in Early- and Late-passage Control C2C12 myoblasts and differentiating myotubes on day 7 (Dif7d) transfected with Shc1 (si-Shc1) or with scrambled siRNA (si-SCR) (n = 3). Data are mean of optical density (O.D.) ± SD expressed as percentage of Early-passage Control si-SCR C2C12 cells. Ponceau staining was used as loading control. C Phase contrast light microscopy of proliferating Early-passage and Late-passage Control si-SCR and si-Shc1 cells and differentiating myotubes Dif7d si-SCR and Dif7d si-Atg7 and myotube length and width quantification (n = 3). Scale bar represents 100 μm. Statistical comparisons: *si-SCR vs. si-Shc1; # Control vs. Dif7d; $ Early-passage vs. Late-passage. The number of symbols represents the level of statistical significance: one for P < 0.05, two for P < 0.01 and three for P < 0.001.
Fig. 6
Fig. 6. Senescence alters autophagic flux.
A Protein expression analysis of autophagy markers (Beclin-1, LC3-I, LC3-II and SQSTM1/p62) (n = 3). B Detection of autophagic flux after inhibiting autophagosome-lysosome fusion with bafilomycin A1 by the protein expression analysis of LC3-I and LC3-II (n = 3). Data are mean of optical density (O.D.) ± SD expressed as percentage of Early-passage C2C12 Control cells. Ponceau staining was used as loading control. Statistical comparisons: *Control vs. Differentiation; # Dif4d vs. Dif7d; $ Early- vs. Late-passage. The number of symbols represents the level of statistical significance: one for P < 0.05, two for P < 0.01 and three for P < 0.001.
Fig. 7
Fig. 7. Silencing the autophagy-specific gene Atg7 differentially alters cell fate in young and senescent C2C12 cells.
A Effect of Atg7 silencing through (si-Atg7) transfection on cell viability of Early- and Late-passage Control C2C12 and Dif7d C2C12 cells after 0-, 24-, 48- and 72 h treatment (n = 6). Data are mean ± SD. Statistical comparisons: *si-SCR vs. si-Atg7. The number of symbols represents the level of statistical significance: one for P < 0.05, two for P < 0.01 and three for P < 0.001. B Protein expression analysis of myogenic markers (PAX3, PAX7, MYOD, MYF5 and myogenin) and ATG7 levels in Early- and Late-passage Control C2C12 myoblasts and differentiating myotubes on day 7 (Dif7d) transfected with Atg7 (si-Atg7) or with scrambled siRNA (si-SCR) (n = 3). Data are mean of optical density (O.D.) ± SD expressed as percentage of Early-passage Control si-SCR C2C12 cells. Ponceau staining was used as loading control. Statistical comparisons: *si-SCR vs. si-Atg7; # Control vs. Dif7d; $ Early- vs. Late-passage. The number of symbols represents the level of statistical significance: one for P < 0.05, two for P < 0.01 and three for P < 0.001. C Phase contrast light microscopy of proliferating Early- and Late-passage Control si-SCR and si-Atg7 cells and differentiating myotubes Dif7d si-SCR and Dif7d si-Atg7 (n = 3). Scale bar represents 100 μm.

Similar articles

Cited by

References

    1. Sousa-Victor P, Gutarra S, Garcia-Prat L, Rodriguez-Ubreva J, Ortet L, Ruiz-Bonilla V, et al. Geriatric muscle stem cells switch reversible quiescence into senescence. Nature. 2014;506:316–21. doi: 10.1038/nature13013. - DOI - PubMed
    1. Di Donna S, Renault V, Forestier C, Piron-Hamelin G, Thiesson D, et al. Regenerative capacity of human satellite cells: the mitotic clock in cell transplantation. Neurol Sci. 2000;21:S943–51. doi: 10.1007/s100720070008. - DOI - PubMed
    1. Sharples AP, Al-Shanti N, Lewis MP, Stewart CE. Reduction of myoblast differentiation following multiple population doublings in mouse C2 C12 cells: a model to investigate ageing? J Cell Biochem. 2011;112:3773–85. doi: 10.1002/jcb.23308. - DOI - PubMed
    1. Yu JS, Cui W. Proliferation, survival and metabolism: the role of PI3K/AKT/mTOR signalling in pluripotency and cell fate determination. Development. 2016;143:3050–60. doi: 10.1242/dev.137075. - DOI - PubMed
    1. Koopman R, Ly CH, Ryall JG. A metabolic link to skeletal muscle wasting and regeneration. Front Physiol. 2014;5:32. doi: 10.3389/fphys.2014.00032. - DOI - PMC - PubMed

Publication types

MeSH terms

Substances

LinkOut - more resources