. 2024 Mar 8;15(3):195.
doi: 10.1038/s41419-024-06573-1.

STING dependent BAX-IRF3 signaling results in apoptosis during late-stage Coxiella burnetii infection

Affiliations

STING dependent BAX-IRF3 signaling results in apoptosis during late-stage Coxiella burnetii infection

Manish Chauhan et al. Cell Death Dis. .

Abstract

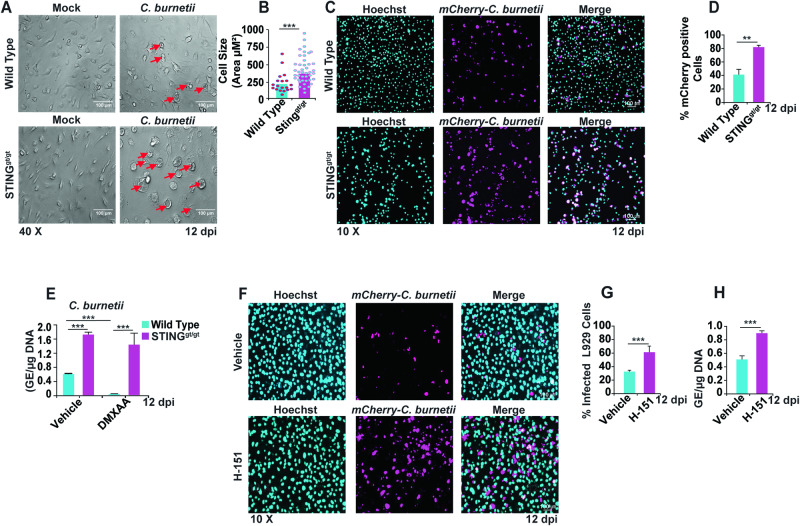
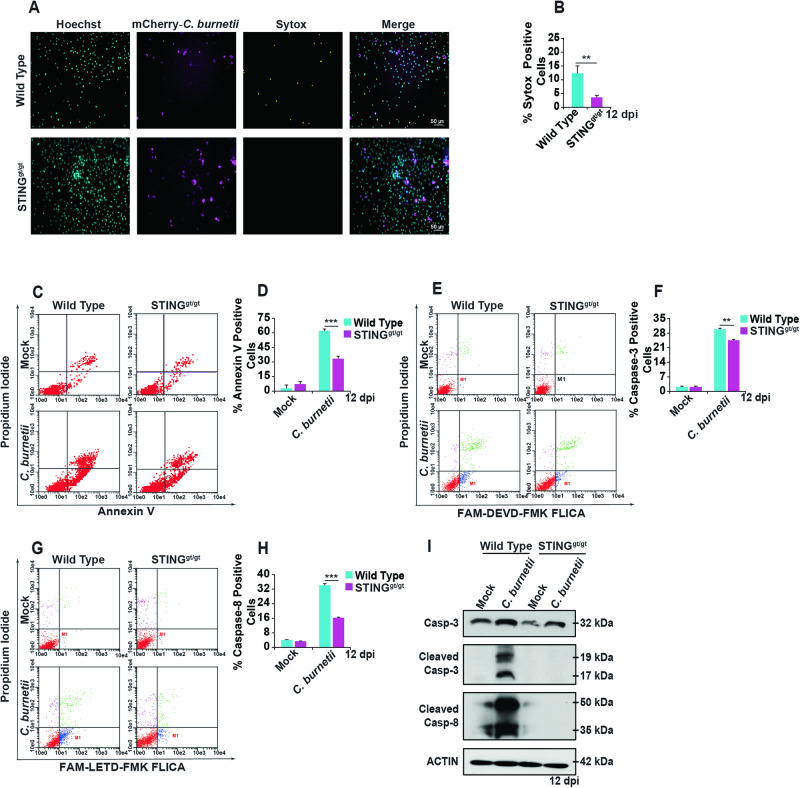
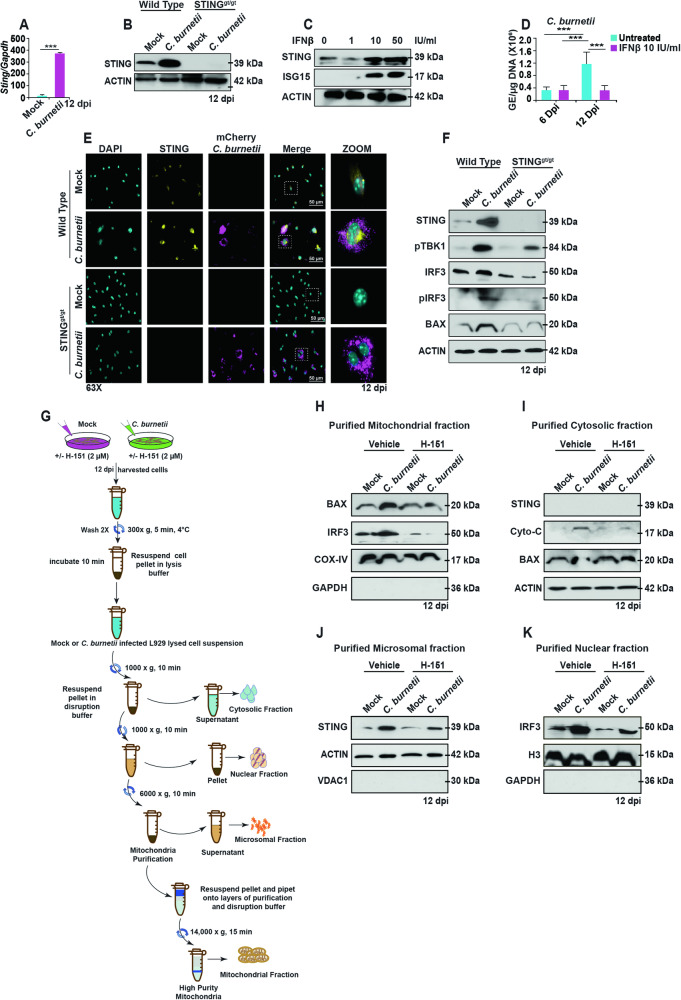
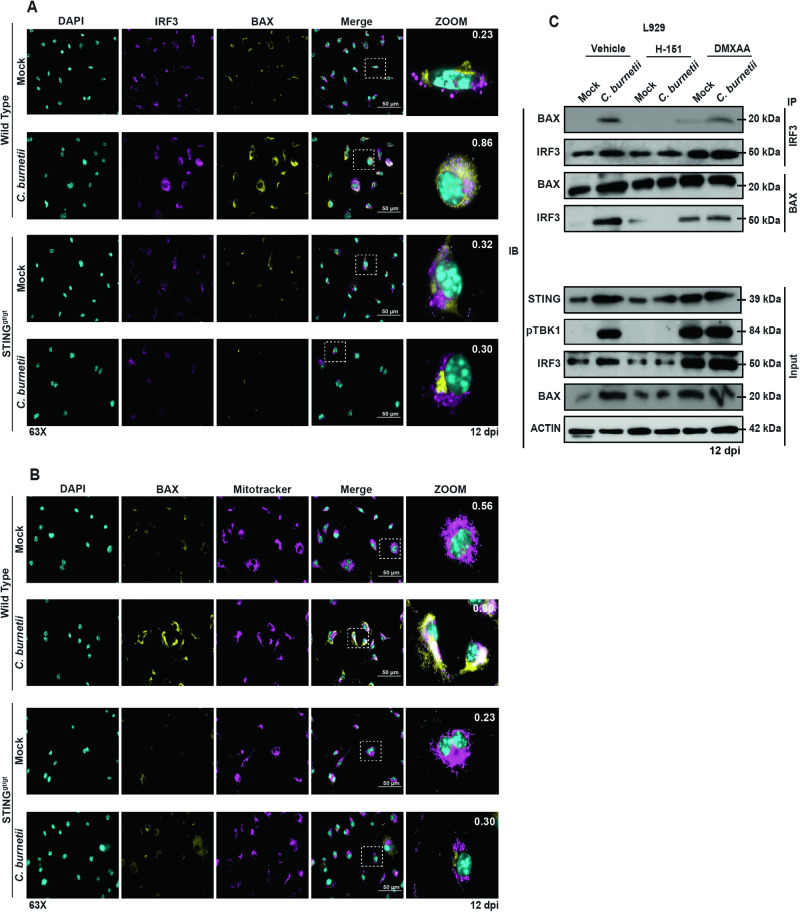
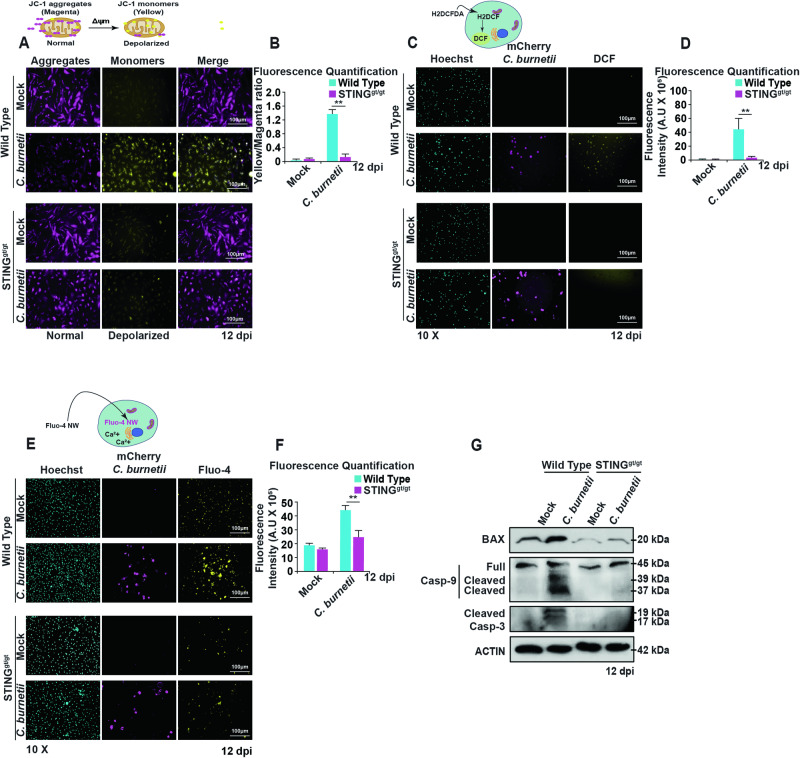
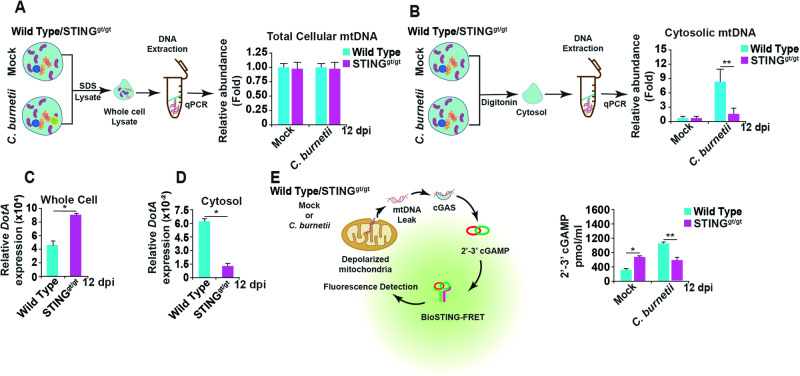
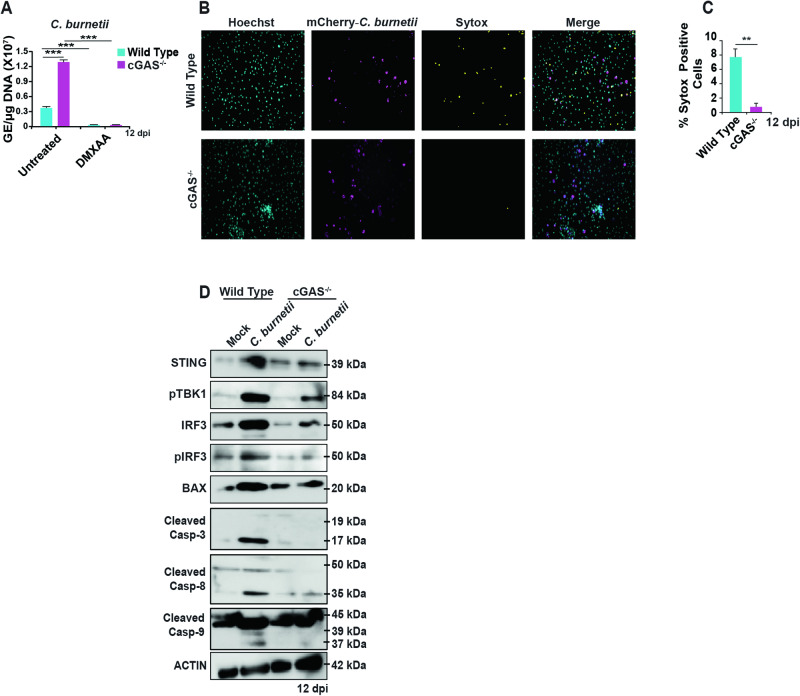
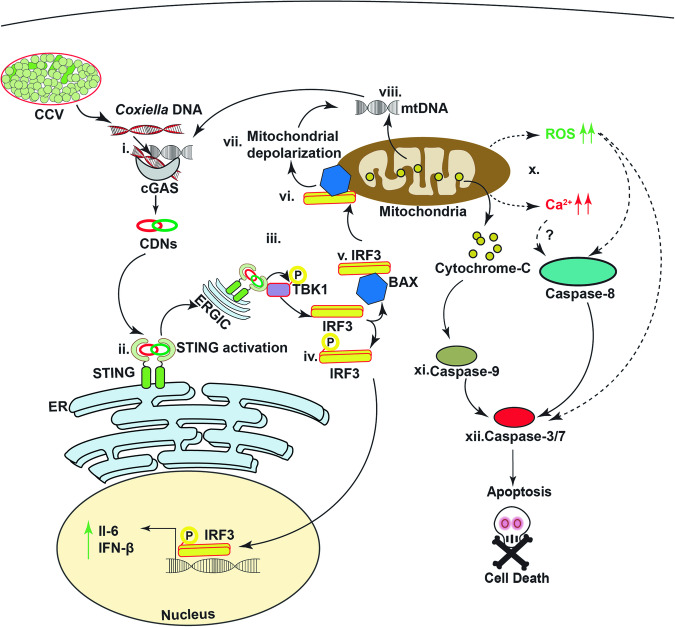
STING (STimulator of Interferon Genes) is a cytosolic sensor for cyclic dinucleotides (CDNs) and initiates an innate immune response upon binding to CDNs. Coxiella burnetii is a Gram-negative obligate intracellular bacterium and the causative agent of the zoonotic disease Q fever. The ability of C. burnetii to inhibit host cell death is a critical factor in disease development. Previous studies have shown that C. burnetii inhibits host cell apoptosis at early stages of infection. However, during the late-stages of infection, there is host cell lysis resulting in the release of bacteria to infect bystander cells. Thus, we investigated the role of STING during late-stages of C. burnetii infection and examined STING's impact on host cell death. We show that the loss of STING results in higher bacterial loads and abrogates IFNβ and IL6 induction at 12 days post-infection. The absence of STING during C. burnetii infection significantly reduces apoptosis through decreased caspase-8 and -3 activation. During infection, STING activates IRF3 which interacts with BAX. BAX then translocates to the mitochondria, which is followed by mitochondrial membrane depolarization. This results in increased cytosolic mtDNA in a STING-dependent manner. The presence of increased cytosolic mtDNA results in greater cytosolic 2'-3' cGAMP, creating a positive feedback loop and leading to further increases in STING activation and its downstream signaling. Taken together, we show that STING signaling is critical for BAX-IRF3-mediated mitochondria-induced apoptosis during late-stage C. burnetii infection.


Conflict of interest statement

The authors declare no competing interests.

Figures

Fig. 1
Fig. 1. STING deficiency leads to increased bacterial load.
A Differential interference contrast (DIC) micrograph of mock- and C. burnetii-infected WT and STINGgt/gt BMDMs at 12 dpi. Red arrows indicate rounded, enlarged cells. B Graph represents the quantified cell size of C. burnetii infected WT and STINGgt/gt BMDMs at 12 dpi. Data are representative of three different fields of view from three biological replicates of each genotype from three independent experiments. Error bars, SEM. Unpaired T-test, ***p < 0.001. C Fluorescent micrographs show mCherry-C. burnetii infected (magenta) WT and STINGgt/gt BMDMs and counterstained with nuclear staining dye Hoechst 33342 (cyan). The micrographs are representative of four independent experiments. D Percentage of mCherry-positive WT and STINGgt/gt BMDMs at 12 dpi. Data are representative of three different fields of view from three biological replicates of each genotype from three independent experiments. Error bars, SEM. Unpaired T-test, **p < 0.01. E Bacterial load in WT and STINGgt/gt BMDMs at 12 dpi measured as genomic equivalents (GE) in presence and absence of pharmacological STING activator DMXAA (25 μg/ml). Data are representative of three biological replicates of 2 × 105 cells per well of each genotype from three independent experiments. Error bars, SEM. Unpaired T-test, ***p < 0.001. F Fluorescent micrographs show mCherry-C. burnetii infected (magenta) L929 cells treated with vehicle or H-151 and counterstained with Hoechst 33342 (cyan) at 12 dpi. The micrographs are representative of five independent experiments. G Percentage of mCherry-positive vehicle- or H-151(2 μM)-treated L929 cells at 12 dpi. Data are representative of five different fields of view from three wells from each treatment group from three independent experiments. Error bars, SEM. Unpaired T-test, ***p < 0.001. H Bacterial load in vehicle- or H-151-treated L929 cells at 12 dpi measured as genomic equivalents (GE). Data are representative of five biological replicates from 5 × 105 cells per well of each genotype from three independent experiments. Error bars, SEM. Unpaired T-test, ***p < 0.001.
Fig. 2
Fig. 2. Host response to C. burnetii infection in the presence and absence of STING.
AC qRT-PCR of Ifnb, Il6, and Tnfa in mock- or C. burnetii-infected WT and STINGgt/gt BMDMs at 12 dpi. Data are representative of four biological replicates from 2 × 105 cells per well of each genotype from four independent experiments. Error bars, SEM. Unpaired T-test, *p < 0.05, **p < 0.01. DF ELISA of IFNβ, IL6 and TNFα produced in cell culture supernatants of mock- or C. burnetii-infected WT and STINGgt/gt BMDMs at 12 dpi. Data are representative of three biological replicates each from 2 × 105 cells per well of each genotype from three independent experiments. Error bars, SEM. Unpaired T-test, *p < 0.05.
Fig. 3
Fig. 3. STING promotes programmed cell death during C. burnetii infection in BMDMs.
A Fluorescent micrographs of mCherry-C. burnetii-infected (magenta) WT and STINGgt/gt BMDMs at 12 dpi, Hoechst 33342 (cyan) nuclear staining, and SYTOX (yellow) staining to detect dead cells. The micrographs are representative of three independent experiments. B Percentage of SYTOX-positive WT and STINGgt/gt BMDMs during C. burnetii infection at 12 dpi. Data are representative of three different fields of view from four independent experiments. Error bars, SEM. Unpaired T-test, **p < 0.01. C Annexin V- and Propidium Iodide-positive cell populations from mock- and C. burnetii-infected WT and STINGgt/gt BMDMs at 12 dpi using flow cytometry. Representative scatter plots from three independent experiments are shown. D Percentage of Annexin V-positive WT and STINGgt/gt BMDMs population during C. burnetii infection at 12 dpi. Data are representative of three biological replicates from three independent experiments. Error bars, SEM. Unpaired T-test, ***p < 0.001. E Caspase-3 activation was determined by flow cytometry using the FAM-DEVD-FMK FLICA peptide in mock- or C. burnetii-infected WT and STINGgt/gt BMDMs at 12 dpi. Representative scatter plots from three independent experiments are shown. F Percentage of caspase-3 positive WT and STINGgt/gt BMDMs during C. burnetii infection at 12 dpi. Data are representative of three biological replicates from three independent experiments. Error bars, SEM. Unpaired T-test, **p < 0.01. G Caspase-8 activation was determined by flow cytometry using the FAM-LETD-FMK FLICA peptide in mock- or C. burnetii-infected WT and STINGgt/gt BMDMs at 12 dpi. Representative scatter plots from three independent experiments are shown. H Percentage of caspase-8 positive WT and STINGgt/gt BMDMs during C. burnetii infection at 12 dpi. Data are representative of three biological replicates from three independent experiments. Error bars, SEM. Unpaired T-test, ***p < 0.001. I Caspase-3 and caspase-8 activation in mock- or C. burnetii-infected WT and STINGgt/gt BMDMs was determined by western blot at 12 dpi. Blots are representative of three independent biological replicates.
Fig. 4
Fig. 4. Elevated STING levels during C. burnetii infection induce mitochondria-mediated apoptosis through the BAX-IRF3 pathway.
A qPCR of Tmem173 (Sting) from mock- or C. burnetii-infected WT BMDMs at 12 dpi. Data are representative of four biological replicates each of 5 × 105 cells per well of each genotype from three independent experiments. Error bars, SEM. Unpaired T-test, ***p < 0.001. B STING protein levels in mock- or C. burnetii-infected WT and STINGgt/gt BMDMs was determined by western blot at 12 dpi. C Western blot analysis of WT BMDMs treated with IFNβ to probe STING and ISG15 levels. D Bacterial load in WT BMDMs measured as genomic equivalents (GE) in presence and absence of IFNβ (10 IU/ml). Data are representative of three biological replicates of 2 × 105 cells per well of each genotype from three independent experiments. Error bars, SEM. Unpaired T-test, ***p < 0.001. E Fluorescent micrographs showing localization of STING (yellow) in mock- or mCherry-C. burnetii (magenta)-infected WT and STINGgt/gt BMDMs, counterstained with DAPI (cyan), at 12 dpi. The micrographs are representative of at least three independent experiments. F Western blot analysis of STING signaling components in mock- or C. burnetii-infected WT and STINGgt/gt BMDMs using the indicated antibodies at 12 dpi. G Schematic for cell fractionation for mock- and C. burnetii-infected L929 cells at 12 dpi treated with vehicle or H-151. H Western blot analysis of BAX, IRF3, and COX-IV from purified mitochondrial fractions. I Western blot analysis of STING, cytochrome c, and BAX from purified cytosolic fractions. J Western blot analysis of STING in purified microsomal fractions. K Western blot analysis of IRF3 and Histone H3 in purified nuclear fractions. All blots are representative of three independent experiments.
Fig. 5
Fig. 5. Subcellular localization of STING and it’s signaling partners during C. burnetii infection.
A Micrographs show colocalization of IRF3 (magenta) and BAX (yellow) in mock- or C. burnetii-infected WT and STINGgt/gt BMDMs. The micrographs are representative of at least three independent experiments. Pearson’s correlation coefficient for localization overlap is shown on the zoomed micrograph. B The micrographs show colocalization of BAX (yellow) and Mitotracker (magenta) mitochondria staining in mock- or C. burnetii-infected WT and STINGgt/gt BMDMs. The micrographs are representative of at least three independent experiments. Pearson’s correlation coefficient for localization overlap is shown on the zoomed micrograph. C Western blot analysis using the indicated antibodies following immunoprecipitation of IRF3 from mock- or C. burnetii-infected L929 cells treated with vehicle or H-151 or DMXAA. All blots are representative of three independent experiments.
Fig. 6
Fig. 6. STING-dependent mitochondrial damage during C. burnetii infection.
A Fluorescence micrographs exhibiting mitochondrial potential of mock- and C. burnetii-infected WT and STINGgt/gt BMDMs using JC-1 dual fluorescence mitochondrial dye at 12 dpi. Mitochondria with normal polarization show dye aggregate (magenta) and depolarized mitochondria show dye monomer (yellow). The micrographs are representative of three independent experiments. B Quantitation of fluorescence in (A) using ratios of yellow (low membrane potential) to magenta (high membrane potential). Depolarization of mitochondria is shown by the increase in the ratio of yellow to magenta. The micrographs are representative of three independent experiments. C Fluorescence micrographs of H2DCFDA (yellow) for reactive oxygen species (ROS) of mock- and mCherry-C. burnetii (magenta)-infected WT and STINGgt/gt BMDMs at 12 dpi. The micrographs are representative of three independent experiments. D Quantitation of fluorescence in (C). E Fluorescence micrographs of Fluo-4 NW (magenta) for calcium ion detection mock- and mCherry-C. burnetii-infected WT and STINGgt/gt BMDMs at 12 dpi. F Quantitation of fluorescence in (E). G Western blot showing mitochondria-mediated apoptosis pathway activation in mock- and C. burnetii-infected WT and STINGgt/gt BMDMs using the indicated antibodies. Blots are representative of at least three independent experiments. In (B), (D) and (F) data are representative of three biological replicates from two independent experiments. Error bars, SEM. Unpaired T-test, **p < 0.01.
Fig. 7
Fig. 7. mtDNA detection in the cytosol of C. burnetii-infected BMDMs.
A qPCR analysis of total cellular mtDNA (D-loop) normalized to total nuclear gene (Tert) in mock- and C. burnetii-infected WT and STINGgt/gt BMDMs at 12 dpi. B qPCR analysis of cytosolic mtDNA gene (D-loop) normalized to total cellular nuclear gene (Tert) in mock- and C. burnetii-infected WT and STINGgt/gt BMDMs at 12 dpi. C qPCR analysis of the C. burnetii gene (DotA) in whole cell lysate normalized to nuclear gene (Tert) from C. burnetii-infected WT and STINGgt/gt BMDMs at 12 dpi. D qPCR analysis of cytosolic C. burnetii gene (DotA) normalized to whole cell lysate nuclear gene (Tert) from infected C. burnetii-WT and STINGgt/gt BMDMs at 12 dpi. E 2′-3′ cGAMPs were detected in mock- and C. burnetii-infected WT and STINGgt/gt BMDMs at 12 dpi using the BioSTING-FRET assay. In (AE) data are representative of four biological replicates from three independent experiments. Error bars, SEM. Unpaired T-test, *p < 0.05, **<0.01.
Fig. 8
Fig. 8. STING activation is mediated by cGAS during C. burnetii infection.
A Bacterial load in WT and cGAS−/− BMDMs at 12 dpi measured as genomic equivalents (GE) in the presence and absence of the pharmacological STING activator DMXAA (25 μg/ml). Data are representative of three biological replicates of 2 × 105 cells per well of each genotype from at least three independent experiments. Error bars, SEM. Unpaired T-test, ***p < 0.001. B Fluorescent micrographs of mCherry-C. burnetii-infected (magenta) WT and cGAS−/− BMDMs at 12 dpi, Hoechst 33342 (cyan) nuclear staining, and SYTOX (yellow) staining to detect dead cells. C Percentage of SYTOX-positive WT and cGAS−/− BMDMs during C. burnetii infection at 12 dpi. Data are representative of three different fields of view from three independent experiments. Error bars, SEM. Unpaired T-test, **p < 0.01. D Western blot analysis of STING signaling components and caspases in mock- or C. burnetii-infected WT and cGAS−/− BMDMs using the indicated antibodies at 12 dpi. Blots are representative of three independent experiments.
Fig. 9
Fig. 9. Model for STING mediated IRF3/BAX induced apoptosis during C. burnetii infection.
Initial priming from C. burnetii DNA (i) activates STING signaling (ii) leading to its localization to ERGIC where phosphorylation of TBK1 and IRF3 occurs (iii). Activated IRF3 translocate to the nucleus to active type I IFNs and cytokines (iv). Cytosolic IRF3 complexes with BAX (v) stimulating its translocation to the mitochondrial membrane (vi) causing its depolarization (vii). mtDNA (viii) and cytochrome c (ix) leak out due to the mitochondrial damage. Cytosolic mtDNA then gets converted into 2′-3′ cGAMP by cGAS (i) making a positive feedback loop to intensify STING signaling causing more mitochondrial damage elevating intracellular reactive oxygen species and calcium levels (x). The cytochrome c in the cytosol activates caspase-9 (xi) which in turn cleaves procaspase 3 to activate caspase-3 (xii) leading to apoptosis.

Similar articles

Cited by

References

    1. Janeway CA, Medzhitov R. Innate immune recognition. Annu Rev Immunol. 2002;20:197–216. doi: 10.1146/annurev.immunol.20.083001.084359. - DOI - PubMed
    1. Akira S, Uematsu S, Takeuchi O. Pathogen recognition and innate immunity. Cell. 2006;124:783–801. doi: 10.1016/j.cell.2006.02.015. - DOI - PubMed
    1. Bianchi ME. DAMPs, PAMPs and alarmins: all we need to know about danger. J Leukoc Biol. 2007;81:1–5. doi: 10.1189/jlb.0306164. - DOI - PubMed
    1. Barbalat R, Ewald SE, Mouchess ML, Barton GM. Nucleic acid recognition by the innate immune system. Annu Rev Immunol. 2011;29:185–214. doi: 10.1146/annurev-immunol-031210-101340. - DOI - PubMed
    1. Yang D, Han Z, Oppenheim JJ. Alarmins and immunity. Immunol Rev. 2017;280:41–56. doi: 10.1111/imr.12577. - DOI - PMC - PubMed

Publication types