. 2024 Mar 8;15(1):2132.
doi: 10.1038/s41467-024-46283-y.

GRB2 stabilizes RAD51 at reversed replication forks suppressing genomic instability and innate immunity against cancer

Affiliations

GRB2 stabilizes RAD51 at reversed replication forks suppressing genomic instability and innate immunity against cancer

Zu Ye et al. Nat Commun. .

Abstract

Growth factor receptor-bound protein 2 (GRB2) is a cytoplasmic adapter for tyrosine kinase signaling and a nuclear adapter for homology-directed-DNA repair. Here we find nuclear GRB2 protects DNA at stalled replication forks from MRE11-mediated degradation in the BRCA2 replication fork protection axis. Mechanistically, GRB2 binds and inhibits RAD51 ATPase activity to stabilize RAD51 on stalled replication forks. In GRB2-depleted cells, PARP inhibitor (PARPi) treatment releases DNA fragments from stalled forks into the cytoplasm that activate the cGAS-STING pathway to trigger pro-inflammatory cytokine production. Moreover in a syngeneic mouse metastatic ovarian cancer model, GRB2 depletion in the context of PARPi treatment reduced tumor burden and enabled high survival consistent with immune suppression of cancer growth. Collective findings unveil GRB2 function and mechanism for fork protection in the BRCA2-RAD51-MRE11 axis and suggest GRB2 as a potential therapeutic target and an enabling predictive biomarker for patient selection for PARPi and immunotherapy combination.


Conflict of interest statement

The authors declare no competing interests.

Figures
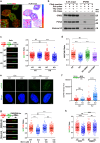
Fig. 1
Fig. 1. GRB2 at the DNA replication fork inhibits MRE11 mediated fork-degradation.
a FLIM/FRET showing GRB2-PCNA direct interaction within an apparent PCNA replication focus. Colocalization shown in the left, while false colored lifetime image on the right generated by pixel-by-pixel mapping of the measured lifetime-values represented by the scale 1.7–2.2 nanoseconds. Scale bar 25 μm (b) iPOND assay showing GRB2 association with replication DNA, and enriched on the nascent DNA in response replication stress. PCNA was used as a positive control. c Enhanced fork degradation in GRB2-depleted HeLa cells under replication stress. d An independent set of experiments with GRB2 reconstitution. Only WTGRB2 (KO + GRB2), but not the K109R mutant alleviated replication stress induced fork degradation in GRB2-depleted HeLa cells. Radiometric analysis of ≥200 fibers, n = 3. e Replication stress induced increased ssDNA in GRB2-depleted cells under replication stress indicating enhanced nuclease activity in HeLa cells. Scale bar 10 μm. f Quantitation of the ssDNA intensities from three independent experiments represented in (e), intensities of 100–300 foci, n = 3. g Fork degradation is inhibited by MRE11 nuclease inhibitor Mirin in HeLa cells lacking GRB2 and under replication stress. h MRE11knockddown prevents fork degradation in GRB2-deplered HeLa cells under replication stress. Fiber assay radiometric analysis of ≥ 200 fibers, n = 3 in (c, d, fh). The significance was analyzed by two-sided Student’s t test. ***P ≤ 0.001, and ****P ≤ 0.0001; NS not significant. Error bars showing standard deviations (SD). For (bd) and (fh), source data are provided as a Source Data file.
Fig. 2
Fig. 2. Inhibition of fork reversal rescues fork degradation in GRB2 deficient cells.
a Overexpression of BRC4 has no further fork degradation effect on GRB2 deficient cells. b BRCA2 knockdown has no further fork degradation effect on GRB2 deficient cells. c Knockdown of HTLF, SMARCAL1 or ZRANB3 is sufficient to alleviate replication fork degradation in GRB2-depleted cells. d Knockdown of RAD51 rescues the observed fork degradation in GRB2-depleted cells. e Overexpression of K133R ATPase deficient mutant RAD51 is sufficient to prevent fork degradation in GRB2-depleted HAP1 cells. f Western blot analysis showing the expression of K133RRAD51 mutant in WT and GRB2 KO HAP1 cells using anti-Flag antibody. Antibody targeting GRB2 was used to distinguish WT from GRB2 KO cells. Beta-Actin serves as a loading control. In (ae), radiometric analysis of ≥200 fibers, n = 3. The significance was analyzed by two-sided Student’s t test. *P ≤ 0.05, **P ≤ 0.01, ***P ≤ 0.001, and ****P ≤ 0.0001; NS, not significant. Error bars showing standard deviations (SD). For (af), source data are provided as a Source Data file.
Fig. 3
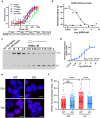
Fig. 3. GRB2 promotes reverse fork stability by inhibiting RAD51 ATPase activity.
a RAD51 interacts with the SH2 domain of GRB2. MST binding isotherms measuring binding affinity of RAD51 with wild type GRB2, SH2 domain and indicated GRB2 mutant. The binding affinities (Kds) mean values with ±SD are shown below, n = 3. b ATPase activity assay showing GRB2 dose-dependent inhibition of RAD51 ATP-hydrolysis with ±SD, n = 3. c Representative gel-image showing GRB2 dose dependent RAD51 strand-stabilization to dsDNA with 5′ overhang. d Normalized quantitation of RAD51 strand exchange and stability induced by GRB2 with ±SD, n = 3. e Representative PLA images of RAD51 foci formation with ssDNA. f Quantitation of nascent DNA associated RAD51 collected from >350, n = 3. Scale bar 10 μm. The significance was analyzed by two-sided Student’s t test. ****P ≤ 0.0001; NS not significant. For ad and f source data are provided as a Source Data file.
Fig. 4
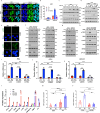
Fig. 4. PARPi induced DNA replication stress in GRB2 depleted cells cause genomic instability, cytoplasmic DNA accumulation resulting in cGAS/STING activation and chemoattractant secretions.
a Representative PicoGreen and DAPI staining after 10 μM Olaparib treatment for 48 h and the resulting cytoplasmic micronuclei formation in HAP-1 cells. Scale bar 10 μm (b) Quantitation of cytoplasmic micronuclei form three independent experiments with ±SD. c A comparison and time-course of Olaparib (10 μM) induced TBK-1 and IRF-3 phosphorylation between control and GRB2-KO HeLa cells. d GRB2 re-expression in GRB2-KO HeLa cells suppressed Olaparib (10 μM, 48 h) induced TBK-1 and IRF-3 phosphorylation. e Representative immunofluorescence images showing olaparib (10 μM, 48 h) treatment induces nuclear accumulation of phosphorylated IRF-3 (pIRF-3) in GRB2-KO HeLa cells. Scale bar 10 μm. f The increased TBK-1 and IRF-3 phosphorylation observed in GRB2-KO HeLa cells are independent of RAS (PD184352; left panels) or Akt (MK2206; right panels) signaling. g The increased TBK-1 and IRF-3 phosphorylation in GRB2-KO HeLa cells are MRE11 dependent, n = 3. h STING knockdown is sufficient to abrogate Olaparib (10 μM) induced TBK-1 and IRF-3 phosphorylation in GRB2-KO HeLa cells. n = 3. i The increased TBK-1 and IRF-3 phosphorylation in GRB2-KO HeLa cells are STING dependent, n = 3. ik qRT-PCR showing Olaparib induce increased level of INF-B, CCL5 and CXCL-10 mRNA in HeLa cells with ±SD, n = 3. l Quantitation of cytokines array results from two independent experiments showing upregulated inflammatory cytokine released in culture medium with olaparib treatment, n = 2. m Recruitment of cytotoxic CD8 + T-lymphocytes (CTL) isolated from PBMC to GRB2-KO HeLa cells in response to Olaparib treatment, n = 3, ±SD are shown. n siRNA mediated STING knockdown in GRB2-KO HeLa cells abrogate PBMC isolated CD8 + CTL recruitment, n = 3, errors are in ±SD. The significance was analyzed by two-sided Student’s t test. *P ≤ 0.05, **P ≤ 0.01, ***P ≤ 0.001, and ****P ≤ 0.0001; NS not significant. For (bn), source data are provided as a Source Data file.
Fig. 5
Fig. 5. GRB2 depletion sensitizes cells to PARPi.
a A schematic experimental overview for monitoring cancer growth with luciferase imaging. Below, Representative images of luciferase expression ID8 cells detected on day-7 and day-28. Talazoparib (0.33 mg/kg) treated control and GRB2-KD mice are only shown. b Quantitative luciferase signal detection using IVIS imaging for n = 5 mice per group up to 28 days, the mean with ±SD are shown. c Kaplan–Myer curve showing survival of mice in the four-treatment group. d The measurements of Ascites volume n = 4 mice all 4 treatment groups, the mean with ±SD are shown. e, f Measurement of mouse IL-2 level and IL-12 in the Ascites fluids of n = 4 mice, the mean with ±SD are shown. The significance was analyzed by two-sided Student’s t test. *P ≤ 0.05, **P ≤ 0.01 and ***P ≤ 0.001; NS not significant. For (bf), source data are provided as a Source Data file.

References

    1. Chardin P, et al. Human Sos1: a guanine nucleotide exchange factor for Ras that binds to GRB2. Science. 1993;260:1338–1343. doi: 10.1126/science.8493579. - DOI - PubMed
    1. Gale NW, Kaplan S, Lowenstein EJ, Schlessinger J, Bar-Sagi D. Grb2 mediates the EGF-dependent activation of guanine nucleotide exchange on Ras. Nature. 1993;363:88–92. doi: 10.1038/363088a0. - DOI - PubMed
    1. Kouhara H, et al. A lipid-anchored Grb2-binding protein that links FGF-receptor activation to the Ras/MAPK signaling pathway. Cell. 1997;89:693–702. doi: 10.1016/S0092-8674(00)80252-4. - DOI - PubMed
    1. Lowenstein EJ, et al. The SH2 and SH3 domain-containing protein GRB2 links receptor tyrosine kinases to ras signaling. Cell. 1992;70:431–442. doi: 10.1016/0092-8674(92)90167-B. - DOI - PubMed
    1. Cheng AM, et al. Mammalian Grb2 regulates multiple steps in embryonic development and malignant transformation. Cell. 1998;95:793–803. doi: 10.1016/S0092-8674(00)81702-X. - DOI - PubMed