. 2024 Mar 8;15(1):2144.
doi: 10.1038/s41467-024-46415-4.

PMI-controlled mannose metabolism and glycosylation determines tissue tolerance and virus fitness

Affiliations

PMI-controlled mannose metabolism and glycosylation determines tissue tolerance and virus fitness

Ronghui Liang et al. Nat Commun. .

Abstract

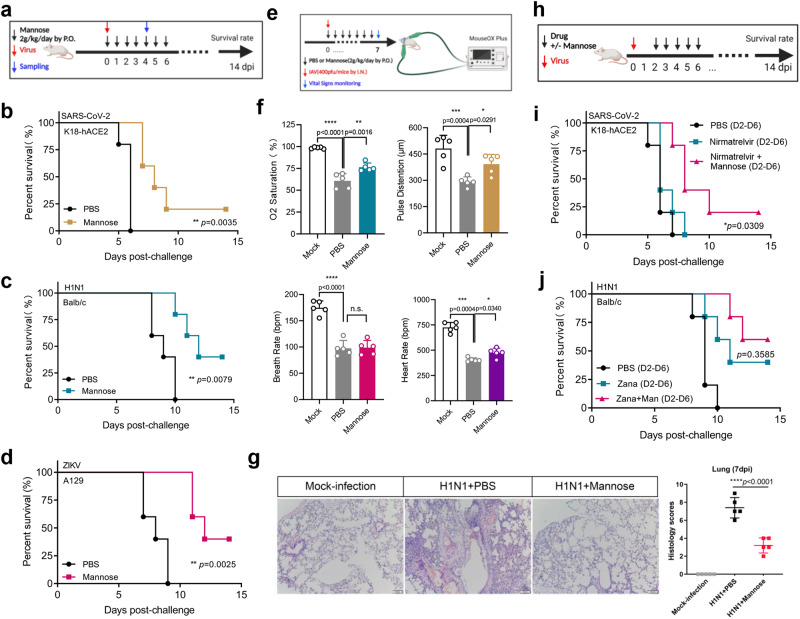
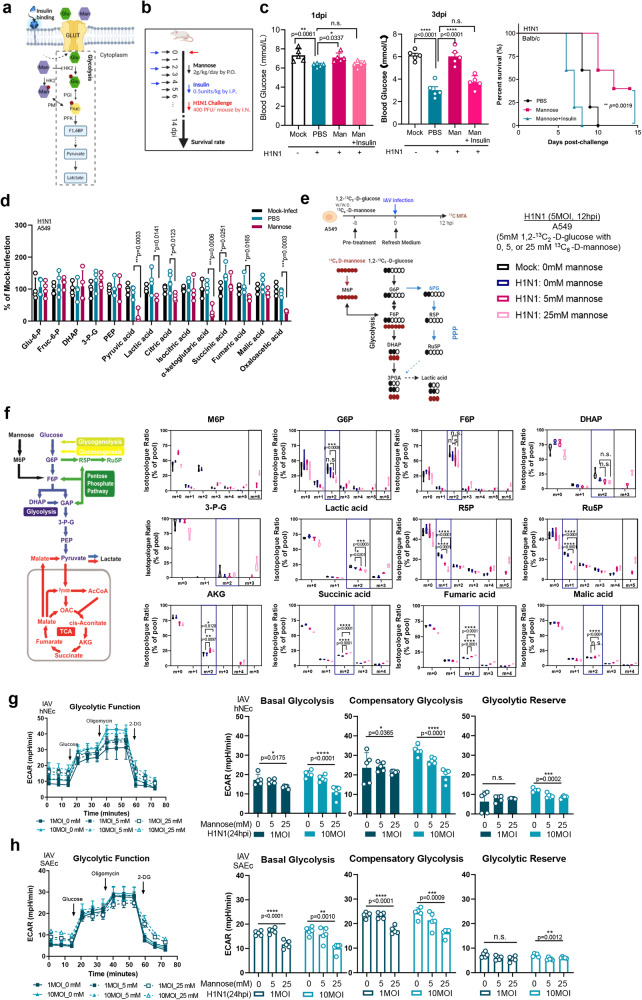
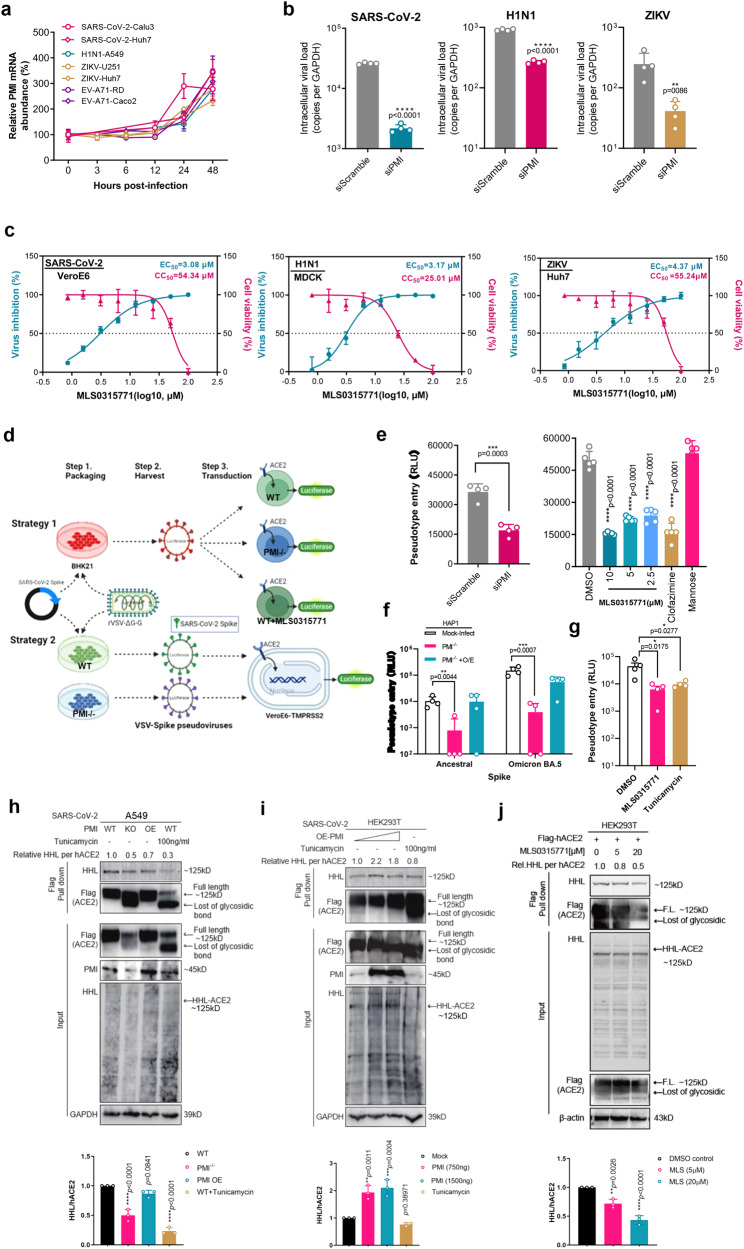
Host survival depends on the elimination of virus and mitigation of tissue damage. Herein, we report the modulation of D-mannose flux rewires the virus-triggered immunometabolic response cascade and reduces tissue damage. Safe and inexpensive D-mannose can compete with glucose for the same transporter and hexokinase. Such competitions suppress glycolysis, reduce mitochondrial reactive-oxygen-species and succinate-mediated hypoxia-inducible factor-1α, and thus reduce virus-induced proinflammatory cytokine production. The combinatorial treatment by D-mannose and antiviral monotherapy exhibits in vivo synergy despite delayed antiviral treatment in mouse model of virus infections. Phosphomannose isomerase (PMI) knockout cells are viable, whereas addition of D-mannose to the PMI knockout cells blocks cell proliferation, indicating that PMI activity determines the beneficial effect of D-mannose. PMI inhibition suppress a panel of virus replication via affecting host and viral surface protein glycosylation. However, D-mannose does not suppress PMI activity or virus fitness. Taken together, PMI-centered therapeutic strategy clears virus infection while D-mannose treatment reprograms glycolysis for control of collateral damage.


Conflict of interest statement

The authors declare no competing interests.

Figures

Fig. 1
Fig. 1. Mannose renders protection against different viral diseases by enhancing tissue tolerance.
a Experimental design of using mannose monotherapy in three virus disease models. Mice were treated with 2 g/kg/day of mannose or PBS by oral administration (P.O.) from day0 until 6dpi. The survival rates were monitored daily until 14dpi. b Survival rate of SARS-CoV-2-infected K18-hACE2 transgenic mice (2 × 102 PFU/mouse, n = 5). c Survival rate of mouse-adapted influenza A H1N1 virus-infected BALB/c mice (4 × 102 PFU/mouse, n = 5). d Survival rate of ZIKV-infected A129 mice (1 × 106 PFU/mouse, n = 5). e Schematic design showing the measurement of vital signs in H1N1-infected mice. f Comparison of vital signs among the indicated groups (n = 5 mice per group). g Representative mouse lung histopathological changes on 7dpi. Semiquantitative histology scores were given to each lung tissue (n = 5 mice per group). h Experimental design of using mannose combinatorial therapy in delayed treatment setting. K18-hACE2 transgenic mice were challenged with 2 × 102 PFU SARS-CoV-2 per mouse, while Balb/c mice were challenged with 4 × 102 PFU H1N1 per mouse, at 0dpi. Virus-infected mice were treated with 2 g/kg/day of mannose from 2dpi to 6dpi, with or without antiviral-treatment (i.e., zanamivir or nirmatrelvir). The survival rates were monitored daily until 14dpi. i Survival rate of SARS-CoV-2-infected mice with combinational treatment of nirmatrelvir (20 mg/kg/day) and mannose (2 g/kg/day) from 2dpi to 6dpi. The mice receiving PBS treatment or nirmatrelvir alone were taken as controls (n = 5). j Survival rate of H1N1-infected mice with combinational treatment of zanamivir (50 mg/kg/day, I.P.) and mannose (2 g/kg/day, P.O.) from 2dpi to 6dpi. The mice receiving PBS treatment or zanamivir alone were taken as controls (n = 5). All the results are shown as mean ± SD. Comparison of survival rates between groups were analyzed using Log-rank (Mantel–Cox) tests for (b, c, d, i, j). One-way ANOVA with Dunnett’s post hoc test was used for (f, g). ****P < 0.0001, ***P < 0.001, **P < 0.01, *P < 0.05, and n.s. indicates non-significant. Panels (a, e, h) were created with BioRender.com.
Fig. 2
Fig. 2. Mannose affects host glucose metabolism and mitochondrial respiration.
a Schematic illustration of the roles of mannose (Man) and glucose (Glu) in the glycolysis pathway. Mannose enters glycolysis with the common GLUT family and acts as competitor of glucose for hexokinase (HK) enzyme HK2, first being converted to mannose-6-phosphate that is then isomerized to produce fructose-6-phosphate by Mannose-6-phosphate isomerase (PMI) enzyme. b Experimental design showing the co-administration of insulin and mannose after H1N1 infection. c Left panel: measurement of blood glucose of H1N1-infected BALB/c mice (n = 5 mice per group) at 1dpi and 3dpi, respectively. Right panel: survival rate of H1N1-infected and mannose-treated BALB/c mice with or without insulin administration (0.5 units/kg, I.P.). d Metabolomic profile of H1N1-infected human lung epithelial A549 cell after mannose treatment (n = 4 biological repeats). A549 cells were pre-treated with mannose (25 mM) or PBS overnight, followed by H1N1 infection (2MOI) for another 12 h before targeted metabolomics analysis of glycolysis and tricarboxylic acid (TCA) cycle. The results were normalized by cell number. e Schematic of 1,2-13C2-D-glucose and 13C6-D-mannose labeling of carbon atoms in glycolysis intermediates arising from glucose metabolism, pentose phosphate pathway (PPP), and TCA cycle. f Extraction of intracellular metabolites and measurement of their mass isotopologue distribution (MID). Isotopologue ratio of the indicated metabolite was measured and normalized to the pool of relevant metabolite, respectively (n = 5 biological repeats). g Human primary nasal epithelial cells (hNEc) and (h) human primary Small Airway Epithelial cells (SAEc) were pre-treated with 0 mM, 5 mM, or 25 mM mannose overnight before virus infection for another 12 h. Cells were analyzed using a Seahorse XF analyzer to determine the extracellular acidification rate (ECAR). The ECAR data were normalized using Hoechst 33342 nucleic acid stain to quantify the number of live cells (n = 5 biological repeats). All the results are shown as mean ± SD. Comparison of survival rates between groups were analyzed using Log-rank (Mantel–Cox) tests for (c). One-way ANOVA with Dunnett’s post hoc test was used for (c, f, g, h). ****P < 0.0001, ***P < 0.001, **P < 0.01, *P < 0.05, and n.s. indicates non-significant. Panels (a, b, e, f) were created with BioRender.com.
Fig. 3
Fig. 3. Mannose rewires virus-induced mitochondrial dysfunction and inflammatory dysregulation.
a Human primary hNEc and (b) SAEc cells were analyzed the oxygen consumption rates of mitochondria after H1N1 infection and mannose treatment (n = 4 biological repeats). c Human PBMCs were treated with mannose in the indicated concentration for overnight. After treatment, cells were collected and stained with fluorescently labeled antibodies specific for B cell surface markers CD1d before flow cytometry analysis (n = 3 independent donors). d Transcriptomic analysis of H1N1-infected A549 cells suggests decreased inflammatory response whereas enhanced tolerance induction after mannose treatment. Gene set enrichment analysis enrichment plots of the most significant target classes are shown. e Schematic illustration showing the glycolysis/succinate/HIF-1α/ IL-1β axis that mannose interferes with. f The succinic acid level in the supernatant of H1N1-infected cells were determined (n = 4 biological repeats). g The HIF-1α protein expression after mannose treatment was assessed by western blotting in SARS-CoV-2-infected Calu3 cells (0.1 MOI, 24hpi) and H1N1-infected A549 cells (0.1 MOI, 24hpi), respectively. h The mitochondrial membrane potential of H1N1-infected cells were analyzed by flow cytometry after JC-1 dye staining (n = 4 biological repeats). i Experimental design showing the investigation of in vivo inflammation response after oral mannose treatment. H1N1 (400PFU) infected and mannose-treated BALB/c mice were sacrificed on 4dpi for downstream analysis. j The IL-1β amount in the bronchoalveolar lavage (BAL) fluid of mice (n = 4 mice per group) were determined by ELISA. k The amount of succinic acid in mouse lung homogenates (n = 4 mice per group) were detected by ELISA. l The reactive oxygen species (ROS) intensity in the mouse lung were stained with three specific dyes for superoxide. Shown are representative images randomly selected from a pool of images for each group (n = 4 mice/group). The results are qualified as O-2, ONOO-, and ON positive cells per mm3 in four randomly selected areas, respectively. All the results are shown as mean ± SD. One-way ANOVA with Dunnett’s post hoc test was used for (a, b, c, f, g, h, j, k, l). ****P < 0.0001, ***P < 0.001, **P < 0.01, *P < 0.05, and n.s. indicates non-significant. Left part of (d), and (e), and (i) were created with BioRender.com.
Fig. 4
Fig. 4. The beneficial effect of mannose is PMI dependent.
a Growth curves of A549-wildtype (WT) and knockout (PMI-/-) cells supplemented with 0, 5, or 25 mM of mannose (n = 4 biological repeats). b Bioenergetic profiles of H1N1-infected WT and PMI-/- cells supplemented with or without mannose (25 mM) treatment. Cells were pre-treated with mannose overnight before virus infection for another 12 h. Glycolytic rate of the cells were analyzed using a Seahorse XF analyzer by measuring the glycoPER kit (n = 5 biological repeats). c Mitochondrial respiration of the cells was analyzed using a Seahorse XF analyzer by measuring the oxygen consumption rates (OCR, n = 5 biological repeats). d Either PMI overexpression (O/E) or supplement of PMI metabolite Fructose-6-phosphate (F6P) antagonize the suppression of low mitochondrial membrane potential (MMP) by mannose. A549 cells were pre-treated with the indicated treatment for overnight before H1N1 infection (MOI = 2). After 12 h, cells were subject to MMP analysis after JC-1 staining (n = 3 biological repeats). e Dual PMI depletion and mannose treatment is unfavorable whereas supplement of F6P reverses the mitochondrial damage. A549-WT and PMI–/– cells were pre-treated with the indicated treatment, followed by H1N1 infection and MMP measurement after JC-1 staining (n = 3 biological repeats). f MMP assay by TMRE Staining. hBTEC (left panel) and A549 cells (right panel) were pre-incubated with the indicated treatment for 12 h before H1N1 virus infection (MOI = 0.2). Cells were subject to TMRE (200 nM) staining for 20 min, and DAPI staining for normalization. The fluorescence intensities were detected by a plate reader, whereas the images were captured by GE IN Cell Analyzer 6500HS (n = 3 biological repeats). g Knockout of PMI impair the modulatory activity of mannose against IL-1β production. The experiments were performed in WT and PMI–/– cells transfected with PMI plasmid and/or Poly(I:C) as indicated (n = 3 biological repeats). All the results are shown as mean ± SD. One-way ANOVA with Dunnett’s post hoc test was used for (a, d, e). Unpaired and two-sided student’s T test was used for (f, g). ****P < 0.0001, ***P < 0.001, **P < 0.01, *P < 0.05, and n.s. indicates non-significant.
Fig. 5
Fig. 5. PMI affects virus entry via modulation of protein glycosylation.
a Time-dependent monitoring of PMI gene expression after virus infection. PMI mRNA was determined by RT-qPCR in indicated virus-infected cell models (all with 1MOI) (n = 4 biological repeats). b siRNA knockdown of PMI decreased viral replication in H1N1-infected A549 cells (0.1MOI, 24hpi), SARS-CoV-2-infected Caco2 cells (0.1MOI, 24hpi), and ZIKV-infected Huh7 cells (0.1MOI, 48hpi) (n = 4 biological repeats). c The PMI inhibitor MLS0315771 inhibits the replication of a panel of viruses including H1N1-infected MDCK cells (0.01 MOI, 24hpi), SARS-CoV-2-infected VeroE6 cells (0.01 MOI, 24hpi), and ZIKV-infected Huh7 cells (0.1 MOI, 48hpi) (n = 3 biological repeats). d Schematic illustration showing two strategies of SARS-CoV-2 spike-mediated entry measurement. e PMI inhibition either by siRNA knockdown or by inhibitor MLS0315771 reduced SARS-CoV-2 pseudovirus entry in HEK293T-ACE2 cells (strategy 1) (n = 4 biological repeats). f Overexpression (O/E) of PMI rescued SARS-CoV-2 entry (strategy 2). Both WT and Omicron BA.5 pseudovirus were examined (n = 4 biological repeats). g Addition of Tunicamycin (2 µg/ml) or MLS0315771 (5 µM) to HEK293T cells during packaging of pesudotyped SARS-CoV-2 decreased its entry efficacy VeroE6-TMPRSS2 cells (strategy 2) (n = 4 biological repeats). h PMI mediates high mannose-type N-glycosidic (HHL) glycosylation of host ACE2. After SARS-CoV-2 infection (0.1MOI, 24hpi) and pull-down experiment, full spectrum of host HHL glycosylation process particularly hACE2 were analyzed by Western blot and lectin blot analyses (n = 3 biological repeats). i Overexpression of PMI increased the hACE2 glycosylation. HEK293T cells were transfected with increasing concentrations of exogenous PMI plasmids followed by SARS-CoV-2 infection and analysis of hACE2 N- glycosylation as described in (h). j The PMI inhibitor MLS0315771 decreased the hACE2 glycosylation. HEK293T cells were transfected with hACE2 constructs and treated with MLS0315771 for 24 h before analysis of hACE2 N- glycosylation as described in (h) (n = 3 biological repeats). All the results are shown as mean ± SD. Unpaired two-sided student’s T test was used for figure (b, e) (left panel). One-way ANOVA with Dunnett’s post hoc test was used for (e) (right part), (f, g, h, i, j). ****P < 0.0001, ***P < 0.001, **P < 0.01, *P < 0.05, and n.s. indicates non-significant. Panel (d) was created with BioRender.com.
Fig. 6
Fig. 6. Proposed model of PMI-mediated glycolysis reprogramming and glycosylation to affect tissue tolerance and virus fitness.
Virus infection triggers heightened energetic demand including increased glucose influx and upregulated glycolysis. Mannose antagonizes such process by completing with glucose for glucose translocation across the cell membrane (GLUT), as well as for hexokinase enzyme (HK2) that are critically required during glycolysis. Consequently, this metabolic reprogramming by mannose normalizes the mitochondrial dysfunction as evidenced by heightened membrane potential and reactive oxygen species. It also reverses the abnormally high production of succinate from TCA cycle, HIF-1α activation and induction of overwhelming IL-1β that causing tissue damage. PMI is a gatekeeper that determines it is beneficial or unfavorable during glycolysis remodeling after mannose supplement. PMI can be also taken as a druggable target that affects a panel of virus entry. Mechanistically, PMI contributes to both host ACE2 and virus spike glycosylation thus controls SARS-CoV-2 entry. Created with BioRender.com.

Similar articles

Cited by

References

    1. Figueiredo N, et al. Anthracyclines induce DNA damage response-mediated protection against severe sepsis. Immunity. 2013;39:874–884. doi: 10.1016/j.immuni.2013.08.039. - DOI - PMC - PubMed
    1. Larsen R, et al. A central role for free heme in the pathogenesis of severe sepsis. Sci. Transl. Med. 2010;2:51ra71. doi: 10.1126/scitranslmed.3001118. - DOI - PubMed
    1. Yuan S, et al. SREBP-dependent lipidomic reprogramming as a broad-spectrum antiviral target. Nat. Commun. 2019;10:120. doi: 10.1038/s41467-018-08015-x. - DOI - PMC - PubMed
    1. Yuan S, et al. SARS-CoV-2 exploits host DGAT and ADRP for efficient replication. Cell Discov. 2021;7:100. doi: 10.1038/s41421-021-00338-2. - DOI - PMC - PubMed
    1. Codo AC, et al. Elevated glucose levels favor SARS-CoV-2 infection and monocyte response through a HIF-1alpha/glycolysis-dependent axis. Cell Metab. 2020;32:437–446 e435. doi: 10.1016/j.cmet.2020.07.007. - DOI - PMC - PubMed