. 2024 Mar 8;15(1):2133.
doi: 10.1038/s41467-024-46560-w.

Antiviral responses induced by Tdap-IPV vaccination are associated with persistent humoral immunity to Bordetella pertussis

Affiliations

Antiviral responses induced by Tdap-IPV vaccination are associated with persistent humoral immunity to Bordetella pertussis

Joshua Gillard et al. Nat Commun. .

Abstract

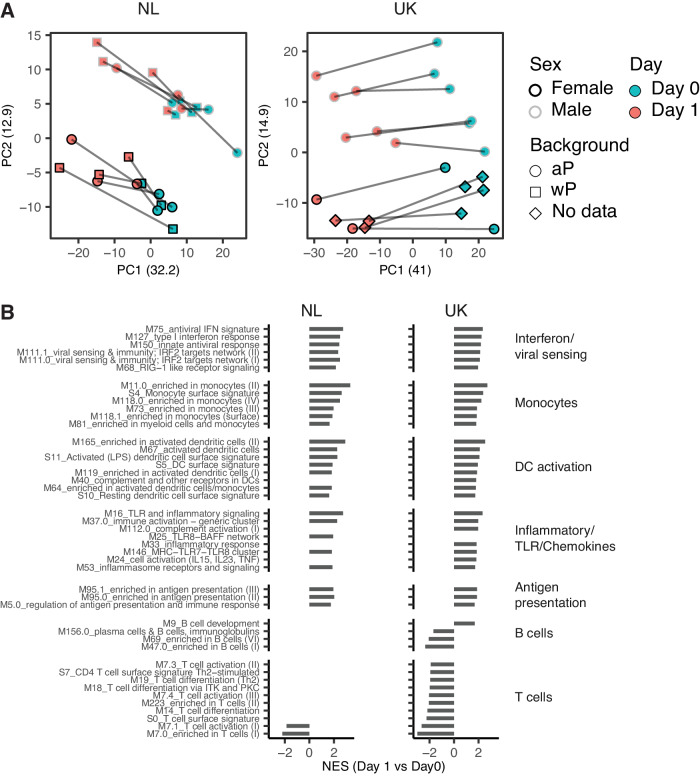
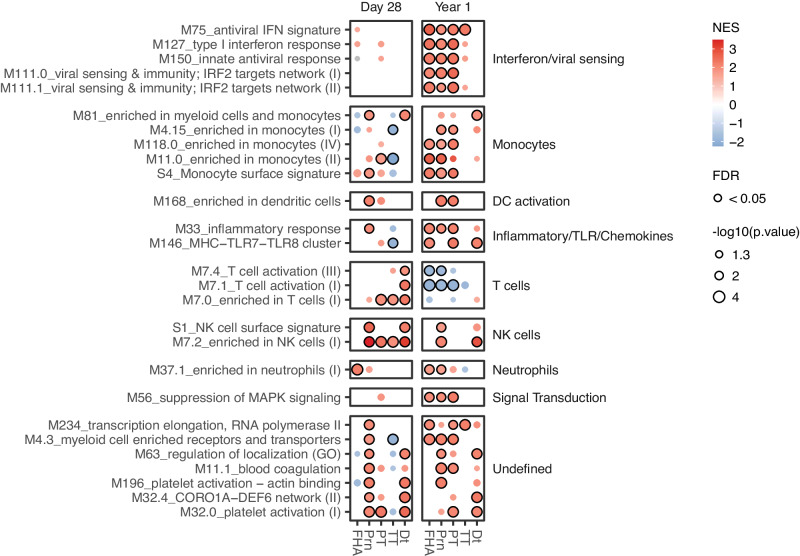
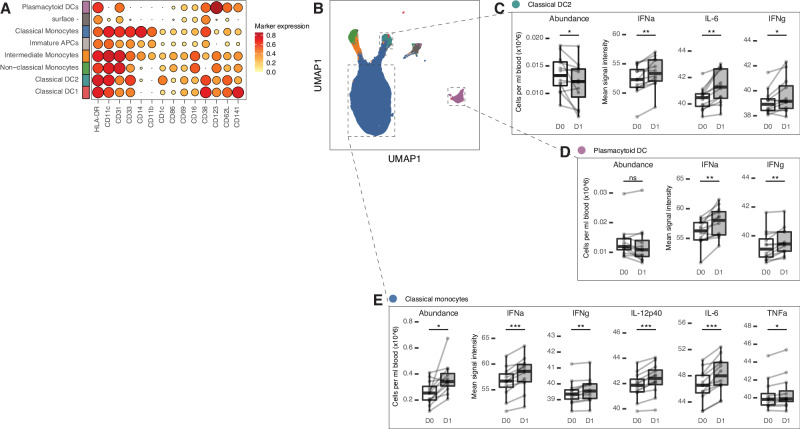
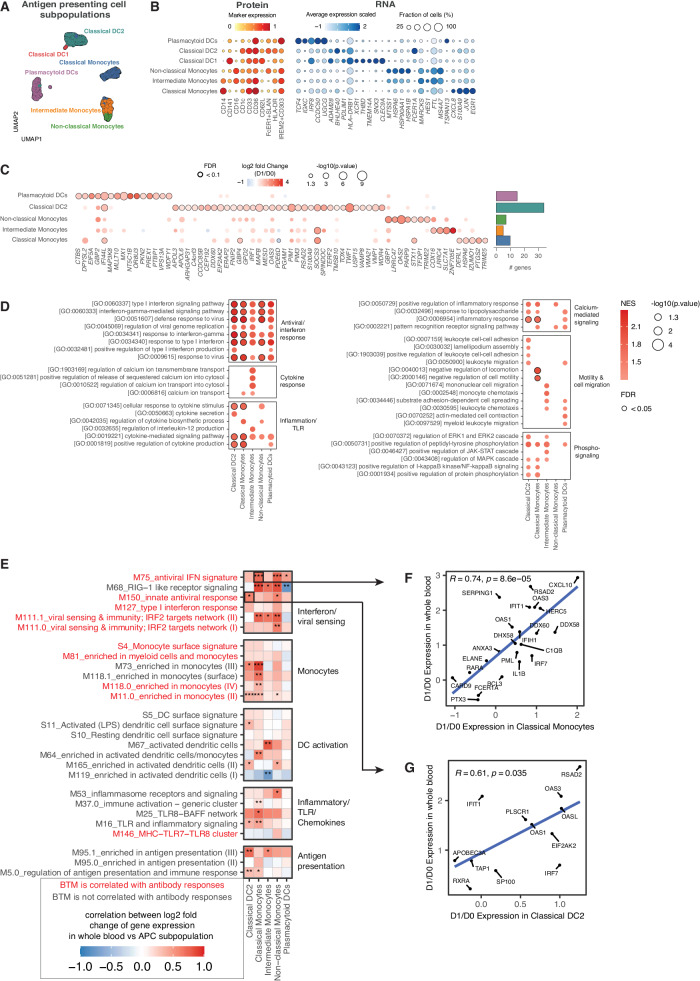
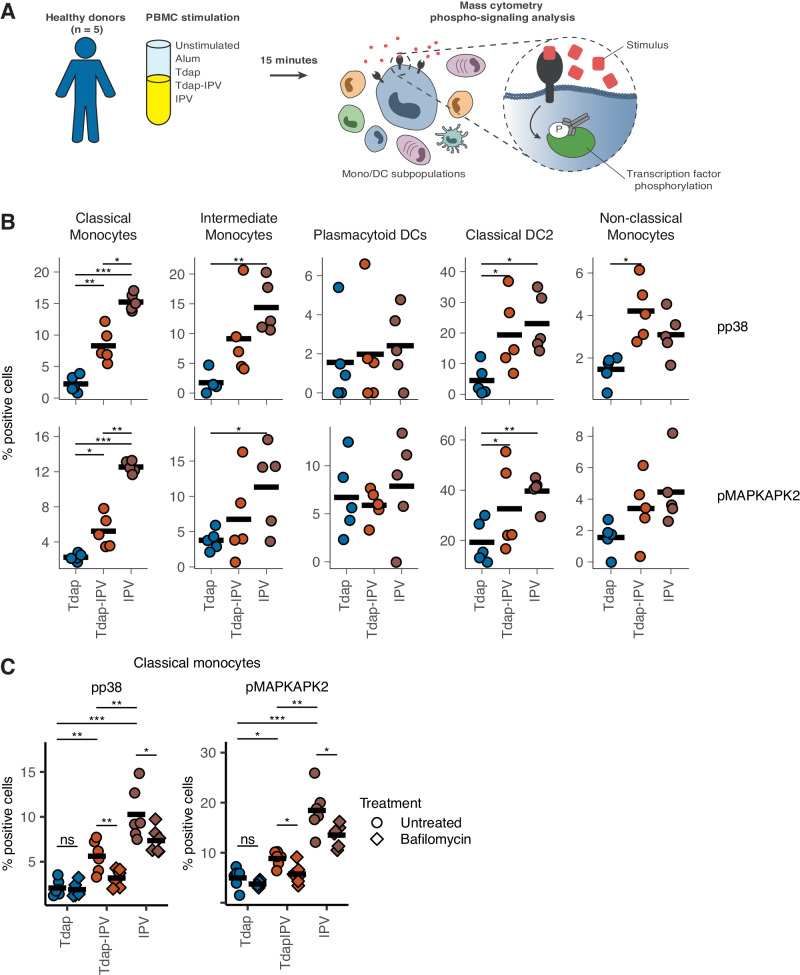
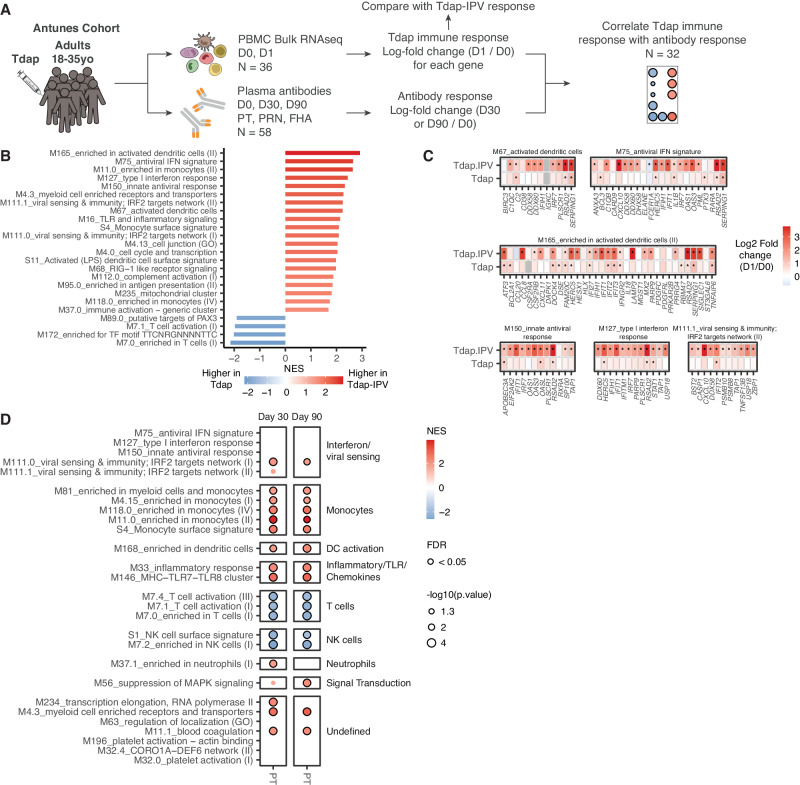
Many countries continue to experience pertussis epidemics despite widespread vaccination. Waning protection after booster vaccination has highlighted the need for a better understanding of the immunological factors that promote durable protection. Here we apply systems vaccinology to investigate antibody responses in adolescents in the Netherlands (N = 14; NL) and the United Kingdom (N = 12; UK) receiving a tetanus-diphtheria-acellular pertussis-inactivated poliovirus (Tdap-IPV) vaccine. We report that early antiviral and interferon gene expression signatures in blood correlate to persistence of pertussis-specific antibody responses. Single-cell analyses of the innate response identified monocytes and myeloid dendritic cells (MoDC) as principal responders that upregulate antiviral gene expression and type-I interferon cytokine production. With public data, we show that Tdap vaccination stimulates significantly lower antiviral/type-I interferon responses than Tdap-IPV, suggesting that IPV may promote antiviral gene expression. Subsequent in vitro stimulation experiments demonstrate TLR-dependent, IPV-specific activation of the pro-inflammatory p38 MAP kinase pathway in MoDCs. Together, our data provide insights into the molecular host response to pertussis booster vaccination and demonstrate that IPV enhances innate immune activity associated with persistent, pertussis-specific antibody responses.


Conflict of interest statement

C.T. reports inventorship of the patent “Means and methods for multiparameter cytometry-based leukocyte subsetting” (NL2844751, filing date 5 November 2019), owned by the EuroFlow Consortium. All other authors declare no competing interests.

Figures

Fig. 1
Fig. 1. Flow diagram, study procedures, and humoral responses to Tdap-IPV vaccination.
In a phase IV multi-center clinical study conducted in the Netherlands (NL) and United Kingdom (UK), male and female adolescent participants between 11–15 years old who were primed in infancy with either an acellular (aP) or a whole-cell pertussis (wP) vaccine received a booster dose of tetanus-diphtheria-acellular pertussis-inactivated polio (Tdap-IPV). N = 14 participants (NL cohort) and N = 12 participants (UK cohort) were allocated for analysis of early post-vaccination immune responses. A Flow diagram of participants who were enrolled in the current study and analyzed. B Study design indicating blood sampling and analyses performed at each timepoint. Closed circles indicate measurements performed in both cohorts, and open circles indicate those performed only in the NL cohort. C Antibody response (log10 fold change of IgG concentrations vs baseline) for the specified Tdap antigens at 28 days and 1 year post-vaccination in the NL and UK cohorts. Data are N = 14 for the NL cohort and N = 12 in the UK cohort and are represented as box plots, with bounds from 25th to 75th percentile, median line, and whiskers, which extend to the largest or smallest value no further than 1.5 * the inter-quartile range. Statistical significance was determined using a two-sided paired Wilcoxon test, ** p < 0.01, *** p < 0.001. Nominal p values are reported. NL cohort: PT, p = 0.00012; FHA, 0.00012; Prn, p = 0.00012; Dt, p = 0.00012; TT, p = 0.0067. UK cohort: PT, p = 0.00049; FHA, 0.00049; Prn, p = 0.00049; Dt, p = 0.00049; TT, p = 0.00049. Abbreviations: FHA filamentous hemagglutinin, Prn pertactin, PT pertussis toxin, Dt diphtheria toxoid, TT tetanus toxin, F female, M male. Source data are provided in the Source Data file.
Fig. 2
Fig. 2. The early immune response to Tdap-IPV vaccination is characterized by innate immune activation and antiviral responses.
A Principal component analysis of whole blood RNA sequencing data for participants in the Netherlands (NL, left panel) or United Kingdom (UK, right panel) cohorts. Sample timepoint, gender, and vaccination background are shown, as well as the portion of variance explained by each component. Lines connect a participant’s pre (D0) and 1 day post (D1) vaccination samples. Abbreviations: F female, M male, aP acellular pertussis vaccine, wP whole-cell pertussis vaccine. B Blood transcription modules (BTMs) enriched (FDR < 0.05) 1 day after Tdap-IPV vaccination (continued on fig. S5) in the NL (left panel) and UK (right panel) cohorts. Gene set enrichment analysis (GSEA) was used to calculate the normalized enrichment score (NES) of BTMs using a gene list ranked by the log2-fold change of gene expression over baseline (D1/D0). Statistical significance and p-values were calculated against an empirical null distribution and reflect two-sided tests. False discovery rate (FDR) adjusted p values were calculated; enriched BTMs (FDR < 0.05) are grouped based on their biological function. Data are 26 paired samples from N = 13 participants in the NL cohort, and 22 paired samples from N = 11 participants in the UK cohort. Source data are provided in the Source Data file.
Fig. 3
Fig. 3. Molecular signatures associated with the adjusted log-fold change antibody response induced by Tdap-IPV.
Dot plot of blood transcription modules (BTMs, rows) whose activity 1 day post-vaccination (Day 1/Day 0) is associated with adjusted log10-fold change (Methods) of Tdap-IPV induced antigen-specific antibody responses (columns) 28 days (Day 28/Day 0) or 1 year (Year 1/Day 0) post-vaccination. Data are shown for the combined participants of the Netherlands (NL, 26 paired samples from N = 13 participants) and United Kingdom (UK, 22 paired samples from N = 11 participants) cohorts. Gene set enrichment analysis was used to identify positive (red) or negative (blue) enrichment of BTMs within pre-ranked gene lists, where genes were ordered according to their correlation between gene expression and antibody response. Statistical significance and p-values were calculated against an empirical null distribution and reflect two-sided tests. False discovery rate (FDR) adjusted p values were calculated. BTMs shown, (nominal p value < 0.05) have more than two FDR adjusted significant associations (FDR < 0.05) with antibody responses, and enriched BTMs with FDR < 0.05 are highlighted with a black border. BTMs are annotated according to biological function on the right. Abbreviations: NES normalized enrichment score, FHA filamentous hemagglutinin, PRN pertactin, PT pertussis toxin, Dt diphtheria toxoid, TT tetanus toxin. Source data are provided in the Source Data file.
Fig. 4
Fig. 4. Tdap-IPV vaccination induces interferon and inflammatory cytokine production in classical monocytes, plasmacytoid and classical DC2 cells.
Eight subpopulations of antigen presenting cells were identified across baseline (D0) and Day 1 (D1) blood samples after clustering and manual merging of similar clusters (Supplementary Information, Fig. S11). A Dot plot of normalized phenotypic protein marker expression values for each of the subpopulations indicated on the left margin. B UMAP visualization of all subpopulations with vaccine-responding subpopulations indicated with a dashed frame. Changes in abundance (box plots displaying the number of cells in blood) and cytokine production (box plots displaying the mean signal intensity) are shown for (C) classical DC2 cells, (D) plasmacytoid DCs, and (E) classical monocytes. Data are 24 samples from N = 12 participants in the Netherlands cohort, data points for (C), (D), and (E) represent values for each sample and those from the same participant are joined by a gray line. Box plots display bounds from 25th to 75th percentile, median line, and whiskers, which extend to the largest or smallest value no further than 1.5 * the inter-quartile range. Box plots with white fill correspond to D0 samples, and those with gray fill correspond to D1 samples. Statistical significance (false-discovery rate (FDR) adjusted two-sided p.value) was calculated from a mixed-effects regression model for each response (abundance or cytokine) with study day and participant number specified as fixed and random effects, respectively * FDR < 0.05; ** FDR < 0.01; *** FDR < 0.001, ns FDR > 0.05. Source data are provided in the Source Data file.
Fig. 5
Fig. 5. Single-cell RNA sequencing reveals type-I interferon and anti-viral gene expression in antigen presenting cells.
A UMAP visualization of all single-cells (N = 6348 cell across 14 blood samples representing two timepoints (D1 and D0) from N = 7 participants of the Netherlands cohort) colored according to subpopulation with (B) dot plots of protein markers (left panel) and RNA expression profiles of top discriminating genes (right panel). C Upregulated differentially expressed genes (DEGs) 1 day after vaccination are marked with a black border. Expression of DEGs is also shown for other subpopulations if the nominal p < 0.05. Right margin: the number of upregulated DEGs for each subpopulation. Statistical significance was calculated with a negative binomial linear model and false-discovery rate (FDR) adjusted two-sided p values were calculated. Upregulated DEGs were defined as log2 fold change (D1/D0) > 0, FDR < 0.1. D Gene set enrichment analysis (GSEA) was used to calculate the normalized enrichment score (NES) of GO terms for each subpopulation using a list of all genes ranked by the log2-fold change over baseline (D1/D0). Statistical significance and p-values were calculated against an empirical null distribution and reflect two-sided tests. FDR adjusted p values were calculated. Selected GO terms are shown (nominal p < 0.05) and those with FDR < 0.05 are highlighted with a black border. E Correlations of whole blood BTM gene expression (y-axis) with gene expression of each APC subpopulation (x-axis). BTMs that are enriched at D1 in whole blood of the Netherlands cohort are shown on the y-axis (related to Fig. 2B) and are colored according to whether those BTMs are correlated with antibody responses (related to Fig. 3). Heatmap color indicates Pearson’s correlation coefficient. The degree of statistical significance (nominal two-sided p value) is also shown * p < 0.05; ** p < 0.01; *** p < 0.001. BTMs are grouped based on their biological function on the right margin. F Correlations between log2 fold change (D1/D0) of gene expression in whole blood vs classical monocytes for the M75_antiviral IFN signature BTM (N = 22 genes), and (G) correlations between gene expression in whole blood vs classical DC2 for the M150_antiviral IFN signature BTM (N = 12 genes). Genes in each module are labeled with Pearson’s correlation coefficient and nominal two-sided p value. Source data are provided in the Source Data file.
Fig. 6
Fig. 6. Inactivated poliovirus stimulates P38 and MAPK phospho-signaling responses in classical monocytes and dendritic cells.
A Experimental plan for the analysis of phospho-signaling responses after stimulation with vaccines. PBMCs from healthy donors were left unstimulated or incubated for 15 min with one of the indicated stimuli. Mass cytometry was then used to identify innate immune cell populations and quantify phospho-signaling responses. B The proportion of cells expressing phosphorylated p38 (pp38) or MAPKAPK2 (pMAPKAPK2) in response to Tdap, Tdap-IPV, or IPV stimulation. Responses of five antigen presenting cell subpopulations are shown. Data are N = 5 healthy donors. Classical monocytes (pMAPKAPK2): TdapIPV vs Tdap p = 0.023; IPV vs Tdap p = 1.98 × 10−5; TdapIPV vs IPV p = 0.001; IPV vs TdapIPV p = 0.001. Classical monocytes (pp38): TdapIPV vs Tdap p = 0.009; IPV vs Tdap p = 2.41 × 10−5; IPV vs TdapIPV p = 0.016. Classical DCs (pMAPKAPK2): TdapIPV vs Tdap p = 0.039; IPV vs Tdap p = 0.004; Classical DCs (pp38): IPV vs Tdap p = 0.011; TdapIPV vs Tdap p = 0.045; Intermediate monocytes (pMAPKAPK2): IPV vs Tdap p = 0.03; Intermediate monocytes (pp38): IPV vs Tdap p = 0.002; Non-classical monocytes (pp38): TdapIPV vs Tdap p = 0.02. C In a second experiment, PBMCs were pre-incubated with bafilomycin or left untreated and were subsequently stimulated with the indicated vaccines. pp38 and pMAPKAPK2 expression is shown for classical monocytes. Data are of N = 6 healthy donors. Classical monocytes (pMAPKAPK2): TdapIPV.Bafilomycin vs TdapIPV.Untreated p = 0.012, IPV.Bafilomycin vs IPV.Untreated p = 0.036, Tdap.Bafilomycin vs Tdap.Untreated p = 0.15, TdapIPV.Untreated vs Tdap.Untreated p = 0.02, IPV.Untreated vs Tdap.Untreated p = 0.0002, IPV.Untreated vs TdapIPV.Untreated p = 0.0046; Classical monocytes (pp38): TdapIPV.Bafilomycin vs TdapIPV.Untreated p = 0.007, IPV.Bafilomycin vs IPV.Untreated p = 0.040, Tdap.Bafilomycin vs Tdap.Untreated p = 0.73; TdapIPV.Untreated vs Tdap.Untreated p = 0.004, IPV.Untreated vs Tdap.Untreated p = 0.0002, IPV.Untreated vs TdapIPV.Untreated p = 0.008. * P < 0.05, ** P < 0.01, *** P < 0.001, statistical significance (nominal p value) was determined using a two-sided paired T test. Horizontal black lines in each plot correspond to the sample mean. Source data are provided in the Source Data file.
Fig. 7
Fig. 7. Tdap-IPV induces stronger anti-viral gene expression compared to Tdap.
A Approach for comparing the effects of Tdap and Tdap-IPV vaccination. B Gene set enrichment analysis (GSEA) was performed on a list of genes ranked by the difference in log2-fold change (D1/D0) between Tdap-IPV (combined NL and UK cohorts) and Tdap vaccination (Antunes cohort). Significantly enriched (FDR < 0.05) blood transcription modules (BTMs) are shown. C Genes of selected BTMs from (B) are shown with the log2-fold expression (D1/D0) of Tdap-IPV (combined NL and UK cohorts) and Tdap vaccines. Differentially expressed genes (DEG, FDR < 0.05 and | Log2 fold change| > 0.5) are marked with an asterisk. Statistical significance was calculated with a negative binomial linear model and FDR adjusted two-sided p values were calculated. D Dot plot of selected BTMs (rows) whose activity 1 day post-vaccination (D1/D0) is associated with the adjusted log10 fold change of PT-specific antibody responses (columns) 30 days (Day 30/Day 0) or 90 days (D90/Day 0) post Tdap vaccination. Data are N = 32 participants in the Tdap cohort. GSEA was used to identify positive (red) or negative (blue) enrichment of BTMs within pre-ranked gene lists, where genes were ordered according to their correlation between gene expression and antibody response. Selected BTMs that are associated with antibody responses after Tdap-IPV vaccination (related to Fig. 3) are labeled on the y-axis, and significant correlations of those BTMs with the Tdap-induced PT antibody response are shown (nominal p < 0.05), enriched BTMs with FDR < 0.05 are highlighted with a black border. BTMs are annotated according to biological function on the right. Statistical significance and p-values of GSEA analyses (B, D) were calculated against an empirical null distribution and reflect two-sided tests. False discovery rate (FDR) adjusted p values were calculated. Abbreviations: FHA filamentous hemagglutinin, PRN pertactin, PT pertussis toxin, PBMC peripheral blood mononuclear cells. Source data are provided in the Source Data file.

References

    1. Hegerle N, Guiso N. Epidemiology of whooping cough & typing of Bordetella pertussis. Future Microbiol. 2013;8:1391–1403. doi: 10.2217/fmb.13.111. - DOI - PubMed
    1. Jackson DW, Rohani P. Perplexities of pertussis: recent global epidemiological trends and their potential causes. Epidemiol. Infect. 2014;142:672–684. doi: 10.1017/S0950268812003093. - DOI - PMC - PubMed
    1. European centre for disease prevention and control, Vaccine schedules in all countries in the EU/EEA. https://vaccine-schedule.ecdc.europa.eu (2021).
    1. Grimprel E, et al. Combined reduced-antigen-content diphtheria-tetanus-acellular pertussis and polio vaccine (dTpa-IPV) for booster vaccination of adults. Vaccine. 2005;23:3657–3667. doi: 10.1016/j.vaccine.2005.02.013. - DOI - PubMed
    1. Lambert EE, et al. Uncovering distinct primary vaccination-dependent profiles in human bordetella pertussis specific CD4+ T-Cell responses using a novel whole blood assay. Vaccines. 2020;8:225. doi: 10.3390/vaccines8020225. - DOI - PMC - PubMed