. 2024 Mar 8;15(1):2149.
doi: 10.1038/s41467-024-46447-w.

Viscosity-dependent control of protein synthesis and degradation

Affiliations

Viscosity-dependent control of protein synthesis and degradation

Yuping Chen et al. Nat Commun. .

Abstract

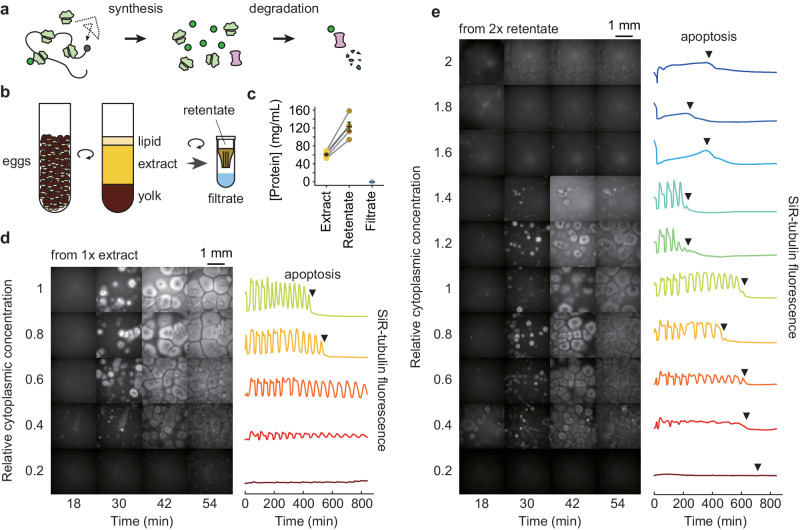
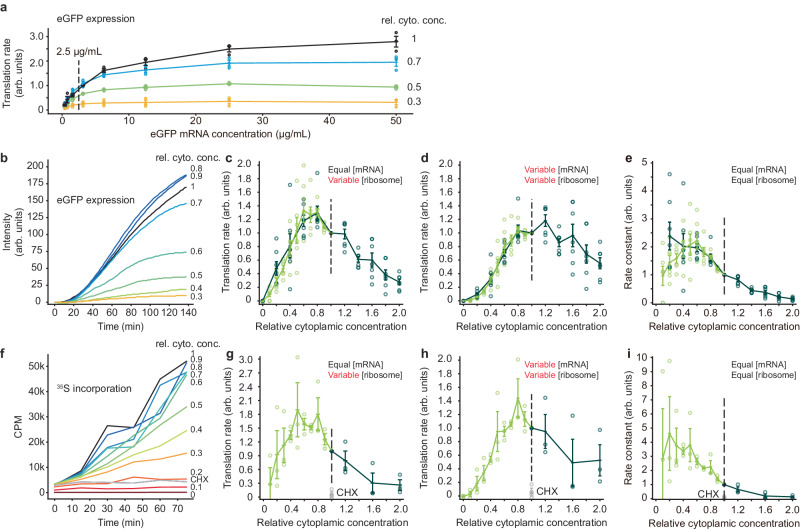
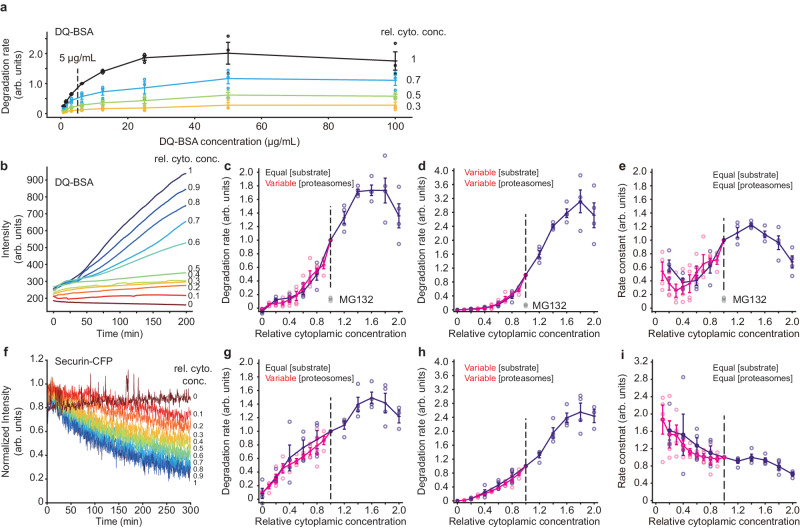
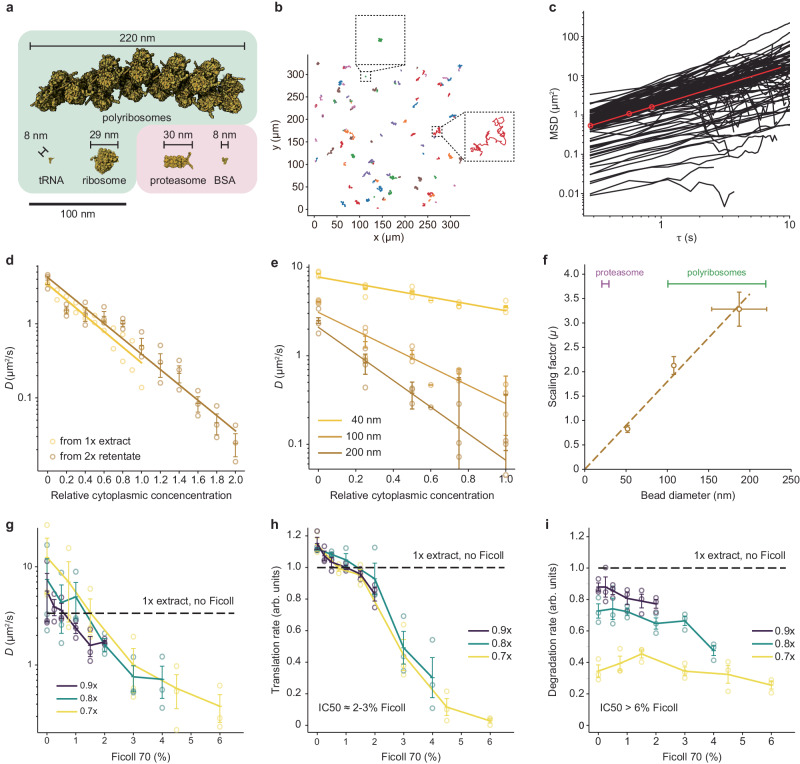
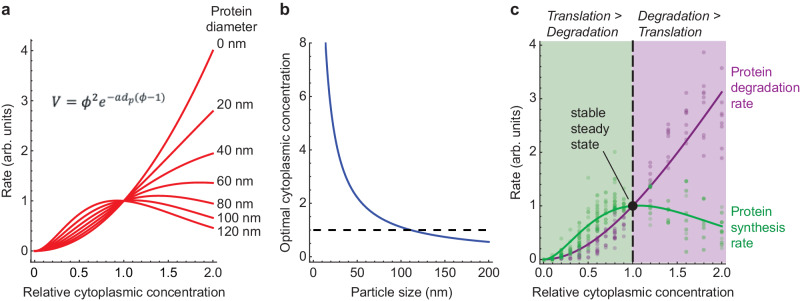
It has been proposed that the concentration of proteins in the cytoplasm maximizes the speed of important biochemical reactions. Here we have used Xenopus egg extracts, which can be diluted or concentrated to yield a range of cytoplasmic protein concentrations, to test the effect of cytoplasmic concentration on mRNA translation and protein degradation. We find that protein synthesis rates are maximal in ~1x cytoplasm, whereas protein degradation continues to rise to a higher optimal concentration of ~1.8x. We show that this difference in optima can be attributed to a greater sensitivity of translation to cytoplasmic viscosity. The different concentration optima could produce a negative feedback homeostatic system, where increasing the cytoplasmic protein concentration above the 1x physiological level increases the viscosity of the cytoplasm, which selectively inhibits translation and drives the system back toward the 1x set point.


Conflict of interest statement

The authors declare no competing interests.

Figures

Fig. 1
Fig. 1. General properties of diluted and concentrated Xenopus egg extracts: effects on self-organization and cycling.
a Schematic view of protein synthesis and degradation. b Preparation of Xenopus egg extract, 2× concentrated retentate, and protein-depleted filtrate. c Protein concentration in extract, retentate, and filtrate. Concentrations were determined by Bradford assays. Data are from five extracts. Individual data points are overlaid with the means and standard errors. Source data are provided as a Source Data file. d SiR-tubulin staining (left) and SiR-tubulin fluorescence intensity as a function of time (right) in an extract after various dilutions. The starting material was a 1× extract, diluted with various proportions of filtrate, and imaged in a 96-well plate under mineral oil. All fields are shown at equal exposure. The fluorescence intensities shown on the right were quantified from the center 1/9 of the wells. e SiR-tubulin staining (left) and SiR-tubulin fluorescence intensity as a function of time (right) in an extract after various dilutions. The data were collected as in (d) except that the starting material was a 2× extract.
Fig. 2
Fig. 2. The rate of mRNA translation is maximal at a cytoplasmic concentration of~1x.
a Titration of mRNA concentration for eGFP expression. The indicated concentration (2.5 µg/mL) was chosen for the experiments in (be). Data from n = 3 independent experiments. Data are presented as mean values ± SEM. b eGFP expression as a function of time for various dilutions of a 1× extract. c Translation rate as a function of cytoplasmic concentration. These are the directly-measured data from experiments where the eGFP mRNA concentration was kept constant and the translation machinery was proportional to the cytoplasmic concentration. Data are from n = 6 independent experiments for dilution from 1× extracts and n = 7 independent experiments for dilution from 2× retentates. Data are normalized relative to the translation rates at a cytoplasmic concentration of 1×. Means and standard errors are overlaid on the individual data points. In this and the subsequent panels, the darker green represents data from diluting 2× retentates and the lighter green from diluting 1× extract. d Inferred translation rates for the situation where the mRNA concentration as well as the ribosome concentration is proportional to the cytoplasmic concentration. The rates from (c) were multiplied by the relative cytoplasmic concentrations. Data are from n = 6 independent experiments for dilution from 1× extracts and n = 7 independent experiments for dilution from 2× retentates. Data are presented as mean values ± SEM. e Inferred translation rates for the situation where both the mRNA concentration and the ribosome concentration are kept constant at all dilutions. This represents an estimate of the apparent bimolecular rate constant for translation. The rates from (c) were divided by the relative cytoplasmic concentrations. Data are from n = 6 independent experiments for dilution from 1× extracts and n = 7 independent experiments for dilution from 2× retentates. Data are presented as mean values ± SEM. f TCA-precipitable 35S incorporation as a function of time for translation from endogenous mRNAs. Various dilutions of a 1× extract are shown. CHX denotes a 1× extract treated with 100 µg/mL cycloheximide. g Inferred translation rates for the situation where mRNA concentration is kept constant and ribosome concentration is proportional to the cytoplasmic concentration. The rates from (h) were divided by the relative cytoplasmic concentration. The gray data points are from CHX (100 µg/mL)-treated 1× extracts. Data are from n = 3 independent experiments for dilution from 1× extracts and n = 3 independent experiments for dilution from 2× retentates. Data are presented as mean values ± SEM. h Translation rate as a function of cytoplasmic concentration. These are the directly measured data from experiments where the 35S concentration was kept constant but both the (endogenous) mRNA concentration and translational machinery were proportional to the cytoplasmic concentration. Data are from n = 3 independent experiments for dilution from 1× extracts and n = 3 independent experiments for dilution from 2× retentates. Data are normalized relative to the translation rates at a cytoplasmic concentration of 1×. Means and standard errors are overlaid on the individual data points. i Inferred translation rates for the situation where both the mRNA concentration and the ribosome concentration are kept constant at all dilutions. The rates from (h) were divided twice by the relative cytoplasmic concentrations (i.e., by the relative concentration squared). Data are from n = 3 independent experiments for dilution from 1× extracts and n = 3 independent experiments for dilution from 2× retentates. Data are presented as mean values ± SEM. Source data for panels (a, d, and g) are provided as a Source Data file.
Fig. 3
Fig. 3. The rate of protein degradation is maximal at cytoplasmic concentrations of~1.8×.
a Titration of substrate protein concentration for DQ-BSA degradation experiments. The indicated concentration (5 µg/mL) was chosen for the experiments in (be). Data from n = 3 independent experiments. Data are presented as mean values ± SEM. b DQ-BSA fluorescence as a function of time for various dilutions of a 1× extract. c Degradation rate as a function of cytoplasmic concentration. These are the directly-measured data from experiments where the DQ-BSA concentration was kept constant and the proteolysis machinery was proportional to the cytoplasmic concentration. The gray data points denoted MG132 are from 1× extracts treated with 200 µM MG132, a proteasome inhibitor. Data are from 4 experiments for dilution from 1× extracts and 4 experiments for dilution from 2× retentates. Data are normalized relative to the degradation rates at a cytoplasmic concentration of 1×. Means and standard errors are overlaid on the individual data points. In this and the subsequent panels, the darker purple represents data from diluting 2× retentates and the lighter purple from diluting 1× extract. d Inferred degradation rates for the situation where the substrate concentration as well as the proteasome concentration is proportional to the cytoplasmic concentration. The rates from (c) were multiplied by the relative cytoplasmic concentrations. Data are from n = 4 independent experiments for dilution from 1× extracts and n = 4 independent experiments for dilution from 2× retentates. Data are presented as mean values ± SEM. e Inferred degradation rates for the situation where both the substrate concentration and the proteasome concentration are kept constant at all dilutions. The rates from (c) were divided by the relative cytoplasmic concentrations. This represents an estimate of the apparent bimolecular rate constant for degradation. Data are from n = 4 independent experiments for dilution from 1× extracts and n = 4 independent experiments for dilution from 2× retentates. Data are presented as mean values ± SEM. f Degradation of securin-CFP as a function of time for various dilutions of a 1x extract. g Degradation rate as a function of cytoplasmic concentration. These are the directly-measured data from experiments where the securin-CFP concentration was kept constant but the proteasome concentration was proportional to the cytoplasmic concentration. Data are from 4 experiments for dilution from 1× extracts and 4 experiments for dilution from 2× retentates. Data are normalized relative to the degradation rates at a cytoplasmic concentration of 1×. Means and standard errors are overlaid on the individual data points. h Inferred degradation rate for the situation where both the substrate and proteasome concentrations are proportional to the cytoplasmic concentration. The rates from (g) were multiplied by the relative cytoplasmic concentrations. Data are from n = 4 independent experiments for dilution from 1× extracts and n = 4 independent experiments for dilution from 2× retentates. Data are presented as mean values ± SEM. i Inferred degradation rates for the situation where both the substrate and the proteasome concentration are kept constant at all dilutions. The rates from (g) were divided by the relative cytoplasmic concentrations. Data are from n = 4 independent experiments for dilution from 1× extracts and n = 4 independent experiments for dilution from 2× retentates. Data are presented as mean values ± SEM. Source data for panels (a, d, and h) are provided as a Source Data file.
Fig. 4
Fig. 4. The effect of cytoplasmic concentration on diffusion, and the effect of Ficoll 70 on translation and protein degradation.
a The sizes of various macromolecules and complexes involved in translation and degradation. b Single particle traces for diffusion of 100 nm fluorescent beads in 1× cytoplasmic extracts. Two examples of location-to-location variability are highlighted. c Mean squared displacement for 110 individual trajectories (black) and average mean squared displacement (red) as a function of the time difference τ. Effective diffusion coefficients were calculated from the first 1 s of data. d Effective diffusion coefficients for 100 nm fluorescent beads as function of relative cytoplasmic concentration. Data are from 3 experiments for the 2× extract dilution and from 2 experiments for the 1× extract dilution. Error bars for the 2× extract dilution represent means ± standards errors. e Effective diffusion coefficients for beads of different diameter (nominally 40 nm, 100 nm, and 200 nm) as a function of relative cytoplasmic concentration. Data are from 3 experiments. Means and standard errors are overlaid on the individual data points. f The scaling factor μ (from Eq. 1) as a function of bead diameter. The apparent bead diameters (nominally 40, 100, and 200 nm) were calculated from their diffusion coefficients in extract buffer with no sucrose using the Stokes-Einstein relationship. Scaling factors are from 3 experiments and are shown as means ± S.E. Bead diameters are from 3 experiments for the 40 nm beads and 4 experiments for the 100 and 200 nm beads, and again are plotted as means ± S.E. The diameters of proteasomes and polyribosomes are shown for comparison. g Diffusion coefficients of 40 nm beads as a function of Ficoll 70 concentration. Extracts were prepared at 0.7×, 0.8×, and 0.9× as indicated and supplemented with Ficoll to yield the final concentrations (w/vol) shown on the x-axis. Data are from 3 experiments. Means and standard errors are overlaid on the individual data points. Diffusion coefficients for the undiluted 1× extracts were also measured and the average is shown for reference. h Translation rates, using the eGFP assay, as a function of Ficoll 70 concentration. Extracts were prepared at 0.7×, 0.8×, and 0.9× as indicated and supplemented with Ficoll to yield the final concentrations (w/vol) shown on the x-axis. Data are from the same 3 experiments shown in (g). Means and standard errors are overlaid on the individual data points. Translation rates for the undiluted 1× extracts were also measured and the average is shown for reference. i Degradation rates, using the DQ-BSA assay, as a function of Ficoll 70 concentration. Extracts were prepared at 0.7×, 0.8×, and 0.9× as indicated and supplemented with Ficoll to yield the final concentrations (w/vol) shown on the x-axis. Data are from the same 3 experiments shown in (g). Means and standard errors are overlaid on the individual data points. Degradation rates for the undiluted 1× extracts were also measured and the average is shown for reference. Source data for panels (di) are provided as a Source Data file.
Fig. 5
Fig. 5. Homeostasis in a model of the effect of cytoplasmic concentration of translation and protein degradation.
a Plot of Eq. 2, which relates a bimolecular reaction rate to the relative cytoplasmic concentration, for various sizes of proteins. We assumed a = 0.018 nm-1 (from Fig. 4f). b Calculated optimal relative cytoplasmic concentration for proteins of different assumed sizes, again assuming a = 0.018 nm-1. c Fits of Eq. 2 to the experimental data for translation (green) and degradation (purple) as a function of cytoplasmic concentration, calculated assuming that both the substrate and enzyme varied with the cytoplasmic concentration. All of the data from Figs. 2d, h, and 3d, h were included in the fits. The R2 values are 0.92 for the translation data and 0.95 for the degradation data. The fitted values for the size of the proteins involved are 104 ± 2 nm (mean ± S.E.) for translation and 14 ± 1 nm (mean ± S.E) for degradation. The fitted optimal cytoplasmic concentrations are 1.07 ± 0.02 for translation and 8.1 ± 0.8 for degradation (mean ± S.E.).

References

    1. Liu X, Oh S, Kirschner MW. The uniformity and stability of cellular mass density in mammalian cell culture. Front. Cell Dev. Biol. 2022;10:1017499. doi: 10.3389/fcell.2022.1017499. - DOI - PMC - PubMed
    1. Elowitz MB, Surette MG, Wolf PE, Stock JB, Leibler S. Protein mobility in the cytoplasm of Escherichia coli. J. Bacteriol. 1999;181:197–203. doi: 10.1128/JB.181.1.197-203.1999. - DOI - PMC - PubMed
    1. Zimmerman SB, Trach SO. Estimation of macromolecule concentrations and excluded volume effects for the cytoplasm of Escherichia coli. J. Mol. Biol. 1991;222:599–620. doi: 10.1016/0022-2836(91)90499-V. - DOI - PubMed
    1. Oh S, et al. Protein and lipid mass concentration measurement in tissues by stimulated Raman scattering microscopy. Proc. Natl Acad. Sci. USA. 2022;119:e2117938119. doi: 10.1073/pnas.2117938119. - DOI - PMC - PubMed
    1. Neurohr GE, Amon A. Relevance and regulation of cell density. Trends Cell Biol. 2020;30:213–225. doi: 10.1016/j.tcb.2019.12.006. - DOI - PMC - PubMed