. 2024 Mar 8;10(1):27.
doi: 10.1038/s41540-024-00354-4.

Data-driven energy landscape reveals critical genes in cancer progression

Affiliations

Data-driven energy landscape reveals critical genes in cancer progression

Juntan Liu et al. NPJ Syst Biol Appl. .

Abstract

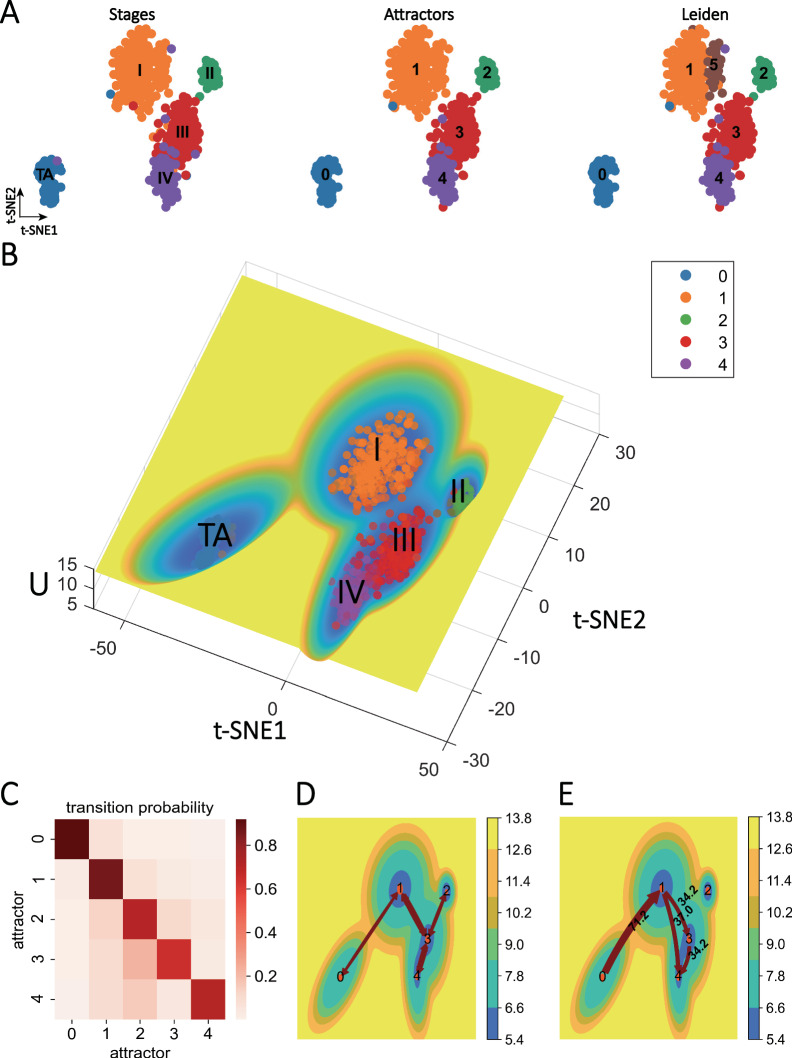
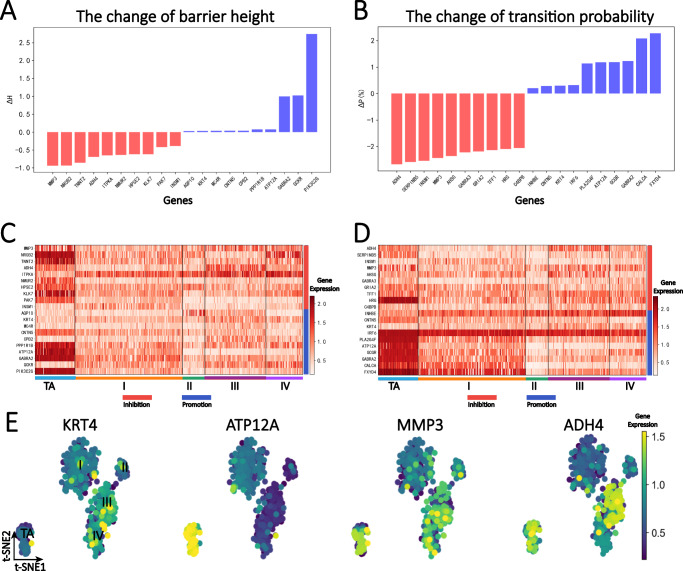
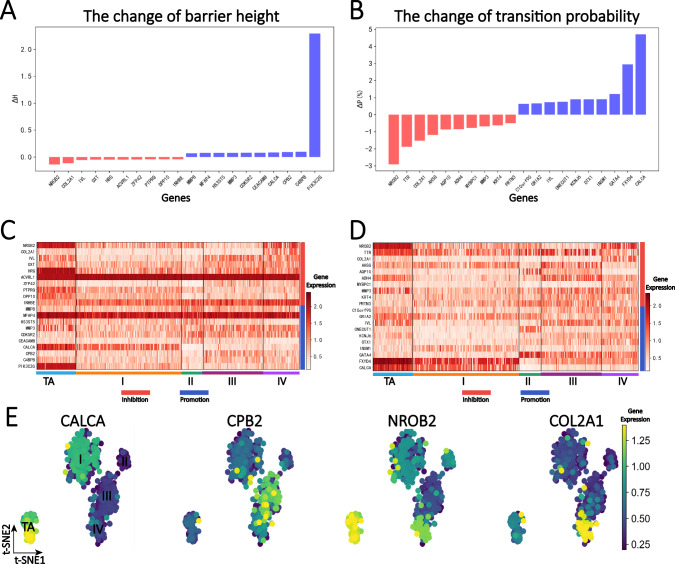
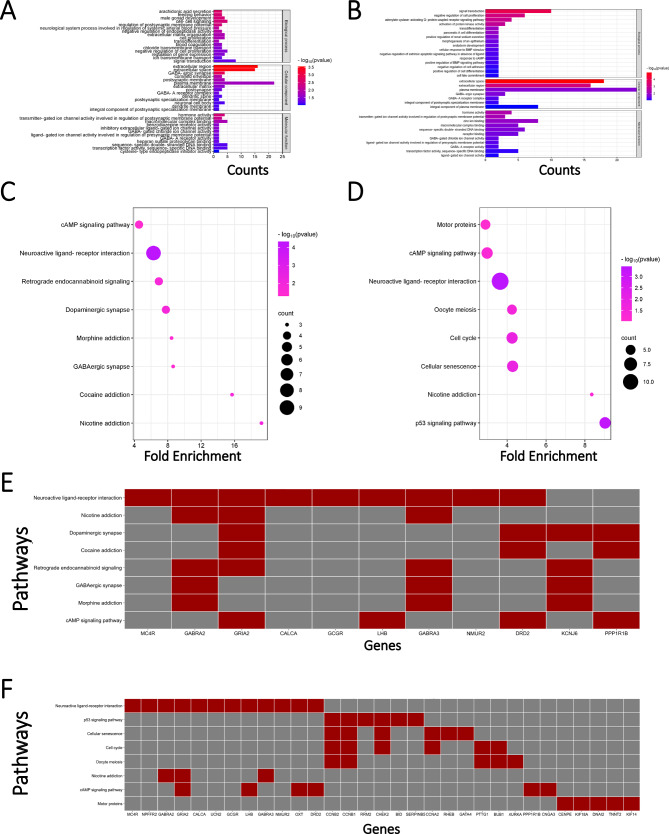
The evolution of cancer is a complex process characterized by stable states and transitions among them. Studying the dynamic evolution of cancer and revealing the mechanisms of cancer progression based on experimental data is an important topic. In this study, we aim to employ a data-driven energy landscape approach to analyze the dynamic evolution of cancer. We take Kidney renal clear cell carcinoma (KIRC) as an example. From the energy landscape, we introduce two quantitative indicators (transition probability and barrier height) to study critical shifts in KIRC cancer evolution, including cancer onset and progression, and identify critical genes involved in these transitions. Our results successfully identify crucial genes that either promote or inhibit these transition processes in KIRC. We also conduct a comprehensive biological function analysis on these genes, validating the accuracy and reliability of our predictions. This work has implications for discovering new biomarkers, drug targets, and cancer treatment strategies in KIRC.


Conflict of interest statement

The authors declare no competing interests.

Figures

Fig. 1
Fig. 1. Data-driven landscape reveals KIRC disease progression.
A Left: Tumor stage labels of samples under t-SNE dimensionality reduction, which is divided according to tumor diameter size, where TA refers to tumor-adjacent samples; Middle: MuTrans classification results by attractors of the dynamical system; Right: Unsupervised clustering algorithm Leiden based on gene expression data analysis of the population results. It can be seen that the attractor has a general correspondence with the staging label (Supplementary Figure 2), while the samples of stage I (attractor 1) in the Leiden cluster tend to be divided into two categories: group 1 and group 5. B The three-dimensional energy landscape corresponding to the KIRC data shows the results of different stages (attractors): the x-axis is t-SNE1, the y-axis is t-SNE2, and the ordinate is the energy magnitude (see formula 8), where there is a general correspondence between the staging information and the attractor, and each attractor corresponds to a stable state. C Transition probability matrix between each attractor: the color on the diagonal is darker and the other parts are lighter, indicating that each attractor is relatively stable. D The trajectory inference of the MPFT method: results were demonstrated in the two-dimensional energy plane. The color shade represents the energy value, the arrow line indicates that there is a transition path between the two attractors, and the obvious paths 0-1-3-4,2-3-4 can be seen in the figure. E The trajectory inferred by the MPPT method: the arrows from attractor A to B indicate that A transits to B. There are two significant paths for 0- > 1- > 3- > 4, and 0- > 1- > 4, where attractor 2 seems to be isolated.
Fig. 2
Fig. 2. Critical gene analysis of the onset period (from stage TA to I).
A The barrier height indicator identified the top ten promoting and inhibitory genes in cancer onset: among which the energy barrier height from TA to I was 4.6. ΔH greater than 0 (blue column) represents corresponding gene promoting the cancer onset process, and ΔH less than 0 (red column) represents corresponding gene inhibiting the cancer onset process (see Methods for detailed definition of ΔH). B The transition probability indicator detected the top ten promoting and inhibiting genes in cancer onset, in which the transition probability value was 81.3% when all gene expression information was included in the process from stage TA to I (see Methods for details). C The gene expression heatmap of the top ten promoting and inhibitory genes detected by barrier height indicator. D The gene expression heatmap of the top ten promoting and inhibitory genes detected by transition probability indicator. E Distribution of gene expression data with shared critical genes identified by the two indicators. Darker blue indicates lower expression, while darker yellow indicates higher expression. The expression values of KRT4 gene were relatively uniformly distributed. ATP12A was differentially expressed in TA samples but significantly reduced in other samples, which may be related to the pathogenesis. MMP3 showed significantly high expression in stages TA, III, and IV, while ADH4 was differentially expressed in stages TA and III.
Fig. 3
Fig. 3. Critical gene analysis of the progression period (from stage III to IV).
A The barrier height indicator identified the top ten promoting and inhibitory genes in cancer progression, among which the energy barrier height from III to IV was 0.3. ΔH greater than 0 (blue column) represents corresponding gene promoting the cancer progression, and ΔH less than 0 (red column) represents corresponding gene inhibiting the cancer progression (see Methods for detailed definition of ΔH). B The transition probability indicator detected the top ten promoting and inhibiting genes in cancer progression, in which the transition probability value was 69.5% when all gene expression information was included in the process from stage III to IV. C The gene expression heatmap of the top ten promoting and inhibitory genes detected by barrier height indicator. D The gene expression heatmap of the top promoting and inhibitory genes detected by transition probability indicator. E Distribution of gene expression data with shared critical genes identified by the two indicators. Darker blue indicates lower expression, while darker yellow indicates higher expression. CALCA was differentially expressed in stages TA and I samples, CPB2 was differentially expressed in stage III samples, NROB2 was differentially expressed in stages TA and IV, and COL2A1 was differentially expressed in stage IV.
Fig. 4
Fig. 4. Functional analysis of critical genes in the KIRC onset and progression period.
A GO enrichment analysis of critical genes identified in the KIRC cancer onset: The enrichment results of the top 20 promoting and inhibitory genes from both indicators were analyzed in terms of Biological Process, Cellular Component, and Molecular Function. B GO enrichment analysis of critical genes identified in the KIRC cancer progression: The enrichment results of the top 20 promoting and inhibitory genes from both indicators were analyzed in terms of Biological Process, Cellular Component, and Molecular Function. KEGG pathway enrichment analysis of critical genes (C) KIRC cancer onset and (D) KIRC cancer progression: The x-axis represents Fold Enrichment, the color intensity represents the significance of pathway enrichment, and the size of the circles represents the number of genes enriched. Mapping of specific critical genes in KEGG pathway enrichment (E) KIRC cancer onset and (F) KIRC cancer progression: Red (gray) indicates the specific critical genes that are enriched (not enriched) in this pathway.

Similar articles

Cited by

References

    1. McSharry PE, Smith LA, Tarassenko L. Prediction of epileptic seizures: are nonlinear methods relevant? Nat. Med. 2003;9:241–242. doi: 10.1038/nm0303-241. - DOI - PubMed
    1. Sardanyés J, et al. Activation of effector immune cells promotes tumor stochastic extinction: A homotopy analysis approach. Appl Math. Comput. 2015;252:484–495.
    1. Itik M, Salamci MU, Banks SP. Optimal control of drug therapy in cancer treatment. Nonlinear Anal.: Theory, Methods Appl. 2009;71:e1473–e1486. doi: 10.1016/j.na.2009.01.214. - DOI
    1. Li C, Wang J. Quantifying the underlying landscape and paths of cancer. J. R. Soc. Interface. 2014;11:20140774. doi: 10.1098/rsif.2014.0774. - DOI - PMC - PubMed
    1. Bocci F, Zhou P, Nie Q. spliceJAC: transition genes and state-specific gene regulation from single-cell transcriptome data. Mol. Syst. Biol. 2022;18:e11176. doi: 10.15252/msb.202211176. - DOI - PMC - PubMed