. 2024 Mar 8;15(1):2113.
doi: 10.1038/s41467-024-46220-z.

Spatially-resolved transcriptomics reveal macrophage heterogeneity and prognostic significance in diffuse large B-cell lymphoma

Affiliations

Spatially-resolved transcriptomics reveal macrophage heterogeneity and prognostic significance in diffuse large B-cell lymphoma

Min Liu et al. Nat Commun. .

Abstract

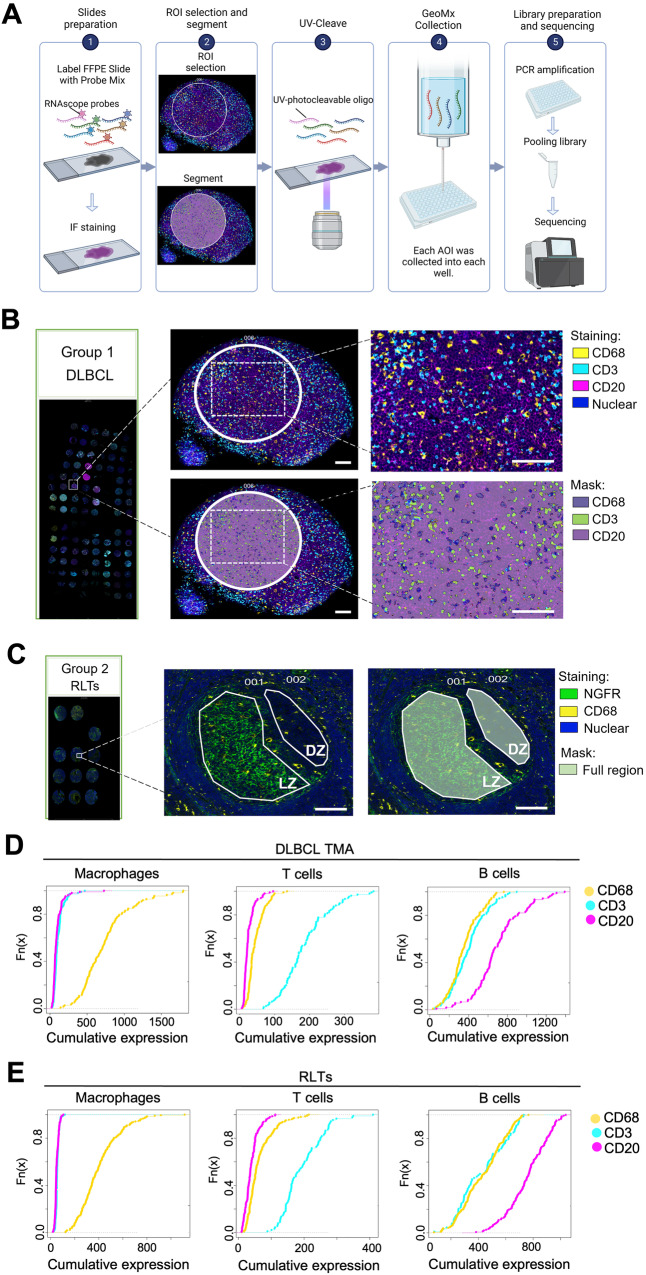
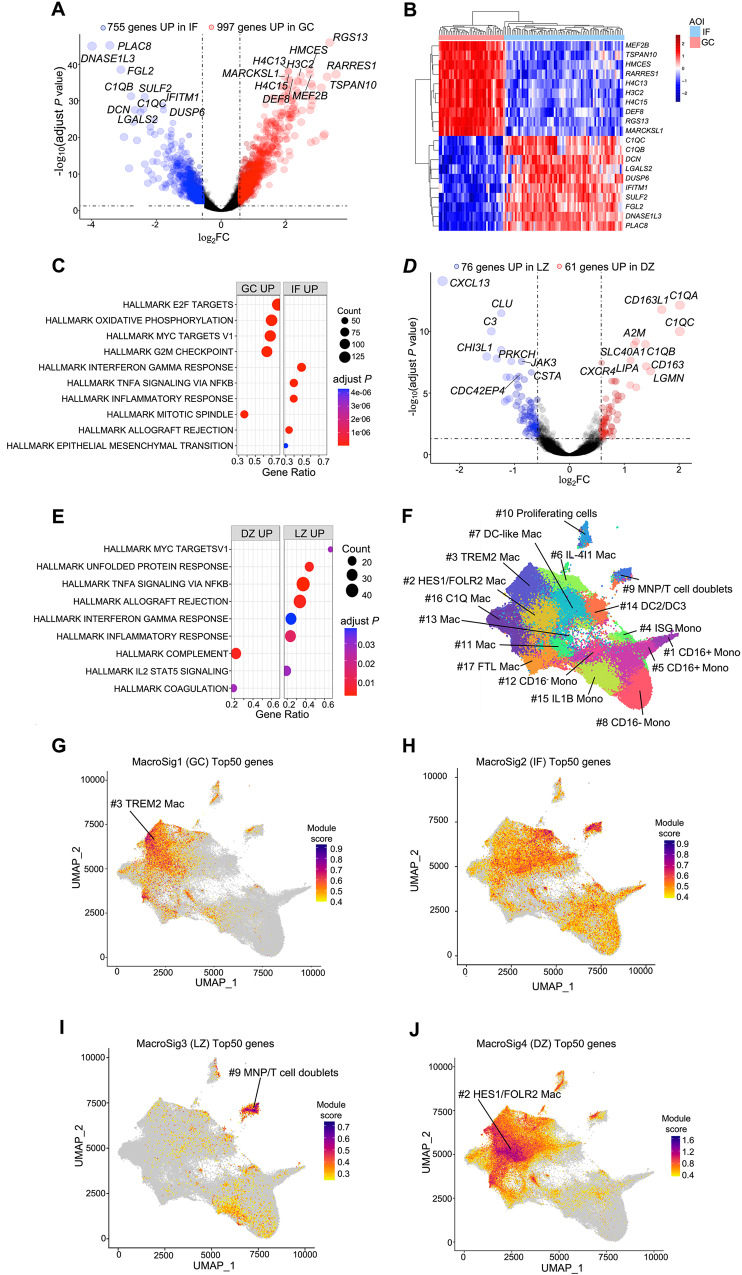
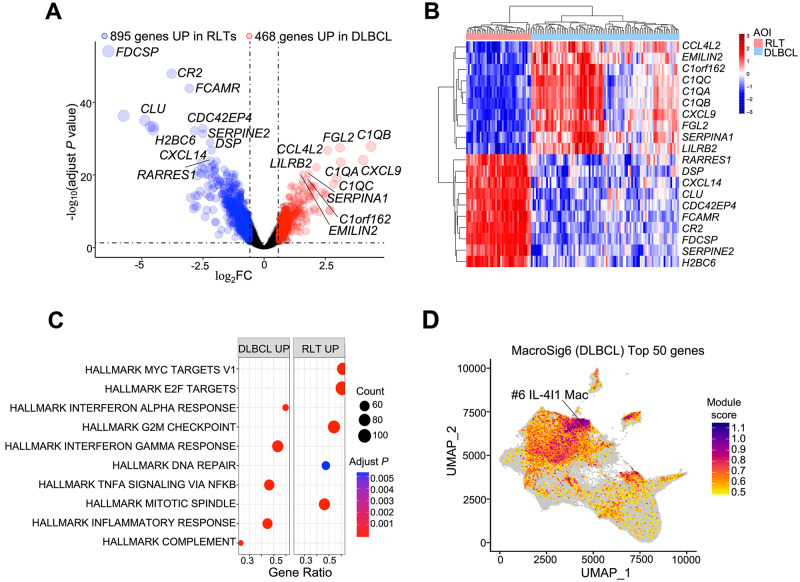
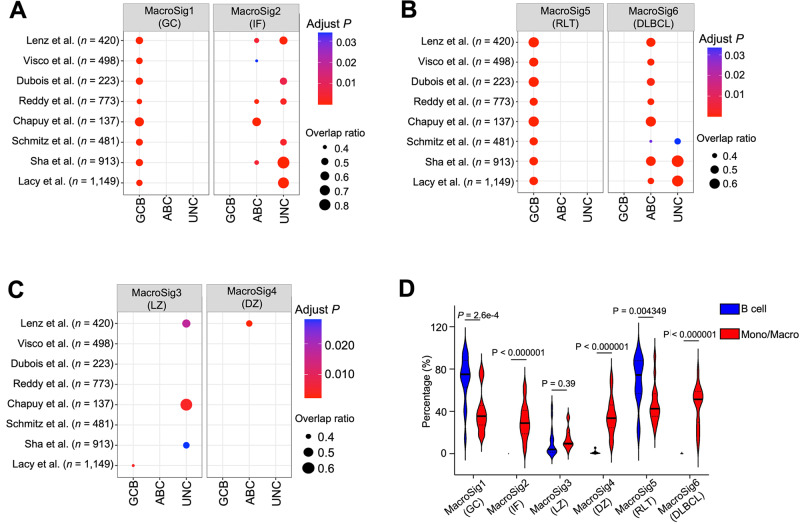
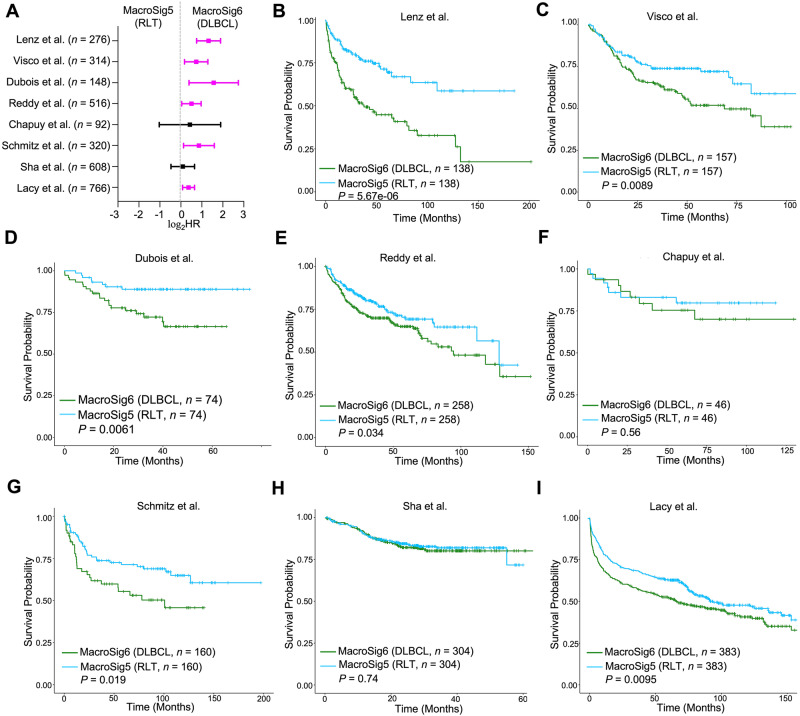
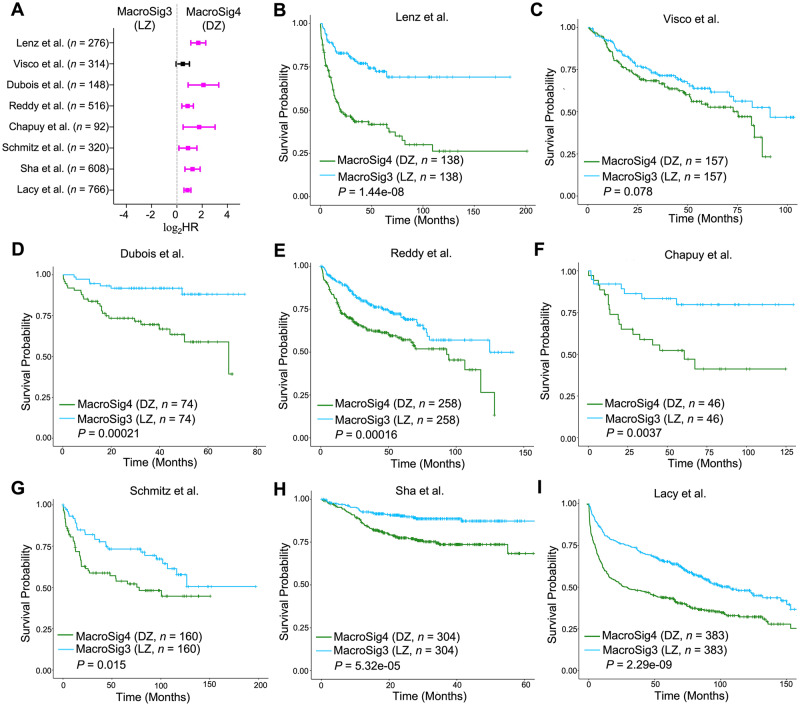
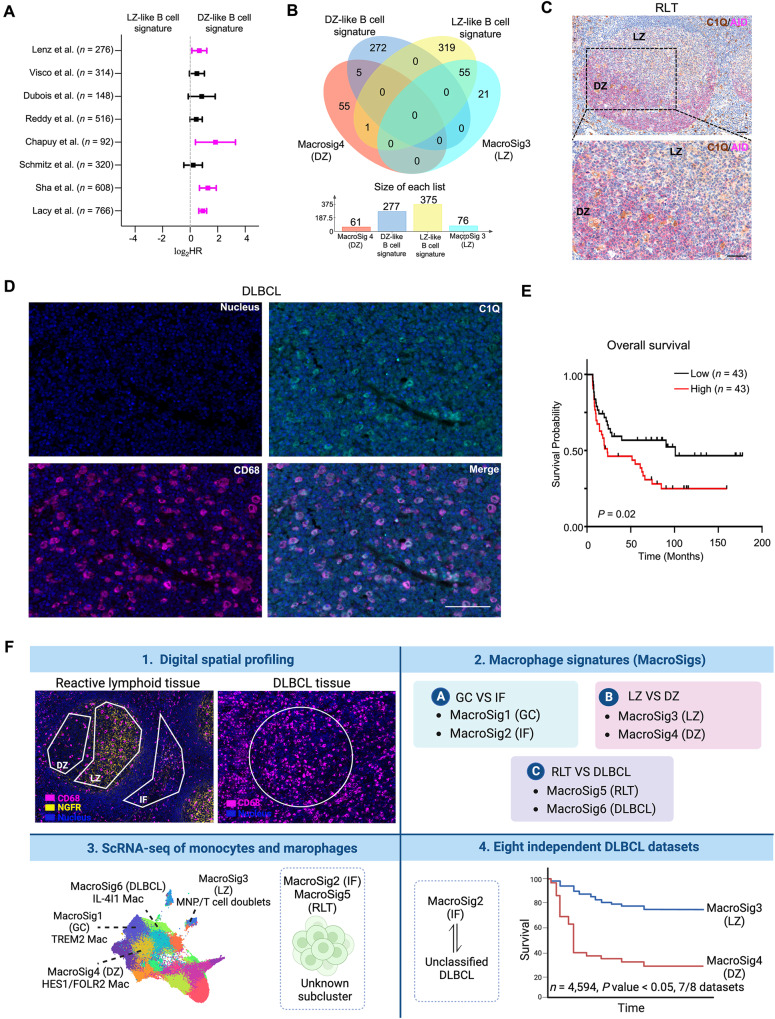
Macrophages are abundant immune cells in the microenvironment of diffuse large B-cell lymphoma (DLBCL). Macrophage estimation by immunohistochemistry shows varying prognostic significance across studies in DLBCL, and does not provide a comprehensive analysis of macrophage subtypes. Here, using digital spatial profiling with whole transcriptome analysis of CD68+ cells, we characterize macrophages in distinct spatial niches of reactive lymphoid tissues (RLTs) and DLBCL. We reveal transcriptomic differences between macrophages within RLTs (light zone /dark zone, germinal center/ interfollicular), and between disease states (RLTs/ DLBCL), which we then use to generate six spatially-derived macrophage signatures (MacroSigs). We proceed to interrogate these MacroSigs in macrophage and DLBCL single-cell RNA-sequencing datasets, and in gene-expression data from multiple DLBCL cohorts. We show that specific MacroSigs are associated with cell-of-origin subtypes and overall survival in DLBCL. This study provides a spatially-resolved whole-transcriptome atlas of macrophages in reactive and malignant lymphoid tissues, showing biological and clinical significance.


Conflict of interest statement

A.D.J. has received consultancy fees from DKSH/Beigene, Roche, Gilead, Turbine Ltd, AstraZeneca, Antengene, Janssen, MSD and IQVIA; and research funding from Janssen and AstraZeneca. The other co-authors have no conflicts of interest to declare.

Figures

Fig. 1
Fig. 1. Digital spatial profiling (DSP) illuminates consistent profiles from distinct masks in lymphoid tissue microregions.
A Schematic of GeoMx® DSP WTA workflow (created with BioRender.com). B, C Immunofluorescence staining of DLBCL tissues (n = 87) and RLTs (n = 24). In Group 1, CD68 stained macrophages (yellow), CD3 stained T cells (cyan), CD20 stained B cells (magenta), and SYTO 13 stained nuclei (blue). In Group 2, CD68 stained macrophages (yellow), NGFR illuminated LZ (green) and SYTO 13 stains nuclei (blue). After ROI selection, each cell type was segmented based on the staining signal and their corresponding masks were generated. Representative images are shown. Scale bar: 100 μm. Source data are provided as a Source Data file. D, E Cumulative density functions showed that the signatures of macrophages (CD68, CD163, FCGR1A, and CSF1R), T cells (CD3D, CD3E, UBASH3A, CD2, and TRBC2), and B cells (MS4A1, CD79A, CD79B, CD19, and PAX5) were highly enriched in CD68+ regions, CD3+ regions, and CD20+ regions, respectively in RLTs and DLBCL tissues (Kolmogorov-Smirnov P < 0.05). Digital spatial profiling, DSP; whole transcriptome analysis, WTA; diffuse large B-cell lymphoma, DLBCL; reactive lymphoid tissues, RLTs; regions of interest, ROIs; areas of interest, AOIs; formalin-fixed paraffin-embedded, FFPE; light zone, LZ; dark zone, DZ; nerve growth factor receptor, NGFR.
Fig. 2
Fig. 2. Unique gene expression patterns differentiate macrophages in distinct spatial locations within reactive lymphoid tissues.
A Volcano plot showing the DEGs of macrophages between the GC and IF based on adjusted P < 0.05 and |log2FC| ≥ 0.58. P values were determined by two tailed moderated t test (BH corrected). B Top 20 macrophage DEGs (10 DEGs upregulated in GC and 10 DEGs upregulated in IF) are displayed based on adjusted P value in the heatmap. C Pathway enrichment analysis was performed on all DEGs between GC and IF. P value calculated by two tailed Fisher exact test (BH corrected). The top 10 pathways, based on BH adjusted P value, are shown. D The volcano plot showed the macrophage DEGs between LZ and DZ based on adjusted P < 0.05 and |log2FC| ≥ 0.58. P values were determined by two tailed moderated t test (BH corrected). E Pathway enrichment analysis was performed on all macrophage DEGs between LZ and DZ. P values were calculated by two tailed Fisher exact test (BH corrected). F MoMac-VERSE annotated 17 TAM subclusters using a compilation of 41 scRNA-seq datasets from 13 healthy and cancer tissues (Figure created via [https://macroverse.gustaveroussy.fr/2021_MoMac_VERSE/]). GJ Top50 genes of each MacroSig1-4 were projected respectively onto MoMac-VERSE. Germinal center, GC; interfollicular, IF; fold change, FC; macrophage signatures, MacroSigs.
Fig. 3
Fig. 3. Distinct transcriptomic profiles of macrophages between reactive and malignant lymphoid tissue.
A Volcano plot showing the macrophage DEGs between RLTs and DLBCL based on adjusted P < 0.05 and |log2FC| ≥ 0.58. P values were determined by two tailed moderated t test (BH corrected). B Top DEGs between RLTs and DLBCL are displayed in the heatmap. C Pathway enrichment analysis was performed on all macrophage DEGs between GC and DLBCL. P values were calculated by two tailed Fisher exact test (BH corrected). The top 10 pathways, based on adjusted P are shown. D Top50 genes of MacroSig6 (DLBCL) were projected onto MoMac-VERSE.
Fig. 4
Fig. 4. Spatially-derived MacroSigs associate with COO DLBCL subclassifications.
The associations of MacroSigs with clinical categories (i.e., COO, genetic subtypes) were evaluated through the Fisher exact test. The overlap ratio refers to the number of patients classified as both a certain MacroSig and COO category, divided by the total number of patients classified in that particular COO category. A MacroSig1 (GC) and MacroSig2 (IF) were enriched in DLBCL COO classifications in bulk RNA gene expression profiles of DLBCL patients across eight publicly available transcriptomic datasets (n = 4594, 8 datasets). B MacroSig5 (RLT) and MacroSig6 (DLBCL) were enriched in DLBCL COO classifications in the above-mentioned eight datasets. C MacroSig3 (LZ) and MacroSig4 (DZ) were not distinctly enriched in any COO category in the above-mentioned eight datasets. D All genes of each MacroSig, through their respective module scores, were projected onto the Monocyte/Macrophage and B cell subsets of DLBCL scRNA-seq datasets (Ye et al; n = 17). The violin plot depicts, for each patient, the percentage of B cells and macrophages expressing a given MacroSig (module score > 0.1) The median and quartile bands are depicted. P values were calculated by a paired t test (see also Supplementary Figs. 5 and 6). Source data are provided as a Source Data file. Germinal center B-cell like, GCB; activated B-cell like, ABC; unclassified, UNC; monocyte/macrophage, Mono/Mac.
Fig. 5
Fig. 5. Spatially-derived MacroSig5/6 (RLT/DLBCL) stratify for patient survival in DLBCL datasets.
A Forest plot depicting the univariate Cox proportional hazards model analysis, comparing MacroSig5 (RLT) and MacroSig6 (DLBCL) (represented as tertile groups, as described in Methods: Survival analysis). Analysis applied to bulk RNA gene expression profiles of DLBCL patients across eight publicly available transcriptomic datasets (n = 4594, 8 datasets). Data are presented as the 95% confidence interval of the hazard ratio (plotted in log-scale). Source data are provided as a Source Data file. BI Kaplan–Meier analyses showed that patients with high expression of MacroSig6 (DLBCL) and low expression of MacroSig5 (RLT) were associated with poor OS across six distinct DLBCL datasets. P values generated by log-rank test. Overall survival, OS (see Methods: Survival analysis).
Fig. 6
Fig. 6. Spatially-derived MacroSig3/4 (LZ/DZ) stratify for patient survival in DLBCL datasets.
A Forest plot depicting the univariate Cox proportional hazards model analysis, comparing MacroSig3 (LZ) and MacroSig4 (DZ) (represented as tertile groups, as described in Methods: Survival analysis). Analysis was applied to bulk RNA gene expression profiles of DLBCL patients across eight publicly available transcriptomic datasets (n = 4594, 8 datasets). Data are presented as the 95% confidence interval of the hazard ratio (plotted in log-scale). Source data are provided as a Source Data file. BI Kaplan–Meier analyses showed that patients with high expression of MacroSig4 (DZ) and low expression of MacroSig3 (LZ) were associated with poor OS in DLBCL patients across seven distinct DLBCL datasets. P value generated by log-rank test.
Fig. 7
Fig. 7. Additional evaluation of the Dark Zone MacroSig hallmark C1Q in DLBCL.
A Forest plot depicting the univariate Cox proportional hazards model analysis, comparing B cell-based LZ and DZ signatures (represented as tertile groups, as described in Methods: Survival analysis). Analysis applied to bulk RNA gene expression profiles of DLBCL patients across eight publicly available transcriptomic datasets (n = 4594, 8 datasets). Data are presented as the 95% confidence interval of the hazard ratio (plotted in log-scale). Source data are provided as a Source Data file. B Venn diagram displaying the overlapping genes of LZ-, DZ-like B-cell signatures, and MacroSig3-4 (LZ and DZ). C Immunochemistry staining of RLTs was shown (n = 3). Activation-induced cytidine deaminase (AID) in magenta was used for illuminating the LZ and DZ. C1Q in brown stained macrophages. Scale bar: 100 μm. Source data are provided as a Source Data file. D Immunofluorescence stained CD68 + C1Q+ cells in DLBCL tissues (n = 86). Representative images are shown. Scale bar: 100 μm. Source data are provided as a Source Data file. E Kaplan–Meier analyses showed that patients with highly infiltrating levels of CD68 + C1Q+ cells were associated with poor OS in DLBCL patients in CMMC cohort. P value generated by log-rank test. F Graphical abstract summarizing the derivation of the spatial derived MacroSigs and describing their associations with known features of macrophage/ DLBCL biology and clinical outcome (created with BioRender.com).

Similar articles

Cited by

References

    1. Siegel RL, et al. Cancer statistics, 2022. CA Cancer J. Clin. 2022;72:7–33. doi: 10.3322/caac.21708. - DOI - PubMed
    1. Martelli M, et al. Diffuse large B-cell lymphoma. Crit. Rev. Oncol. Hematol. 2013;87:146–171. doi: 10.1016/j.critrevonc.2012.12.009. - DOI - PubMed
    1. Coiffier B, et al. Long-term outcome of patients in the LNH-98.5 trial, the first randomized study comparing rituximab-CHOP to standard CHOP chemotherapy in DLBCL patients: a study by the Groupe d’Etudes des Lymphomes de l’Adulte. Blood. 2010;116:2040–2045. doi: 10.1182/blood-2010-03-276246. - DOI - PMC - PubMed
    1. Scott DW, Gascoyne RD. The tumour microenvironment in B cell lymphomas. Nat. Rev. Cancer. 2014;14:517–534. doi: 10.1038/nrc3774. - DOI - PubMed
    1. Kotlov N, et al. Clinical and biological subtypes of B-cell lymphoma revealed by microenvironmental signatures. Cancer Discov. 2021;11:1468–1489. doi: 10.1158/2159-8290.CD-20-0839. - DOI - PMC - PubMed