. 2024 Mar 8;15(1):2146.
doi: 10.1038/s41467-024-46489-0.

The defensome of complex bacterial communities

Affiliations

The defensome of complex bacterial communities

Angelina Beavogui et al. Nat Commun. .

Abstract

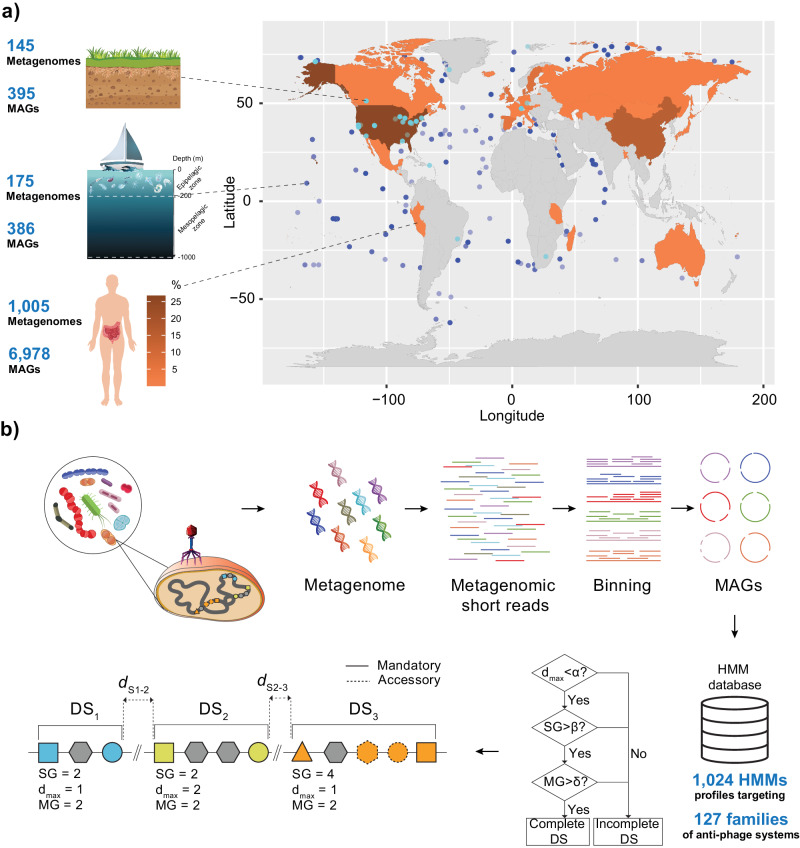
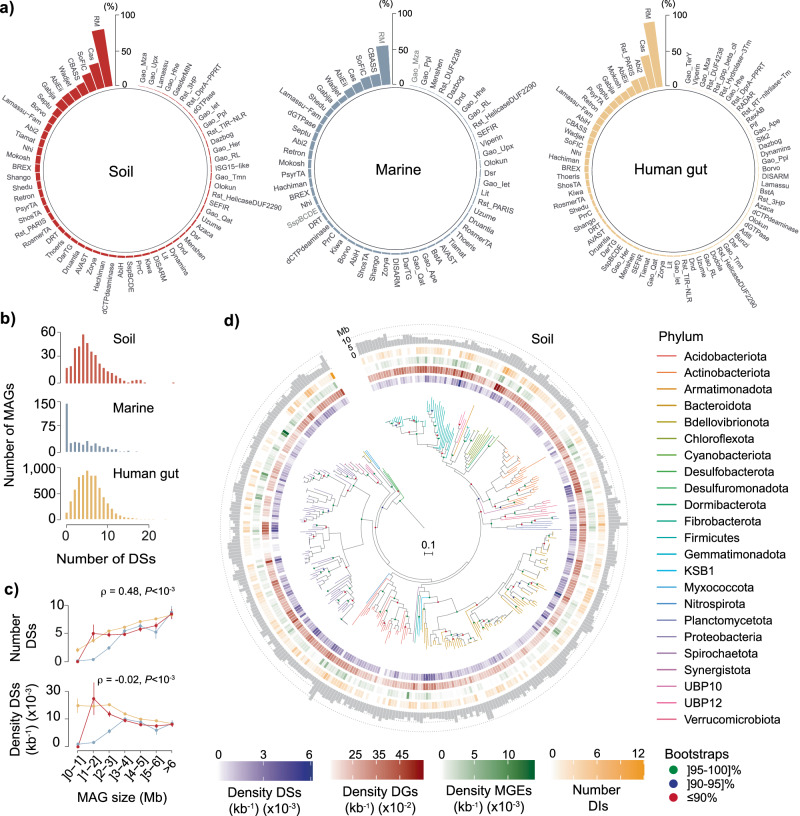
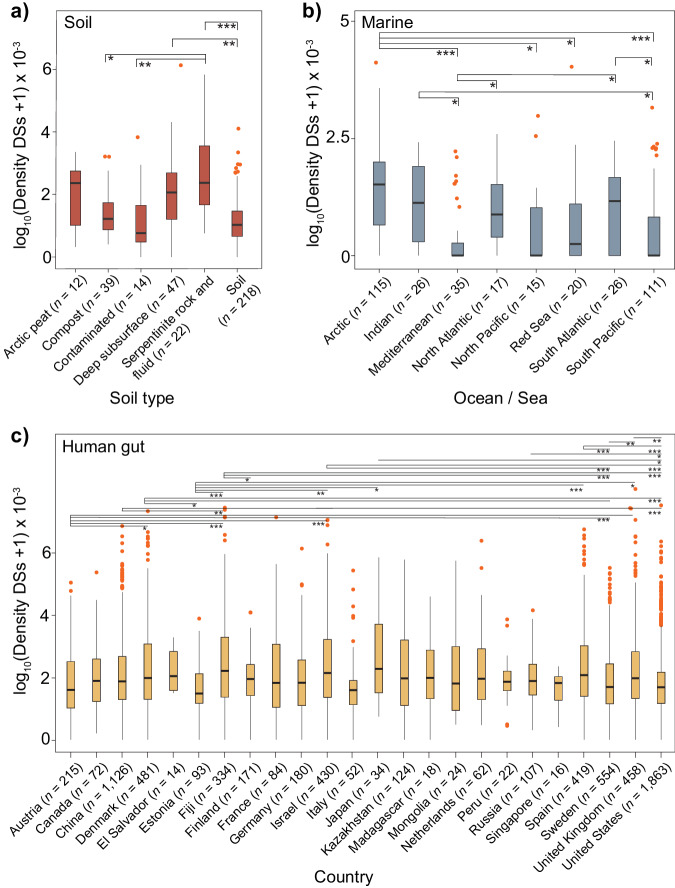
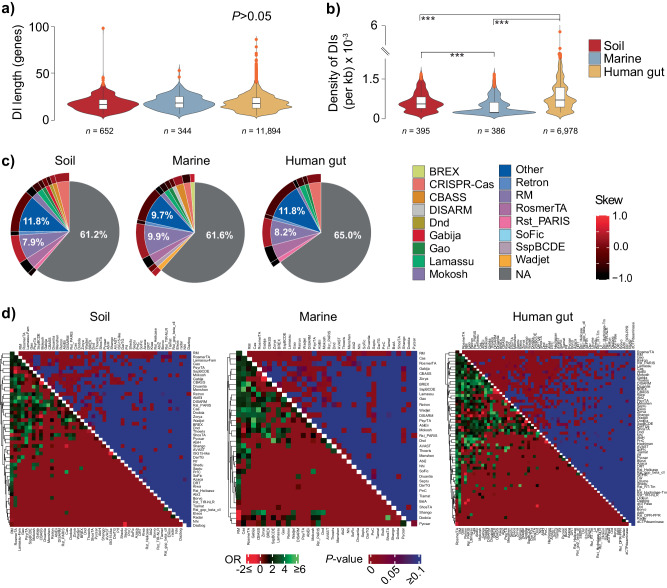
Bacteria have developed various defense mechanisms to avoid infection and killing in response to the fast evolution and turnover of viruses and other genetic parasites. Such pan-immune system (defensome) encompasses a growing number of defense lines that include well-studied innate and adaptive systems such as restriction-modification, CRISPR-Cas and abortive infection, but also newly found ones whose mechanisms are still poorly understood. While the abundance and distribution of defense systems is well-known in complete and culturable genomes, there is a void in our understanding of their diversity and richness in complex microbial communities. Here we performed a large-scale in-depth analysis of the defensomes of 7759 high-quality bacterial population genomes reconstructed from soil, marine, and human gut environments. We observed a wide variation in the frequency and nature of the defensome among large phyla, which correlated with lifestyle, genome size, habitat, and geographic background. The defensome's genetic mobility, its clustering in defense islands, and genetic variability was found to be system-specific and shaped by the bacterial environment. Hence, our results provide a detailed picture of the multiple immune barriers present in environmentally distinct bacterial communities and set the stage for subsequent identification of novel and ingenious strategies of diversification among uncultivated microbes.


Conflict of interest statement

The authors declare no competing interests.

Figures

Fig. 1
Fig. 1. Defensome analysis.
a Our analyses focused on 7759 high-quality near-complete MAGs recovered from three distinct ecosystems: soil, marine, and human gut. The geographical distribution of soil and marine sample collection sites is shown in the world map, as well as the percentage of human gut samples recovered from each country (shown as a colored heatmap). Our dataset includes at least 385 Genera (corresponding to a total of 7593 MAGs) and 25 Classes (corresponding to a total of 93 MAGs) not previously covered in a recent study focusing on the defensome of the NCBI RefSeq prokaryotic database. b A collection of 1024 HMM profiles targeting 127 families of anti-MGE defense systems from DefenseFinder, was used to query the entire MAG dataset. Briefly, this was performed by means of genetic organization rules allowing for two types of genetic components: “mandatory” and “accessory” (as described previously). Given the wide diversity of genetic organization of anti-MGE systems, rules were written differently for different types of systems. Shown is an example of a genomic region containing three defense systems (DS1-DS3), respectively characterized by a total sum of genes (SG), a maximum distance between defense genes (dmax), and a given number of mandatory genes (MG), which will allow disentangling between complete or incomplete defense systems based on established thresholds (α, β, δ). Source data are provided as a Source Data file. Image credits (copyright-free) for panels (a, b): soil (brgfx/Freepik), boat (rawpixel.com/Freepik), plankton (macrovector/Freepik), body/intestines (brgfx/Freepik), bacteria (macrovector_official/Freepik), and phage (Matt Cole/Vecteezy).
Fig. 2
Fig. 2. Abundance and distribution of defense systems in MAGs.
a Percentage of soil, marine, and human gut MAGs harboring each family of defense system. b Distribution of the number of defense systems (DSs, per MAG) across environments. c Variation of number and density (per MAG and per kb) of defense systems (DSs) with MAG size (Mb) for each biome (n = 395, 386, and 6978 MAGs from soil, marine, and human gut environments, respectively). Error bars represent standard deviations of the mean, and correlation was evaluated by a two-sided Spearman’s rank test. d Phylogenetic representation of 373 soil MAGs, their corresponding phyla, density (per kb) of defense systems (DSs, purple), defense genes (DGs, red), MGEs (green), and number of defense islands (DIs, yellow). The distribution of MAG sizes (Mb) are shown as outer layer barplots. All data corresponds to analyses performed in assemblies with values of N50 ≥ 100 kb. Source data are provided as a Source Data file.
Fig. 3
Fig. 3. Defensome variation across different ecological and geographical backgrounds.
Defense system (DS) density (per MAG per kb) across distinct ecological (soil, marine) (a, b) and geographical (human gut) (c) contexts. Boxplots represent the 25th to 75th percentiles, the inner black line marks the median, whiskers extend to 1.5x the interquartile range, and data points are set as outliers. Significance was tested by a two-sided Mann–Whitney–Wilcoxon test and P values are indicated as *P < 0.05; **P < 10−2; ***P < 10−3. The number of MAGs analyzed are shown in parentheses. Source data are provided as a Source Data file.
Fig. 4
Fig. 4. The genetic mobility of the defensome.
a Genomic colocalization of defense genes and MGEs. The number of MAGs analyzed are shown as n values. b Genomic colocalization of defense genes with plasmids, prophages, and ICEs/IMEs. c Heatmap of observed/expected (O/E) ratios of colocalization between genes belonging to distinct defense families and MGEs. Expected values were obtained by multiplying the total number of genes pertaining to a given defense family by the fraction of defense genes of that family assigned to each MGE. Dark gray squares represent the absence of colocalization. Significance was tested by a two-sided Chi-square test. Boxplots represent the 25th to 75th percentiles, the inner black line marks the median, whiskers extend to 1.5x the interquartile range, and data points are set as outliers. Significance was tested by a two-sided Mann–Whitney–Wilcoxon test. P values are indicated as ***P < 10−3. Source data are provided as a Source Data file.
Fig. 5
Fig. 5. The MAG defense island repertoire.
a Defense island (DI) length distribution (given in genes) in soil, marine, and human gut MAGs. The number of DIs analyzed are shown as n. b Density distribution of DIs (per MAG per kb) across each environment. The number of MAGs analyzed are shown as n values. c Pie-plots of the relative abundance (%) of gene content in defense islands. Colored slices correspond to defense genes (those with a relative abundance <1% were merged as ‘Other’), and gray slices (NA) correspond to genes not classified as defensive by DefenseFinder. The outer layer corresponds to the skew ratio between genes belonging to complete and incomplete systems given by #genesbelongingtocompletesystems#genesbelongingtoincompletesystems#genesbelongingtocompletesystems+#genesbelongingtoincompletesystems. d Defense families’ odds ratio (OR) of colocalization in defense islands (bottom heatmaps) and associated two-sided Fisher’s exact test P value (upper heatmaps) for the three environments. To eliminate the confounding (inflating) effect of colocalized genes pertaining to the same system, we only considered solitary genes or those pertaining to independent defense systems distanced of 5 genes or less. Boxplots represent the 25th to 75th percentiles, the inner black line marks the median, whiskers extend to 1.5x the interquartile range, and data points are set as outliers. Significance was tested by a two-sided Mann–Whitney–Wilcoxon test. P values are indicated as ***P < 10−3. Source data are provided as a Source Data file.
Fig. 6
Fig. 6. The genetic variability of the defensome.
a Ninety metagenomes (30 for each environment) having a broad representativity in terms of sampling sites (soil and marine) and countries (human gut), as well as in terms of the presence of most defense families previously identified by DefenseFinder were selected. Shown in circles are the observed/expected (O/E) ratios of the number of defense genes harboring high-frequency SNPs + indels (25% at the variant position) in their gene body (including 200 bp upstream of the start codon). Expected values were obtained by multiplying the total number of genes pertaining to a given defense family by the fraction of defense genes of that family harboring high-frequency alleles. The circle radius corresponds to the total number of defense genes analyzed per family. To ease visualization, we limited the figure to defense families for which at least one defense gene showed an O/E ratio 1.5 per environment. The complete representation is shown in Supplementary Fig. 10. Significance was tested by a two-sided Chi-square test. b Density distribution of SNPs + indels for a selection of defense genes showing the highest O/E values in (a). Information on mutation type, location, and phylum are indicated in pie-plots. The number of genes analyzed is shown in parentheses. Boxplots represent the 25th to 75th percentiles, the inner black line marks the median, whiskers extend to 1.5x the interquartile range, and data points are set as outliers. Significance was tested by a two-sided Mann–Whitney–Wilcoxon test. P values are indicated as ***P < 10−3; ns not significant. Source data are provided as a Source Data file.

Similar articles

Cited by

References

    1. Haudiquet M, de Sousa JM, Touchon M, Rocha EPC. Selfish, promiscuous and sometimes useful: how mobile genetic elements drive horizontal gene transfer in microbial populations. Philos. Trans. R. Soc. B Biol. Sci. 2022;377:20210234. doi: 10.1098/rstb.2021.0234. - DOI - PMC - PubMed
    1. Oliveira PH, Touchon M, Rocha EPC. Regulation of genetic flux between bacteria by restriction–modification systems. Proc. Natl Acad. Sci. USA. 2016;113:5658–5663. doi: 10.1073/pnas.1603257113. - DOI - PMC - PubMed
    1. Doron S, et al. Systematic discovery of antiphage defense systems in the microbial pangenome. Science. 2018;359:eaar4120. doi: 10.1126/science.aar4120. - DOI - PMC - PubMed
    1. Millman A, et al. An expanded arsenal of immune systems that protect bacteria from phages. Cell Host Microbe. 2022;30:1556–1569.e5. doi: 10.1016/j.chom.2022.09.017. - DOI - PubMed
    1. Bernheim A, Sorek R. The pan-immune system of bacteria: antiviral defence as a community resource. Nat. Rev. Microbiol. 2020;18:113–119. doi: 10.1038/s41579-019-0278-2. - DOI - PubMed