. 2024 Mar 8;15(1):2142.
doi: 10.1038/s41467-024-46463-w.

Activity-dependent compartmentalization of dendritic mitochondria morphology through local regulation of fusion-fission balance in neurons in vivo

Affiliations

Activity-dependent compartmentalization of dendritic mitochondria morphology through local regulation of fusion-fission balance in neurons in vivo

Daniel M Virga et al. Nat Commun. .

Abstract

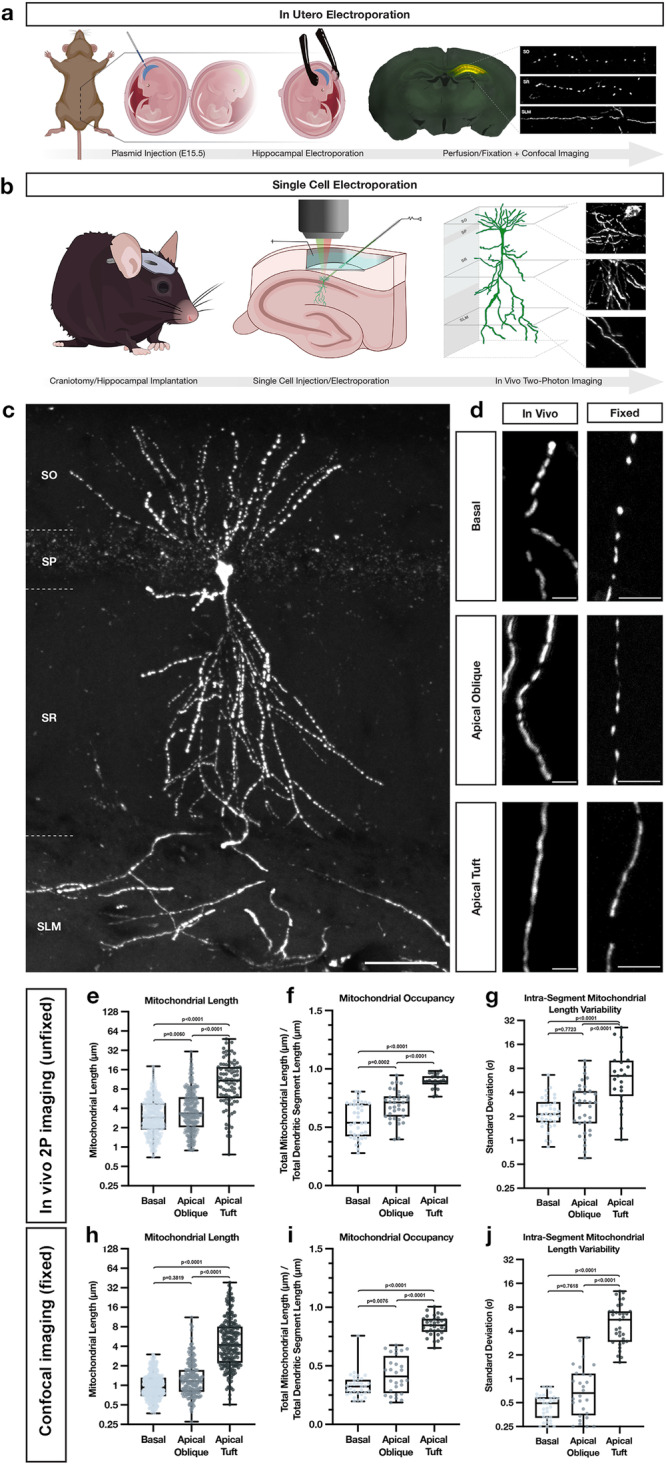
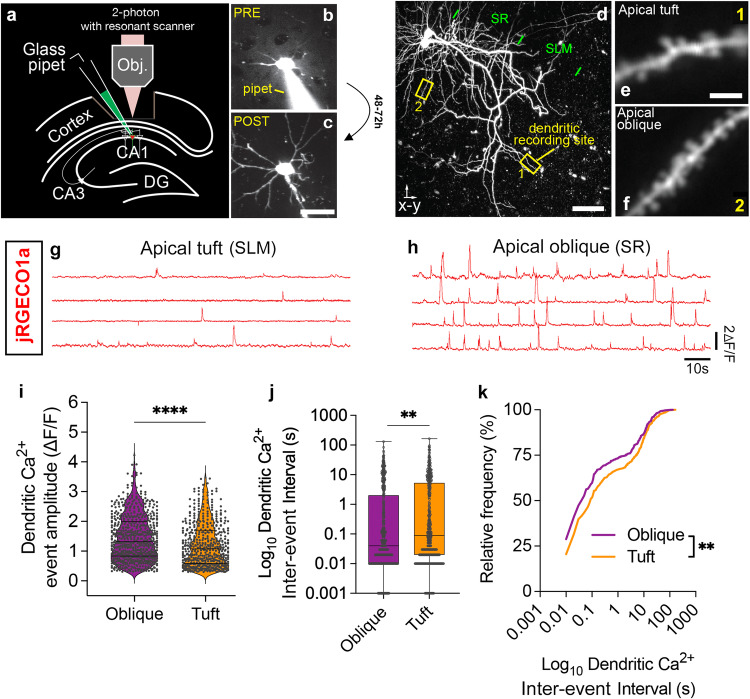
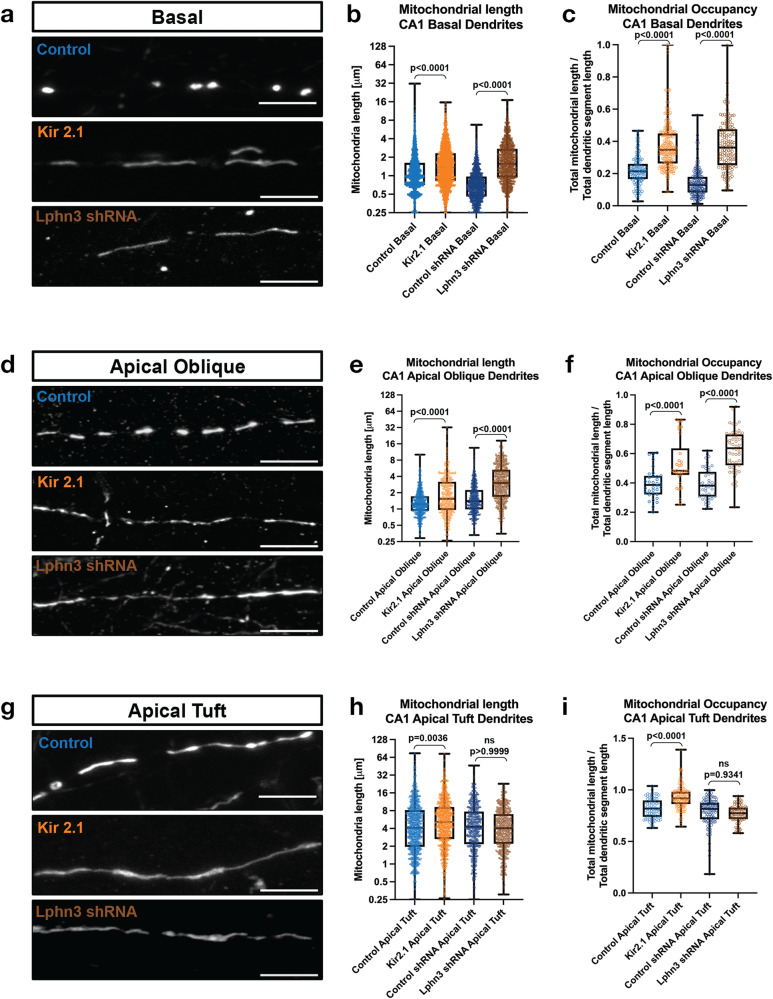
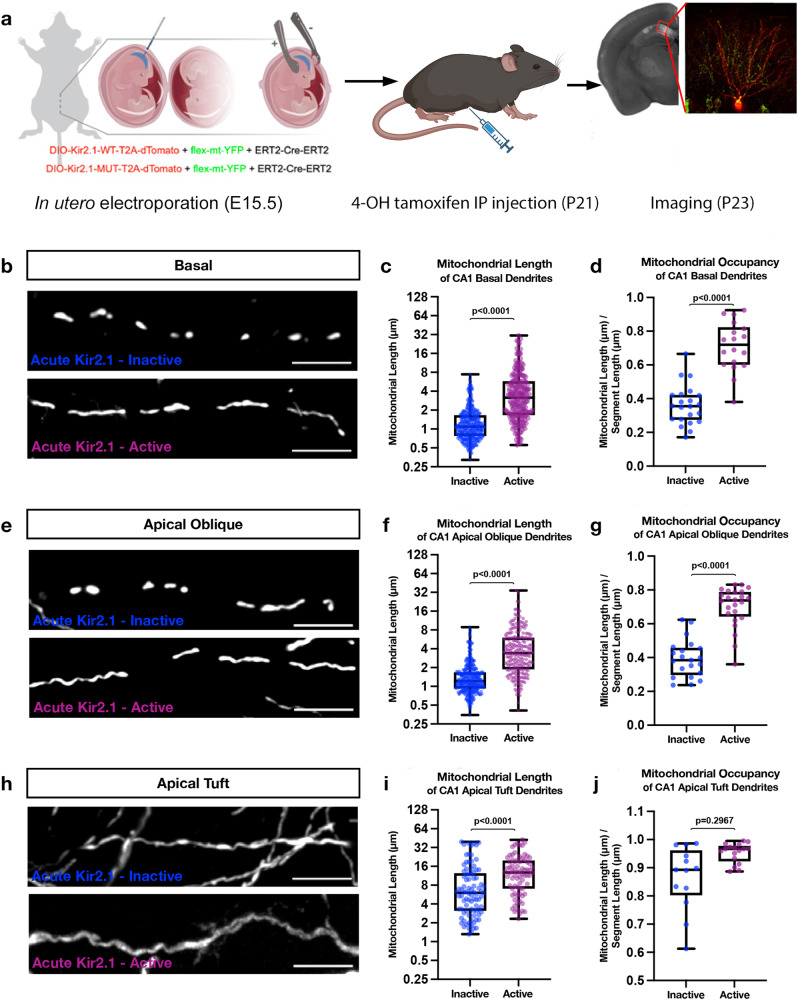
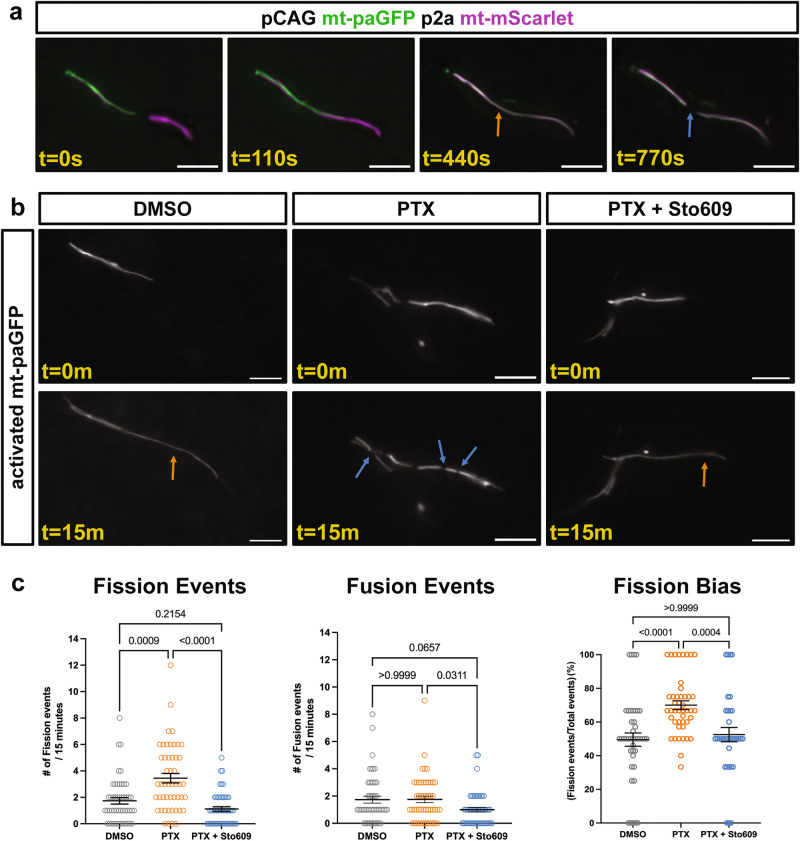
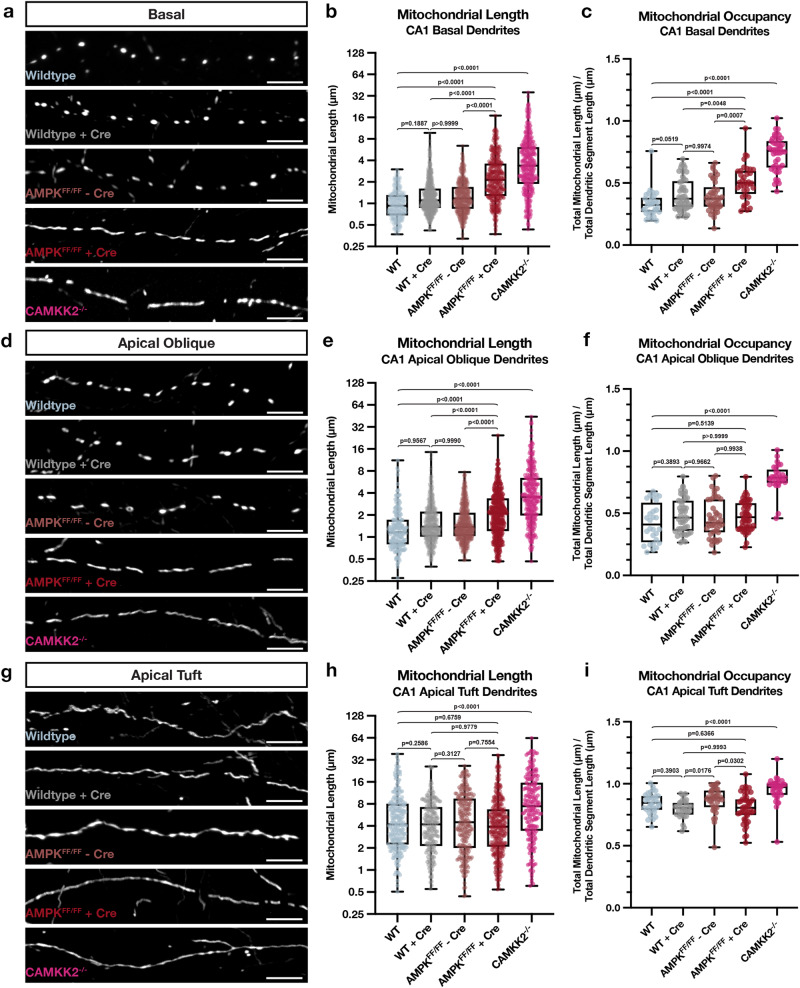
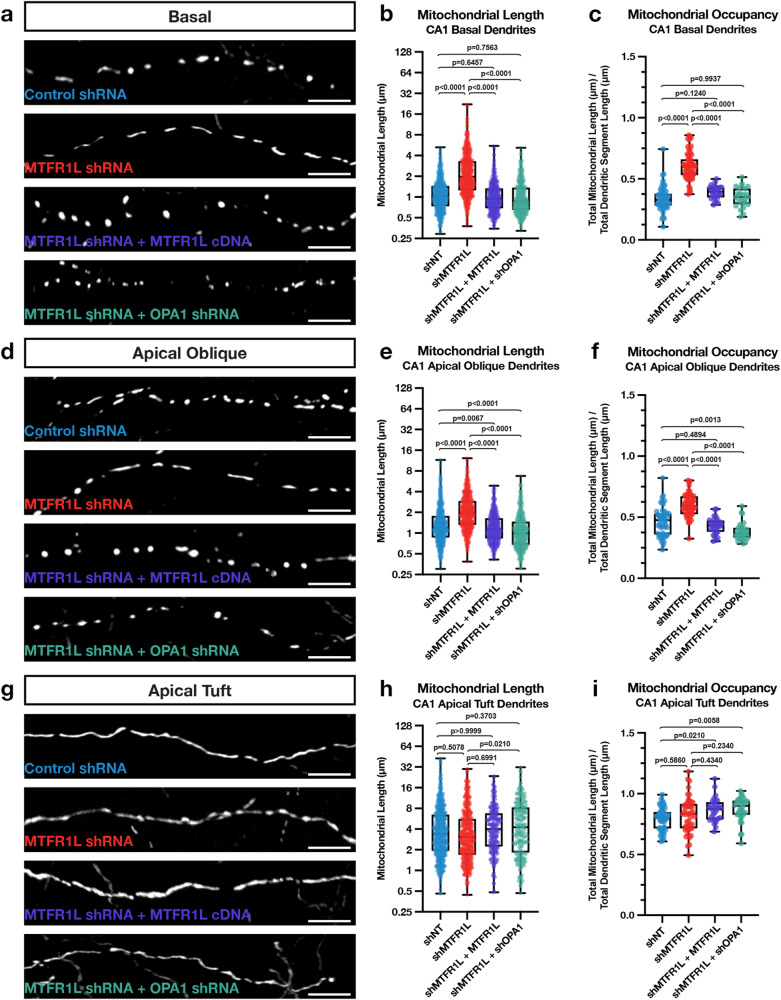
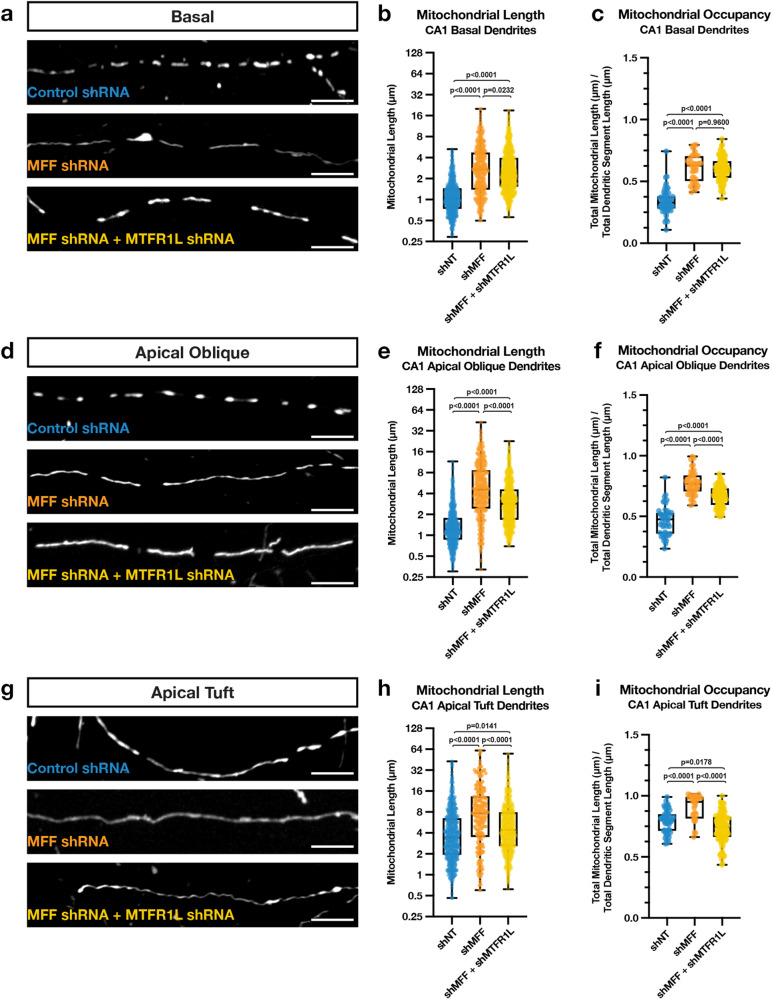
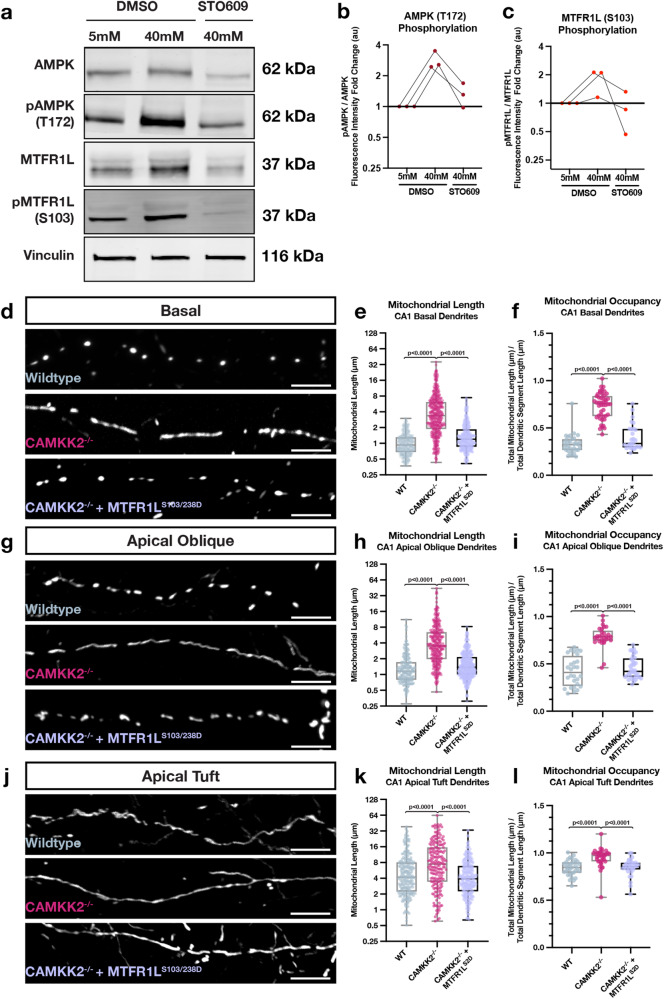
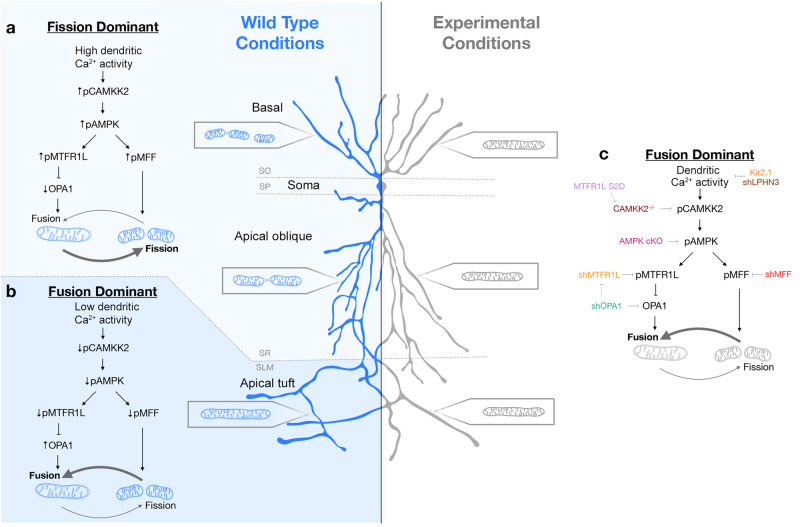
Neuronal mitochondria play important roles beyond ATP generation, including Ca2+ uptake, and therefore have instructive roles in synaptic function and neuronal response properties. Mitochondrial morphology differs significantly between the axon and dendrites of a given neuronal subtype, but in CA1 pyramidal neurons (PNs) of the hippocampus, mitochondria within the dendritic arbor also display a remarkable degree of subcellular, layer-specific compartmentalization. In the dendrites of these neurons, mitochondria morphology ranges from highly fused and elongated in the apical tuft, to more fragmented in the apical oblique and basal dendritic compartments, and thus occupy a smaller fraction of dendritic volume than in the apical tuft. However, the molecular mechanisms underlying this striking degree of subcellular compartmentalization of mitochondria morphology are unknown, precluding the assessment of its impact on neuronal function. Here, we demonstrate that this compartment-specific morphology of dendritic mitochondria requires activity-dependent, Ca2+ and Camkk2-dependent activation of AMPK and its ability to phosphorylate two direct effectors: the pro-fission Drp1 receptor Mff and the recently identified anti-fusion, Opa1-inhibiting protein, Mtfr1l. Our study uncovers a signaling pathway underlying the subcellular compartmentalization of mitochondrial morphology in dendrites of neurons in vivo through spatially precise and activity-dependent regulation of mitochondria fission/fusion balance.


Conflict of interest statement

The authors declare no competing interests.

Figures

Fig. 1
Fig. 1. Mitochondria display highly compartmentalized, layer-specific, morphology in dendrites of CA1 PNs in vivo.
a Schematic of in utero electroporation (IUE) procedure used to sparsely express fluorescent reporters, cDNAs or shRNAs in CA1 PNs of the hippocampus. b Schematic of single cell electroporation (SCE), used to express fluorescent reporters into single adult CA1 pyramidal neurons in the hippocampus. This method allows for rapid expression of plasmid DNA and in vivo two-photon visualization of individual neurons in an adult anesthetized mouse in vivo. Portions of (a) and (b) were created with BioRender.com. c Representative image of a single CA1 PN expressing a mitochondrial matrix reporter (mt-YFP) via SCE following fixation and re-imaged using confocal microscopy on a single vibratome section. Scale bar, 50 μm. d High-magnification representative images of dendrites from the three hippocampal compartments—basal (SO), apical oblique (SR), and apical tuft (SLM)—expressing a mitochondrial matrix marker (mt-YFP or mt-DsRed) imaged either in vivo using two-photon microscopy (left) or post-fixation with confocal microscopy (right). Scale bar, 5 μm. eg Quantification of individual mitochondrial length (e), mitochondrial segment occupancy (f), and intra-segment mitochondrial length variability (g) from basal, apical oblique, and apical tuft dendrites captured in vivo. (Basal: n = 422 mitochondria; n = 37 dendritic segments; mean length = 3.621 μm ± 0.124 (SEM); mean occupancy = 56.11% ± 2.49% (SEM); mean intra-segment variability = 2.420 μm ± 0.198 (SEM); Apical Oblique: n = 263 mitochondria; n = 35 dendritic segments; mean length = 4.719 μm ± 0.249 (SEM); mean occupancy = 68.82% ± 2.20% (SEM); mean intra-segment variability = 3.185 μm ± 0.370 (SEM); Apical Tuft: n = 90 mitochondria; n = 23 dendritic segments; mean length = 13.02 μm ± 1.041 (SEM); mean occupancy = 89.26% ± 1.24% (SEM); mean intra-segment variability = 8.018 μm ± 6.359 (SEM)). hj Quantification of individual mitochondrial length (h), mitochondrial segment occupancy (i), and intra-segment mitochondrial length variability (j) from basal, apical oblique, and apical tuft dendrites following fixation. (Basal: n = 313 mitochondria; n = 32 dendritic segments; mean length = 1.065 μm ± 0.029 (SEM); mean occupancy = 33.01% ± 1.84% (SEM); mean intra-segment variability = 0.4736 μm ± 0.030 (SEM); Apical Oblique: n = 184 mitochondria; n = 28 dendritic segments; mean length = 1.569 μm ± 0.104 (SEM); mean occupancy = 42.38% ± 2.98% (SEM); mean intra-segment variability = 0.9169 μm ± 0.149 (SEM); Apical Tuft: n = 226 mitochondria; n = 33 dendritic segments; mean length = 6.562 μm ± 0.437 (SEM); mean occupancy = 84.19% ± 1.44% (SEM); mean intra-segment variability = 5.695 μm ± 0.552 (SEM)). p values are indicated in the figure following a one way ANOVA with Sidak’s multiple comparisons test. Data are shown as individual points on box plots with 25th, 50th and 75th percentiles indicated with whiskers indicating min and max values.
Fig. 2
Fig. 2. Two-photon imaging in CA1 PNs in vivo reveals lower amplitude and frequency of Ca2+ transients in apical tuft dendrites compared to apical oblique dendrites.
ac Schema of single cell electroporation (SCE) in vivo using visually-guided somatic targeting (b, c) in CA1 PNs with a glass pipet containing a fluorescent dye (Alexa 488 in (b)) and a mix of plasmids encoding fluorescent protein (Venus in example shown in (c)). df Maximal z-projection following in vivo 2-photon imaging of two CA1 PNs neurons expressing genetically-encoded Ca2+ sensor jRGECO1a through SCE (d) showing the full extent of dendrites from the basal (SO) all the way to apical obliques (SR) and the apical tuft (SLM). Example of high magnification recording sites in the apical tuft (SLM in (e) – corresponding to box 1 in (d)) and in the apical oblique (SR in (f) – corresponding to box 2 in (d)). Individual dendritic spines can be observed. g, h Representative traces from jRGECO1a fluorescence showing individual Ca2+ transients isolated from the dendritic shaft of segments in the apical tuft (SLM in (g)) and the apical oblique domains (SR in (h)). Quantification of dendritic Ca2+ transient amplitude (i) and inter-event intervals (inverse of frequency) shown as box plots (j) or cumulative frequency (k). Statistical analysis: (i) **** p < 0.0001 according to two-tailed, Mann-Whitney non-parametric test. Data shown as violin plot with individual points shown. j, k ** p = 0.003 according to Kolmogorov-Smirnov non-parametric test. n = 632 events for oblique (from 51 dendritic segments imaged) and n = 508 events for tuft (from 47 dendritic segments imaged) in total of 11 CA1 PNs. Scale bars: 20 microns in (b) and (c); 50 microns in (d); 2 microns in (e) and (f). Data are shown as individual points on box plots with 25th, 50th and 75th percentiles indicated with whiskers indicating min and max values.
Fig. 3
Fig. 3. Neuronal activity regulates mitochondrial size in a compartment specific manner in CA1 pyramidal neurons in vivo.
ai High magnification representative images of mitochondrial morphology within isolated secondary or tertiary hippocampal CA1 (a) basal, (d) apical oblique, and (g) apical tuft dendrites in which a mitochondrial matrix-targeted fluorescent protein (mt-YFP) was IUE along with either a control plasmid (pCAG tdTomato) or pCAG Kir2.1-T2A-tdTomato), or either control shRNA or Lphn3 shRNA plasmid. Quantification of mitochondrial length and occupancy in the (b) and (c) basal, (e) and (f) apical oblique, and (h) and (i) apical tuft dendritic compartments following Kir2.1 over-expression or shRNA-mediated knockdown of Lphn3. Quantification of mitochondrial length (b), (e), and (h) and mitochondrial occupancy (c, f and i) in basal dendrites (b, c), apical oblique (e, f) and apical tuft (h, i) demonstrates that both Kir2.1 over-expression and Lphn3 knockdown significantly increases mitochondrial length and occupancy in basal (b, c) and apical oblique dendrites (e, f). ControltdTomato-basal = 127 segments, 2154 mitochondria, mean length = 1.42 µm ± 0.03 µm (SEM), mean occupancy = 21.8% ± 0.9% (SEM); ControltdTomato-apical oblique = 34 segments, 748 mitochondria, mean length = 1.49 µm ± 0.04 µm, mean occupancy = 39.4% ± 1.0%; ControltdTomato-apical tuft = 75 segments, 1036 mitochondria, mean length = 6.48 µm ± 0.23 µm, mean occupancy = 81.9% ± 1.1%; Kir2.1tdTomato-basal = 206 segments, 2278 mitochondria, mean length = 1.87 µm ± 0.03 µm, mean occupancy = 37.8% ± 1.0%; Kir2.1tdTomato-apical oblique = 30 segments, 435 mitochondria, mean length = 2.54 µm ± 0.14 µm, mean occupancy = 53.5% ± 2.9%; Kir2.1tdTomato-apical tuft = 128 segments, 965 mitochondria, mean length = 7.19 µm ± 0.22 µm, mean occupancy = 92.7% ± 1.0%; ControlshRNA-basal = 169 segments, 1344 mitochondria, mean length = 0.81 µm ± 0.01 µm, mean occupancy = 13.8% ± 0.6%; ControlshRNA-apical oblique = 45 segments, 633 mitochondria, mean length = 1.84 µm ± 0.05 µm, mean occupancy = 39% ± 1.6%; ControlshRNA-apical tuft = 106 segments, 617 mitochondria, mean length = 5.81 µm ± 0.20 µm, mean occupancy = 78.6% ± 1.2%; Lphn3shRNA-basal = 129 segments, 1169 mitochondria, mean length = 2.11 µm ± 0.04 µm, mean occupancy = 37.4% ± 1.3%; Lphn3shRNA-apical oblique = 53 segments, 573 mitochondria, mean length = 3.92 µm ± 0.12 µm, mean occupancy = 62.5% ± 1.9%; Lphn3shRNA-apical tuft = 84 segments, 561 mitochondria, mean length = 5.1 µm ± 0.16 µm, mean occupancy = 75.2% ± 0.9%. p values are indicated in the figure following a Kruskal-Wallis test. Data are shown as individual points on box plots with 25th, 50th and 75th percentiles indicated with whiskers indicating min and max values. Scale bar, 5 μm.
Fig. 4
Fig. 4. Acute silencing of CA1 PNs at P21 leads to elongated mitochondria across the dendritic arbor.
a Schematic representation of our experimental timeline with electroporation of an inducible ERT2-Cre-ERT2 along with either a mutated (inactive) or wild type (active) DIO-Kir2.1-T2A-dTomato and a flex-mt-YFP occurred on E15.5. Mice were then injected with 4-hydroxytamoxifen (4-OHT) at P21 and perfused, sliced, and imaged on P23. Low magnification image is of an induced Kir2.1-inactive cell with mt-YFP. Representative high magnification images of mitochondrial morphology within hippocampal CA1. Portions of (a) were created with BioRender.com. b Basal, e apical oblique, and h apical tuft dendrites. Quantification of the mitochondrial length and occupancy in the (c, d) basal, (f, g) apical oblique, and (i, j) apical tuft dendritic compartments reveal a significant increase in mitochondrial length (c) and occupancy (d) in basal dendrites when mature cells are silenced. A similar effect is seen in the apical tuft (f, g), however, while acute silencing leads to a significant increase in the length of mitochondria in the apical tuft (i) it does not alter the total proportion of the branch occupied by mitochondria (j). Basal Dendrites (Acute Kir2.1-inactive: n = 22 dendritic segments, 349 individual mitochondria, mean length = 1.403μm ± 0.307(SEM), mean occupancy = 36.12% ± 5.843%; Acute Kir2.1-active n = 19 dendritic segments, 218 individual mitochondria, mean length = 4.793 μm ± 0.055 (SEM), mean occupancy = 71.07% ± 5.69%.) Apical Oblique Dendrites (Acute Kir2.1-inactive: n = 21 dendritic segments, 341 individual mitochondria, mean length = 1.548 μm ± 0.303 (SEM), mean occupancy = 39.32% ± 4.278%; Acute Kir2.1-active: n = 24 dendritic segments, 232 individual mitochondria, mean length = 4.797 μm ± 0.016 (SEM), mean occupancy = 70.12% ± 5.827%.) Apical Tuft Dendrites (Acute Kir2.1-Mut: n = 13 dendritic segments, 89 individual mitochondria, mean length = 9.670 μm ± 1.109 (SEM), mean occupancy = 86.52% ± 7.34%; Acute Kir2.1-Mut: n = 17 dendritic segments, 76 individual mitochondria, mean length = 14.40 μm ± 1.04 (SEM), mean occupancy = 95.27% ± 12.15%.) p values are indicated in the figure following a one way ANOVA with Sidak’s multiple comparisons test. Data are shown as individual points on box plots with 25th, 50th and 75th percentiles indicated with whiskers indicating min and max values. Scalebar, 5 μm.
Fig. 5
Fig. 5. Neuronal activity induces mitochondrial fission that is blocked by the Camkk2 inhibitor STO609.
a Mitochondrial fission and fusion was visualized in dendrites of primary cortical pyramidal neurons electroporated with a plasmid encoding matrix targeted photo-activatable GFP (mt-paGFP) and matrix targeted mScarlet (mt-mScarlet). At 14DIV timelapse imaging was performed following photoactivation of a small subset of dendritic mitochondria. The orange arrow points to a fusion event followed by a fission event (blue arrow). b Images of mt-paGFP following the indicated treatment at 0 and 15 minutes after photo-activation. Orange arrows point to fusion events, blue arrows to fission events. c Quantification of fission and fusion rates for dendritic photo-activated mitochondria in the indicated conditions demonstrating that activity increases the rate of mitochondrial fission through a Camkk2 dependent pathway. DMSO = 49 photoactivated dendritic ROIs from 11 neurons, 1.74 ± 0.24 fission and 1.74 ± 0.26 fusion events per 15 minutes (mean ± SEM). PTX = 49 photoactivated dendritic ROIs from 11 neurons, 3.45 ± 0.36 fission and 1.76 ± 0.24 fusion events per 15 minutes (mean ± SEM). PTX + STO609 = 52 photoactivated dendritic ROIs from 13 neurons, 1.12 ± 0.17 fission and 1.0 ± 0.17 fusion events per 15 minutes (mean ± SEM). p values are indicated in the figure following Kruskal-Wallis tests. Data are shown as individual points with mean ± SEM. Scale bar, 5 μm.
Fig. 6
Fig. 6. Camkk2 and AMPK are required for the compartment-specific mitochondrial morphology in CA1 PNs in vivo.
ai High magnification representative images of mitochondrial morphology within isolated secondary or tertiary hippocampal CA1 (a) basal, (d) apical oblique, and (g) apical tuft dendrites in which a mitochondrial matrix-targeted fluorescent protein (mt-YFP or mt-DsRed) and cell fill (tdTomato or mGreenLantern—not shown) were co-expressed by IUE with or without Cre recombinase (+/-Cre). AMPKα1F/Fα2F/F double conditional mice were in utero electroporated with the same mitochondrial markers/cell fills and either no Cre (AMPKFF/FF - Cre) or Cre (AMPKFF/FF + Cre). Camkk2-/- constitutive knock-out mice were electroporated with the same mitochondrial markers/cell fills as above (Camkk2-/-). Quantification of mitochondrial length and occupancy in the (b, c) basal, (e, f) apical oblique, and (h, i) apical tuft dendritic compartments reveals a significant increase in mitochondrial length (b) and occupancy (c) in basal dendrites when knocking out AMPK or Camkk2 when compared to their controls, with Camkk2 KO having a much bigger effect (WT: n = 32 dendritic segments, 313 individual mitochondria, mean length = 1.065 μm ± 0.029 (SEM), mean occupancy = 33.01% ± 1.84%; WT + Cre: n = 46 dendritic segments, 627 individual mitochondria, mean length = 1.437 μm ± 0.040 (SEM), mean occupancy = 40.95% ± 1.94%; AMPKFF/FF - Cre: n = 42 dendritic segments, 463 individual mitochondria, mean length = 1.418 μm ± 0.039 (SEM), mean occupancy = 39.24% ± 1.89%; AMPKFF/FF + Cre: n = 36 dendritic segments, 381 individual mitochondria, mean length = 2.832 μm ± 0.116 (SEM), mean occupancy = 50.72% ± 2.36%, length increase = 97.08%, occupancy increase = 23.86%; Camkk2-/-: n = 46 dendritic segments, 449 individual mitochondria, mean length = 4.975 μm ± 0.233 (SEM), mean occupancy = 73.36% ± 2.03%, length increase = 367%, occupancy increase = 122%). A significant increase in mitochondrial length (e) and occupancy (f) is also seen in apical oblique dendrites when knocking out Camkk2, but only an increase in length is seen when knocking out AMPK. (WT: n = 28 dendritic segments, 184 individual mitochondria, mean length = 1.569 μm ± 0.104 (SEM), mean occupancy = 42.38% ± 2.98%; WT + Cre: n = 44 dendritic segments, 525 individual mitochondria, mean length = 1.791 μm ± 0.052 (SEM), mean occupancy = 48.50% ± 2.12%; AMPKFF/FF - Cre: n = 45 dendritic segments, 440 individual mitochondria, mean length = 1.885 μm ± 0.075 (SEM), mean occupancy = 45.82% ± 2.29%; AMPKFF/FF + Cre: n = 52 dendritic segments, 499 individual mitochondria, mean length = 2.645 μm ± 0.098 (SEM), mean occupancy = 47.79% ± 1.62%, length increase = 47.68%; Camkk2-/-: n = 29 dendritic segments, 288 individual mitochondria, mean length = 5.366 μm ± 0.346 (SEM), mean occupancy = 78.64% ± 2.07%, length increase = 242%, occupancy increase = 85.56%). Note that in Camkk2-null CA1 PNs we observe a significant increase in mitochondrial length (h) and occupancy (i) in the apical tuft compared to WT controls (WT: n = 33 dendritic segments, 226 individual mitochondria, mean length = 6.562 μm ± 0.437 (SEM), mean occupancy = 84.19% ± 1.44%; WT + Cre: n = 29 dendritic segments, 189 individual mitochondria, mean length = 5.206 μm ± 0.052 (SEM), mean occupancy = 79.40% ± 1.38%; AMPKFF/FF - Cre: n = 38 dendritic segments, 229 individual mitochondria, mean length = 6.498 μm ± 0.368 (SEM), mean occupancy = 87.00% ± 1.67%; AMPKFF/FF + Cre: n = 47 dendritic segments, 370 individual mitochondria, mean length = 5.723 μm ± 0.300 (SEM), mean occupancy = 80.65% ± 1.71%; Camkk2-/-: n = 35 dendritic segments, 199 individual mitochondria, mean length = 11.14 μm ± 0.758 (SEM), mean occupancy = 95.03% ± 1.73%, length increase = 69.77%, occupancy increase = 12.88%). p values are indicated in the figure following a one way ANOVA with Sidak’s multiple comparisons test. Data are shown as individual points on box plots with 25th, 50th and 75th percentiles indicated with whiskers indicating min and max values. Scale bar, 5 μm.
Fig. 7
Fig. 7. MTFR1L restricts hippocampal CA1 PN basal and apical oblique dendritic morphology through inhibition of Opa1.
High magnification representative images of mitochondrial morphology within isolated secondary or tertiary hippocampal CA1 (a) basal, (d) apical oblique, and (g) apical tuft dendrites in which a mitochondrial matrix-targeted fluorescent protein (mt-YFP or mt-DsRed) and cell fill (tdTomato or mGreenLantern—not pictured) was in utero electroporated along with either a control shRNA (shNT), Mtfr1l shRNA (shMtfr1l), Mtfr1l shRNA with full-length hMTFR1L cDNA (shMtfr1l + hMTFR1L), or Mtfr1l shRNA and Opa1 shRNA (shMtfr1l + shOpa1). Quantification of mitochondrial length and occupancy in the (b) and (c) basal, (e) and (f) apical oblique, and (h) and (i) apical tuft dendritic compartments reveals a significant increase in mitochondrial length (b) and occupancy (c) in basal dendrites when knocking down Mtfr1l, which is rescued when re-expressing full-length hMTFR1L or knocking down Opa1 (shNT: n = 51 dendritic segments, 670 individual mitochondria, mean length = 1.225 μm ± 0.028 (SEM), mean occupancy = 33.95% ± 1.46%; shMTFR1L: n = 60 dendritic segments, 773 individual mitochondria, mean length = 2.721 μm ± 0.085 (SEM), mean occupancy = 60.36% ± 1.46%, length increase = 122%, occupancy increase = 77.79%; shMtfr1l + hMTFR1L: n = 28 dendritic segments, 511 individual mitochondria, mean length = 1.113 μm ± 0.029 (SEM), mean occupancy = 39.10% ± 1.02%; shMtfr1l + shOpa1: n = 25 dendritic segments, 515 individual mitochondria, mean length = 1.126 μm ± 0.032 (SEM), mean occupancy = 35.08% ± 1.61%). A significant increase in mitochondrial length (e) and occupancy (f) is also seen in apical dendrites when knocking down Mtfr1l, which is similarly rescued when either expressing full-length hMTFR1L or additionally knocking down Opa1 (shNT: n = 48 dendritic segments, 669 individual mitochondria, mean length = 1.584 μm ± 0.059 (SEM), mean occupancy = 46.34% ± 1.72%; shMtfr1l: n = 54 dendritic segments, 683 individual mitochondria, mean length = 2.390 μm ± 0.061 (SEM), mean occupancy = 59.86% ± 1.29%, length increase = 50.88%, occupancy increase = 29.18%; shMtfr1l + hMTFR1L: n = 29 dendritic segments, 490 individual mitochondria, mean length = 1.352 μm ± 0.034 (SEM), mean occupancy = 42.92% ± 1.25%; shMtfr1l + shOpa1: n = 32 dendritic segments, 514 individual mitochondria, mean length = 1.248 μm ± 0.038 (SEM), mean occupancy = 38.28% ± 1.23%). No significant effect was observed following knockdown of Mtfr1l in the apical tuft dendrites in either mitochondrial length (h) or occupancy (i) compared to control neurons (shNT: n = 53 dendritic segments, 472 individual mitochondria, mean length = 5.177 μm ± 0.250 (SEM), mean occupancy = 79.14% ± 1.29%; shMtfr1l: n = 46 dendritic segments, 388 individual mitochondria, mean length = 4.665 μm ± 0.236 (SEM), mean occupancy = 82.35% ± 2.17%; shMtfr1l + hMTFR1L: n = 30 dendritic segments, 219 individual mitochondria, mean length = 5.186 μm ± 0.280 (SEM), mean occupancy = 86.65% ± 1.75%; shMtfr1l + shOpa1: n = 34 dendritic segments, 215 individual mitochondria, mean length = 5.872 μm ± 0.352 (SEM), mean occupancy = 87.36% ± 1.72%). p values are indicated in the figure following a one way ANOVA with Sidak’s multiple comparisons test. Data are shown as individual points on box plots with 25th, 50th and 75th percentiles indicated with whiskers indicating min and max values. Scale bar, 5 μm.
Fig. 8
Fig. 8. Mff restricts hippocampal CA1 PN basal, apical oblique, and apical tuft dendritic morphology.
High magnification representative images of mitochondrial morphology within isolated secondary or tertiary hippocampal CA1 (a) basal, (d) apical oblique, and (g) apical tuft dendrites in which a mitochondrial matrix-targeted fluorescent protein (mt-YFP or mt-DsRed) and cell fill (tdTomato or mGreenLantern—not pictured) was in utero electroporated along with either a control shRNA (shNT), Mff shRNA (shMFF), or Mff and Mtfr1l shRNA (shMff + shMtfr1l). Quantification of mitochondrial length and occupancy in the (b, c) basal, (e, f) apical oblique, and (h, i) apical tuft dendritic compartments reveals a significant increase in mitochondrial length (b) and occupancy (c) in basal dendrites when knocking down Mff, which does not show an additive effect when also knocking down Mtfr1l (shNT: n = 51 dendritic segments, 670 individual mitochondria, mean length = 1.225 μm ± 0.028 (SEM), mean occupancy = 33.95% ± 1.46%; shMff: n = 36 dendritic segments, 380 individual mitochondria, mean length = 3.530 μm ± 0.152 (SEM), mean occupancy = 60.83% ± 1.86%, length increase = 188%, occupancy increase = 79.18%; shMff + shMtfr1l: n = 92 dendritic segments, 1004 individual mitochondria, mean length = 3.180 μm ± 0.078 (SEM), mean occupancy = 59.94% ± 0.99%, length increase = 160%, occupancy increase = 76.55%). A significant increase in mitochondrial length (e) and occupancy (f) is also seen in apical dendrites when knocking down Mff, but to a significantly less degree when knocking down both Mff and Mtfr1l (shNT: n = 48 dendritic segments, 669 individual mitochondria, mean length = 1.584 μm ± 0.059 (SEM), mean occupancy = 46.34% ± 1.72%; shMff: n = 44 dendritic segments, 371 individual mitochondria, mean length = 6.445 μm ± 0.300 (SEM), mean occupancy = 77.34% ± 1.46%, length increase = 307%, occupancy increase = 66.90%; shMff + shMtfr1l: n = 85 dendritic segments, 829 individual mitochondria, mean length = 3.728 μm ± 0.106 (SEM), mean occupancy = 66.63% ± 0.93%, length increase = 135%, occupancy increase = 43.79%). While there is a significant increase mitochondrial length (h) and occupancy (i) in the apical tuft when knocking down Mff alone, this increase largely goes away when knocking down both Mff and Mtfr1l (shNT: n = 53 dendritic segments, 472 individual mitochondria, mean length = 5.177 μm ± 0.250 (SEM), mean occupancy = 79.14% ± 1.29%; shMff: n = 31 dendritic segments, 199 individual mitochondria, mean length = 10.78 μm ± 0.757 (SEM), mean occupancy = 90.44% ± 1.86%, length increase = 109%, occupancy increase = 14.28%; shMff + shMtfr1l: n = 95 dendritic segments, 708 individual mitochondria, mean length = 6.326 μm ± 0.236 (SEM), mean occupancy = 73.79% ± 1.27%, length increase = 22.19%). p values are indicated in the figure following a one way ANOVA with Sidak’s multiple comparisons test. Data are shown as individual points on box plots with 25th, 50th and 75th percentiles indicated with whiskers indicating min and max values. Scale bar, 5 μm.
Fig. 9
Fig. 9. Activity-dependent and Camkk2-dependent phosphorylation of MTFR1L by AMPK mediates compartmentalized mitochondria morphology in dendrites of CA1 PNs in vivo.
a Western blots of whole cell lysates from mouse hippocampal neurons maintained in culture for 18-21DIV and treated for 15 min with physiological (5 mM) extracelllular potassium chloride (KCl) (first column) or high KCl (40 mM) inducing membrane depolarization (columns 2 & 3) in the presence (column 3) or absence (columns 1 & 2) of the Camkk2 inhibitor STO609. These results demonstrate that phosphorylation of AMPKα catalytic subunit on T172 is increased by neuronal depolarization which is blocked by STO609. In turn, AMPK phosphorylation of its substrate MTFR1L on S103 is increased by depolarization which is Camkk2-dependent since it is blocked by STO609. b Quantification of western blots with fold change of fluorescence intensity of pAMPK normalized to total AMPK plotted for each condition relative to 5 mM KCL treatment. c Quantification of western blots with fold change of fluorescence intensity of pMTFR1L normalized to total MTFR1L plotted for each condition relative to 5 mM KCL treatment. (d-l) Rescue experiments showing that phosphomimetic form of Mtfr1l (Mtfr1lS2D) mimicking phosphorylation by AMPK is sufficient to rescue compartmentalized mitochondria morphology in basal (df), apical oblique (gi) and apical tufts (jl) dendrites of CA1 PNs in vivo. CA1 PNs from wild-type (WT) or Camkk2-/- constitutive knockout mice were IUE with the same mitochondrial markers/cell fills as in Fig. 3 (WT and Camkk2-/-) and a plasmid cDNA expressing phosphomimetic mutant on the two serine residues phosphorylated by AMPK (S103D and S238D) of Mtfr1l (Mtfr1lS2D). Data and quantifications from WT and Camkk2-/- are the same as in Fig. 6. Basal Dendrites (WT and Camkk2-/-: See Fig. 6; Camkk2-/- + Mtfr1lS2D: n = 28 dendritic segments, 375 individual mitochondria, mean length = 1.583 μm ± 0.061 (SEM), mean occupancy = 39.99% ± 2.12%). Apical Oblique Dendrites (WT and Camkk2-/-: See Fig. 3; Camkk2-/- + Mtfr1lS2D: n = 37 dendritic segments, 459 individual mitochondria, mean length = 1.743 μm ± 0.053 (SEM), mean occupancy = 46.19% ± 2.22%). Apical Tuft Dendrites (WT and Camkk2-/-: See Fig. 3; Camkk2-/- + Mtfr1lS2D: n = 30 dendritic segments, 315 individual mitochondria, mean length = 5.310 μm ± 0.262 (SEM), mean occupancy = 84.00% ± 1.31%). Experiments in a were replicated 3 times. For (e), f, (h), (i), (k), and (l), p values are indicated in the figure following a one way ANOVA with Sidak’s multiple comparisons test. For (b) and (c), individual points from independent experiments are shown with connected lines. For (e), (f), (h), (i), (k), and (l), data are shown as individual points on box plots with 25th, 50th and 75th percentiles indicated with whiskers indicating min and max values. Scale bars, 5 μm.
Fig. 10
Fig. 10. Summary of the main findings.
a, b In wild-type mouse CA1 PNs, dendritic mitochondria display a striking degree of compartmentalized morphology, being long and fused in the apical tufts (SLM) with progressive fragmentation and occupancy of a smaller volume of the dendritic segments in SR and SO respectively. c We demonstrate using loss-of-function as well as rescue experiments that this compartmentalization of dendritic mitochondria morphology in CA1 PNs in vivo requires (1) neuronal activity (blocked by neuronal hyperpolarization following over-expression of Kir2.1) or by reducing the number of presynaptic inputs from CA3 to SR and SO dendrites by ~50% (shRNA Lphn3) in vivo, (2) requires activity-dependent activation of AMPK mediated by Camkk2 and (3) requires the AMPK-dependent phosphorylation of the pro-fission Drp1 receptor Mff and the anti-fusion protein Mtfr1l though its ability to suppress the pro-fusion Opa1 protein. These results demonstrate that mitochondrial fusion dominates over fission in apical tuft dendrites (SLM) and that activity-dependent mitochondrial fission dominates over fusion in both SO and SR dendritic compartments. See Discussion for details.

References

    1. Barnes AP, Polleux F. Establishment of axon-dendrite polarity in developing neurons. Annu. Rev. Neurosci. 2009;32:347–381. doi: 10.1146/annurev.neuro.31.060407.125536. - DOI - PMC - PubMed
    1. Gumy LF, Hoogenraad CC. Local mechanisms regulating selective cargo entry and long-range trafficking in axons. Curr. Opin. Neurobiol. 2018;51:23–28. doi: 10.1016/j.conb.2018.02.007. - DOI - PubMed
    1. Horton AC, Ehlers MD. Neuronal polarity and trafficking. Neuron. 2003;40:277–295. doi: 10.1016/S0896-6273(03)00629-9. - DOI - PubMed
    1. Lewis TL, Jr., Courchet J, Polleux F. Cell biology in neuroscience: Cellular and molecular mechanisms underlying axon formation, growth, and branching. J. Cell Biol. 2013;202:837–848. doi: 10.1083/jcb.201305098. - DOI - PMC - PubMed
    1. Wu Y, et al. Contacts between the endoplasmic reticulum and other membranes in neurons. Proc. Natl. Acad. Sci. USA. 2017;114:E4859–E4867. doi: 10.1073/pnas.1701078114. - DOI - PMC - PubMed