. 2024 Mar 8;14(1):5760.
doi: 10.1038/s41598-024-55360-7.

Clinical electromagnetic brain scanner

Affiliations

Clinical electromagnetic brain scanner

Amin Abbosh et al. Sci Rep. .

Abstract

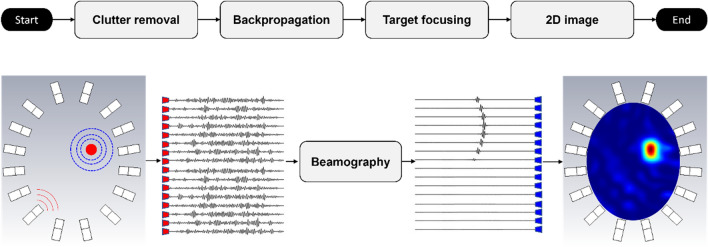
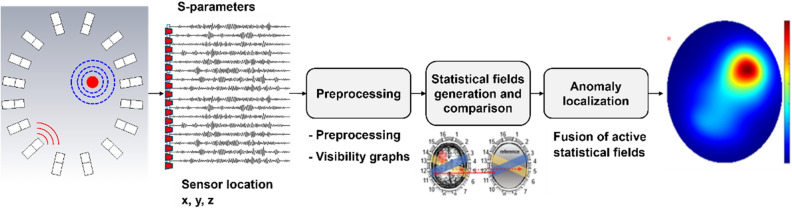
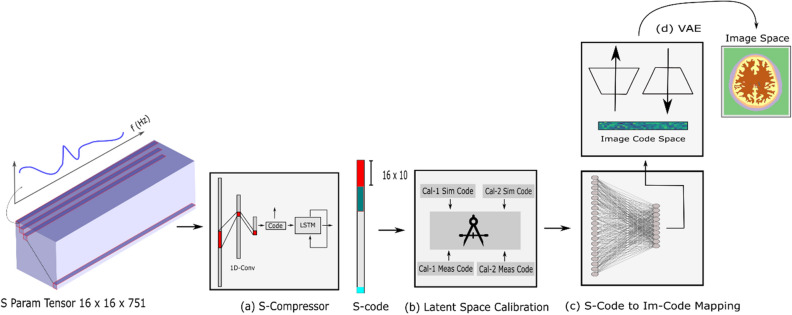
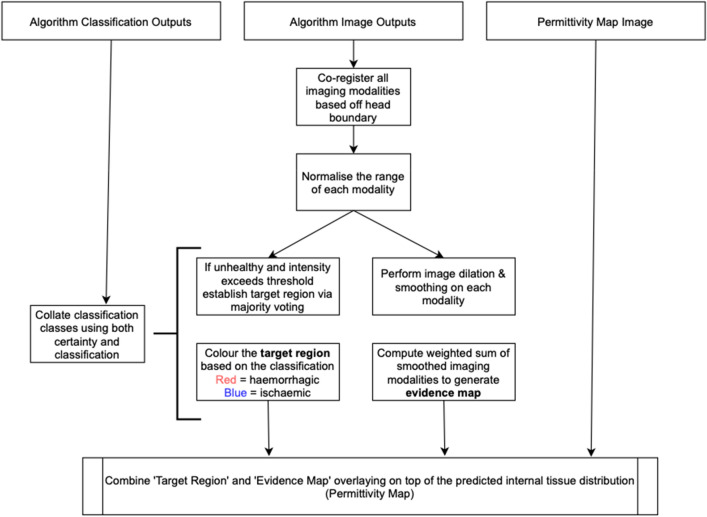
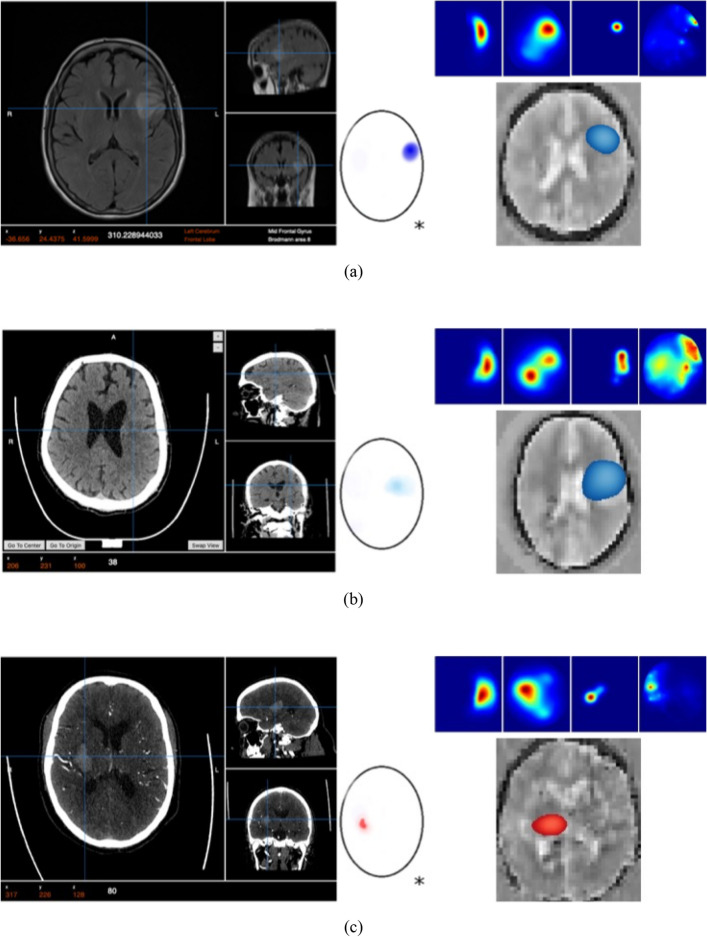
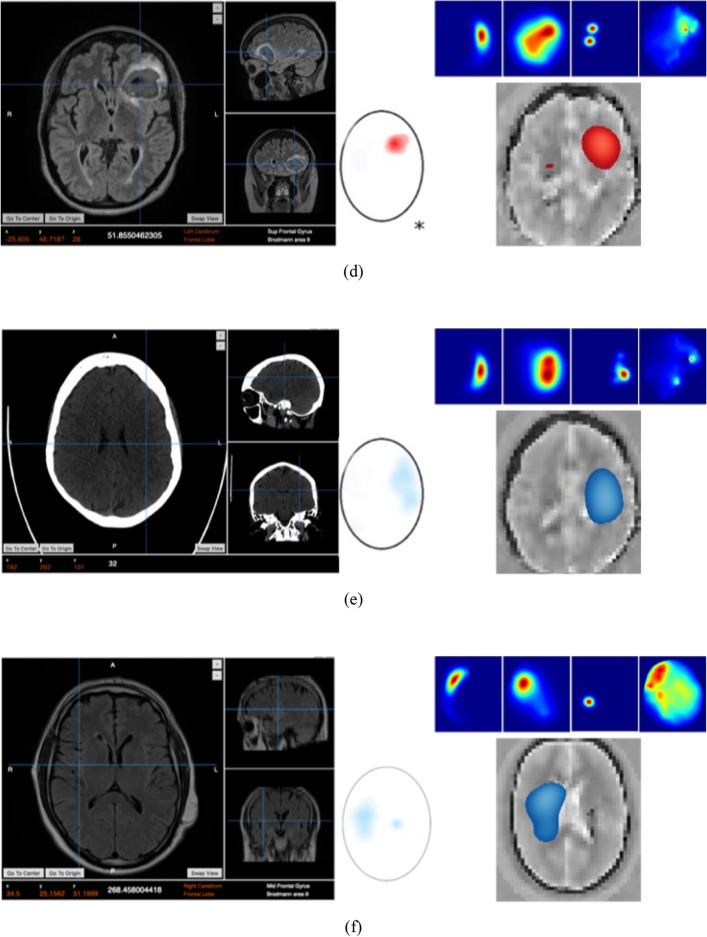
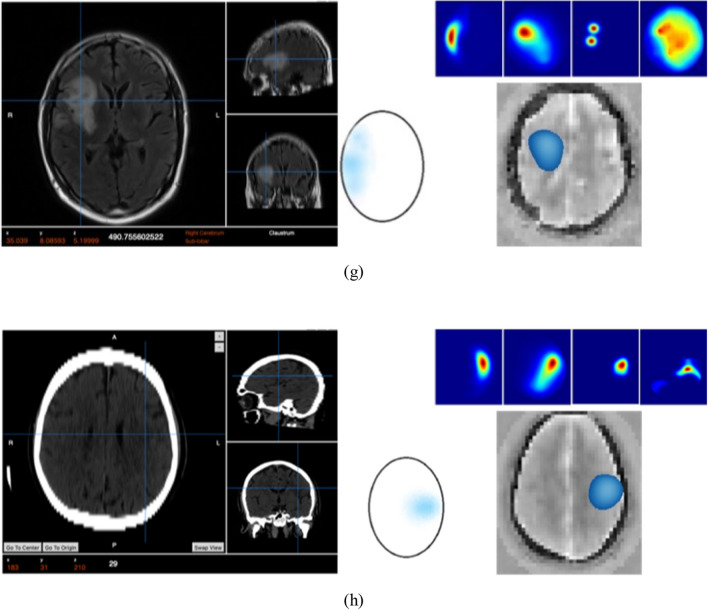
Stroke is a leading cause of death and disability worldwide, and early diagnosis and prompt medical intervention are thus crucial. Frequent monitoring of stroke patients is also essential to assess treatment efficacy and detect complications earlier. While computed tomography (CT) and magnetic resonance imaging (MRI) are commonly used for stroke diagnosis, they cannot be easily used onsite, nor for frequent monitoring purposes. To meet those requirements, an electromagnetic imaging (EMI) device, which is portable, non-invasive, and non-ionizing, has been developed. It uses a headset with an antenna array that irradiates the head with a safe low-frequency EM field and captures scattered fields to map the brain using a complementary set of physics-based and data-driven algorithms, enabling quasi-real-time detection, two-dimensional localization, and classification of strokes. This study reports clinical findings from the first time the device was used on stroke patients. The clinical results on 50 patients indicate achieving an overall accuracy of 98% in classification and 80% in two-dimensional quadrant localization. With its lightweight design and potential for use by a single para-medical staff at the point of care, the device can be used in intensive care units, emergency departments, and by paramedics for onsite diagnosis.


Conflict of interest statement

The co-authors, K.B. and S.C. have a partial appointment with the company, EMvision Medical Devices, which owns the IP of the project. All other authors declare that they do not have any competing interests.

Figures

Figure 1
Figure 1
(a) Framework of the device: In the first step, the system is calibrated using well-defined phantoms. The system is then used to scan the patient’s head and capture scattered signals, which are calibrated against calibration phantom signals. The calibrated data is then processed using a neural network to estimate the contour of the head slice being scanned. Those boundaries are then fed to line crossing, direct mapping, and beamography, which work in an iterative collaborative manner to detect, localize and classify any stroke. In parallel, a tripartite data-driven algorithm is used to map the dielectric properties of all brain tissues. Finally, all the generated images from those algorithms are fed to a fusion algorithm, to give the final image, which shows the location, size, and shape of the stroke in addition to the internal tissue distribution. (b) Main elements of the device: A coupling medium between the antenna array and the head, an antenna array surrounding the head and operating at the low microwave frequency band, an in-line calibration unit for each antenna element, two sets of fixed and flexible cables connecting the antenna array to the multi-port vector network analyzer. (c) The developed device that meets the clinical requirements.
Figure 2
Figure 2
Device initialization and scanning. Before a clinical scan, a full 16-port calibration is performed. Each of the antennas is connected directly to the in-line calibration circuit, to enable software-controlled calibration of the system when collecting clinical data. The in-line calibration circuits are connected directly to the aggregating interface panel on the headset via semi-flexible coaxial cables. The headset is then connected back to another interface on the side of the trolley through flexible cables, which are then connected to the VNA. To mitigate the impact of a patient’s head movement, the in-line calibration circuits are connected to a single standard and continuously monitored before beginning measurements when placed on a patient. If the level of change in consecutive measurements is above the signal-to-noise ratio required to generate accurate images, the system continues to wait until the patient reaches a stable state, after which measurement data is collected in a few seconds. Two homogeneous calibration phantoms serve as reference object that has well-known and deliberately chosen properties. By acquiring the scattering parameters for the two calibration phantoms, along with the scattering parameters for the patient’s head, a range of calibration schemes can be performed by algorithms to counter certain types of faults in measurements, eliminate the impact of variations of environments, manufacturing imperfections or even changes in properties of the device itself with time.
Figure 3
Figure 3
Algorithm-II: It converts the calibrated time-domain data into a horizontal visibility graph based on a linear fast-weighted horizontal visibility graph algorithm. For classification, three similarity matrices of degree, strength, and entropy are constructed and used to form three differential matrices between left and right brain hemispheres to distinguish healthy/unhealthy brains and classify stroke if unhealthy. Using extracted features from these matrices, four different classifiers (Random Forest, K-near neighbor, naïve Bayes, and support vector machine) are used to form probability classifying results. Healthy brains are assumed to be approximately symmetric, and strokes will lead to significantly different amplitude and phase changes compared to healthy brains. By taking pairs of symmetrically located antennas around the head, a differential graph degree (or entropy) is calculated. Lines crossing strokes have significantly larger entropy than those not crossing a stroke. Visualization of the line-crossing data is implemented through training.
Figure 4
Figure 4
Algorithm III: Receive calibrated data as a matrix (in a 16 × 16 Cartesian grid) to generate a polar grid with a unique parameter mapping scheme as shown by individually color-coded cells. The included subplot shows one example of the encoding scheme for antenna no.1, and this scheme is repeated for all other antennas in succession. Another subplot shows the DMM flowchart wherein localization is performed first, followed by classification of the patient in terms of ‘healthy vs unhealthy’ and ‘ischaemic vs hemorrhagic’ stroke type if ‘unhealthy’ is detected. Classification solvers also employ the DMM core algorithm as part of their kernel, along with statistical calculations to estimate the likelihood levels of classified types.
Figure 5
Figure 5
Flowchart of beamography, and an example. Beamography detects and localizes strokes by performing two tasks (1) clutter mitigation, and (2) target focusing. Clutter mitigation is accomplished through symmetry and average subtractions. Marginal distortions due to the inevitable anatomical brain asymmetry and the head displacement are alleviated by average subtraction, where the average of all signals at all frequency samples is subtracted from each of them. After clutter removal, the data captured by each sensor is back-propagated to the imaging domain, using the domain Green’s function to calculate the field observed at each point in the brain for each transmitter–receiver pair and each frequency sample. Those calculated fields are then superposed to construct the final image. The location of the stroke in this method is shown by a higher intensity compared to healthy tissues.
Figure 6
Figure 6
Flowchart of stroke localization with EVSLA algorithm. The algorithm takes S parameters of the raw measurement and calibration data in the frequency domain and locations of sensors as inputs. In the preprocessing step, the algorithm performs inverse Fourier transform (IFFT) of collected S parameters and generates visibility graphs. Generated graphs are used to construct statistical fields and compute the similarity levels between the calibration and raw data. Regions with higher dissimilarity are kept active and used for fusion. The obtained fusion matrix represents the likelihood of each pixel being affected by a stroke. Visualization of the fusion matrix shows the stroke location.
Figure 7
Figure 7
DeepHead for dielectric mapping of the brain. It uses double compression to maximally utilize the cheap unlabelled data to provide a priori information required to ease under-determinism and reduce the sensitivity of inference to the input. The developed neural network model is tripartite, two of its ends are compressors that learn manifolds of interest in both input (captured data by the sensors) and output side (image) of the world. The first compressor uses large datasets of sensor data measured on a physical array. The data here does not need to be labeled. The second compressor uses simulated data with known permittivity distributions. A third module learns to connect the two earlier independently trained compressors using cheap unlabelled data. Lastly, a latent space calibration concept is introduced to enable the work on real-life data as the supervised training of the third module is performed on simulation data. The result is a stable solver with a high-resolution output.
Figure 8
Figure 8
Image fusion is used to combine the complementary information from different algorithms and generate the final image using the following steps: Co-registering different modalities into the same co-ordinates using an elastic warping algorithm, normalizing each modality to have the same intensity scale, finding the region of agreement between the algorithms by applying a threshold to the normalized images and returning the region of agreement based on the overlap. Each modality is then smoothed, and an image dilation operation is performed to produce closed-in and smooth target detection, and the region of agreement is superimposed on the smoothed modality outputs to generate the agreed target location as well as additional heatmap information provided from the different modalities. The final target location and heatmap are then colored based on stroke classification and superimposed on the neural network-based permittivity mapping output image.
Figure 9
Figure 9
Patient data from clinical trial presenting the ground truth on the left side, a set of outputs from the four individual algorithms (right side–top row), the clinically interpreted ground truth, and the fused output, which shows the detected area colored in red for hemorrhagic stroke and blue for ischemic stroke.
Figure 9
Figure 9
Patient data from clinical trial presenting the ground truth on the left side, a set of outputs from the four individual algorithms (right side–top row), the clinically interpreted ground truth, and the fused output, which shows the detected area colored in red for hemorrhagic stroke and blue for ischemic stroke.
Figure 10
Figure 10
Sagittal plane of the human head showing the plane of imaging in EM and MRI slices. The plane of the original MRI slices is depicted with green dotted lines, and the two solid red lines show the imaging volume of the array. The dotted red line indicates the axial center of the antenna array.

References

    1. Gabriel C, Gabriel S, Corthout E. The dielectric properties of biological tissues. Phys. Med. Biol. 1996;41:2231–2249. doi: 10.1088/0031-9155/41/11/001. - DOI - PubMed
    1. Mobashsher A, Abbosh A. On-site rapid diagnosis of intracranial hematoma using portable multi-slice microwave imaging system. Sci. Rep. 2016;6:37620. doi: 10.1038/srep37620. - DOI - PMC - PubMed
    1. Mohammed B, Abbosh A, Mustafa S, Ireland D. Microwave system for head imaging. IEEE Trans. Instrum. Meas. 2014;63(1):117–123. doi: 10.1109/TIM.2013.2277562. - DOI
    1. Islam M, Islam MT, Almutairi A. A portable non-invasive microwave based head imaging system using compact metamaterial loaded 3D unidirectional antenna for stroke detection. Sci. Rep. 2022;12:8895. doi: 10.1038/s41598-022-12860-8. - DOI - PMC - PubMed
    1. Pastorino M, Randazzo A. Microwave Imaging Methods and Applications. Artech House; 2018.