. 2024 Mar 8;14(1):5713.
doi: 10.1038/s41598-024-55753-8.

Modeling brain network flexibility in networks of coupled oscillators: a feasibility study

Affiliations

Modeling brain network flexibility in networks of coupled oscillators: a feasibility study

Narges Chinichian et al. Sci Rep. .

Abstract

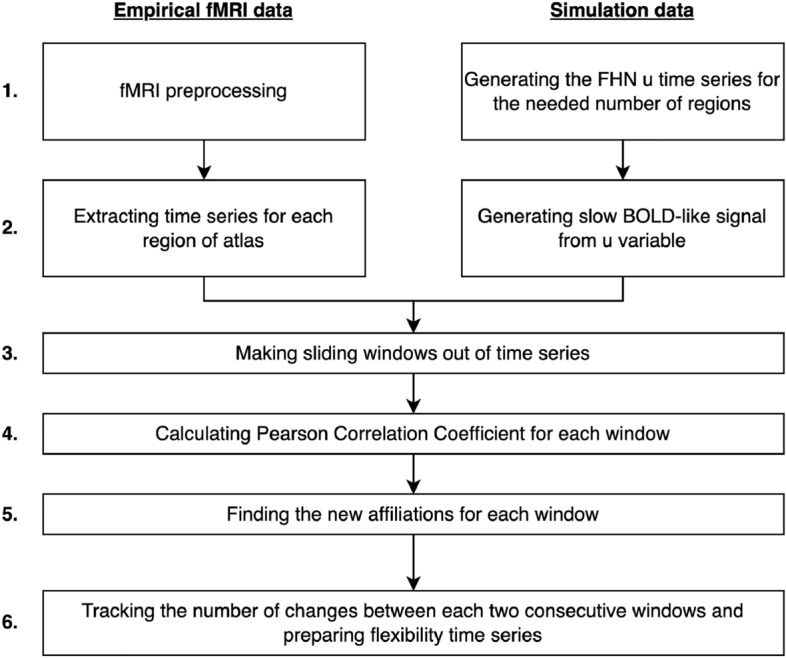
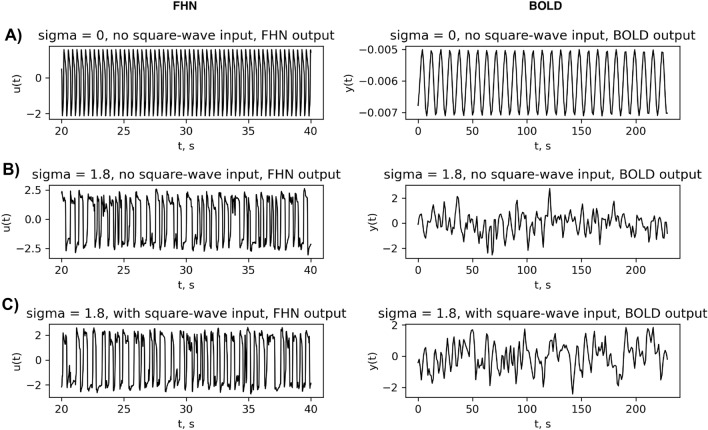
Modeling the functionality of the human brain is a major goal in neuroscience for which many powerful methodologies have been developed over the last decade. The impact of working memory and the associated brain regions on the brain dynamics is of particular interest due to their connection with many functions and malfunctions in the brain. In this context, the concept of brain flexibility has been developed for the characterization of brain functionality. We discuss emergence of brain flexibility that is commonly measured by the identification of changes in the cluster structure of co-active brain regions. We provide evidence that brain flexibility can be modeled by a system of coupled FitzHugh-Nagumo oscillators where the network structure is obtained from human brain Diffusion Tensor Imaging (DTI). Additionally, we propose a straightforward and computationally efficient alternative macroscopic measure, which is derived from the Pearson distance of functional brain matrices. This metric exhibits similarities to the established patterns of brain template flexibility that have been observed in prior investigations. Furthermore, we explore the significance of the brain's network structure and the strength of connections between network nodes or brain regions associated with working memory in the observation of patterns in networks flexibility. This work enriches our understanding of the interplay between the structure and function of dynamic brain networks and proposes a modeling strategy to study brain flexibility.


Conflict of interest statement

The authors declare no competing interests.

Figures

Figure 1
Figure 1
Empirical and simulated data pipelines. Empirical data from participants is collected and preprocessed. Time series for all brain regions are extracted. Pearson correlation coefficients between time series in every sliding window are calculated. The flexibility time series are generated based on the changes of node affiliations between consecutive windows. For the simulated data; time series are generated with the FitzHugh-Nagumo model and converted to slower oscillations via the Balloon-Windkessel model to resemble fMRI signals. The simulated time series are then treated like their empirical counterparts.
Figure 2
Figure 2
Schematic view of simulation steps. (a) Structural network is based on white matter Diffusion Tensor Imaging (DTI) data. (b) Nodes that receive the square wave input are marked and the magnitude of the input is decided. (c) FitzHugh-Nagumo time series are generated using the dynamics introduced in equation (1). (d) The time series of the u-variables of the FitzHugh-Nagumo model are passed to the Balloon-Windkessel model to produce slower Blood Oxygen Level Dependent (BOLD)-like signals. (e) The slow signals are treated like the empirical data. Sliding windows Pearson’s correlation coefficients are calculated between each pair of nodes and used as functional networks.
Figure 3
Figure 3
DTI matrix and input. (A) Shape of square-wave input given to the 6 selected nodes. (B) Working Memory associated areas extracted from Neurosynth engine. The Brainnetome regions with bigger than 50% overlap are regions 25,26,29,63,127 and 211 (the full list of Brainnetome regions can be found in the supplementary material). (C) Alternating blocks of working memory task in N-back working memory task design. (D) Average DTI weighted adjacency matrix from 32 subjects of Human Connectome Project, calculated by Horn et al. 2020 using Lead software. For illustration purpose, log(gij+10-4) is plotted.
Figure 4
Figure 4
FitzHugh-Nagumo (FHN) and Balloon-Windkessel models outputs. An example plot for the outputs of FHN and Balloon-Windkessel models for a region in the middle of the sorted list of weighted connections [Region 148 from Brainnetome] region for the 3 cases; Top: σ=0 and no square-wave input to any region, Ik0 for all k=1,,N. Middle: σ=1.8 and no square-wave input to any region. Bottom: σ=1.8 and square-wave input Ik(t) (see Eq. (2)) given to the 6 selected working memory regions. See supplementary material Fig. S8 for the least connected node (115), Fig. S9 most connected node (230) and Fig. S10 a node that is directly receiving input (63).
Figure 5
Figure 5
Comparing empirical and simulated cases. Distance flexibilities on the left column and template flexibilities on the right column in empirical data (first row, panels A and B) and simulated data (second row, panels C and D). Pearson correlation coefficient for the two template flexibility time series is 0.85 and for the two distance flexibility time series is 0.87 (with mean absolute error (MAE) of 0.01 and 0.03 respectively). A ”subject” in empirical data means one participant and a ”simulation” in simulated data means a single run with a random initial condition [empirical data: averaged over 331 participants and simulated data averaged over 300 random initial conditions]. Each sliding time window is covering 30 s and two consecutive time windows have 28 s overlap.
Figure 6
Figure 6
Simulation with randomly shuffled connectivity matrix. Comparison of two ensembles of 50 simulations each with different initial conditions on the empirical DTI-based connectivity matrix G (”Baseline”, panels A and B) and a randomly shuffled version G with the same weight distribution (“Shuffled”, panels C and D). All other simulation parameters except the structural matrix were kept the same (equal to those in Fig. 5). Green stripes show the time windows with the external input. Left column compares the distance flexibility values and right column the template flexibility outcomes. The Pearson correlation coefficient for the two template flexibility time series is 0.64 and for the two distance flexibility time series is 0.42 (with mean absolute error (MAE) of 0.01 for both cases).
Figure 7
Figure 7
Node selection scenarios/ Influence of stimulated brain region on flexibility outcome. (A) Visualization of Brainnetome atlas regions. (B) Histogram of weighted degrees for all 246 nodes in the DTI matrix. The dashed line shows the median value of weighted degrees. (C) Comparison between distance flexibility measure for the 4 simulation scenarios of WM (nodes associated empirically to working memory. See “Node selection scenarios” subsection for more information), Heavy (heavy scenario, referring to the weighted node degree), Middle (mid scenario) and Light (light scenario) nodes being stimulated by Ik(t). In oragne-colored Heavy scenario, the symmetry between the start of input vs no-input blocks is broken. (D) Comparison of template flexibility time series for the 4 scenarios.

Similar articles

References

    1. Bassett DS, Sporns O. Network neuroscience. Nat. Neurosci. 2017;20(3):353–364. doi: 10.1038/nn.4502. - DOI - PMC - PubMed
    1. Lynn CW, Bassett DS. The physics of brain network structure, function and control. Nat. Rev. Phys. 2019;1(5):318–332. doi: 10.1038/s42254-019-0040-8. - DOI
    1. Bondy, J. A. & Murty, U. S. R. Graph Theory, 6 Springer. In Grad. Texts in Math 244 (2008).
    1. Fair DA, Cohen AL, Power JD, Dosenbach NUF, Church JA, Miezin FM, Schlaggar BL, Petersen SE. Functional brain networks develop from a local to distributed organization. PLoS Comput. Biol. 2009;5(5):e1000381. doi: 10.1371/journal.pcbi.1000381. - DOI - PMC - PubMed
    1. Fornito A, Zalesky A, Bullmore E. Fundamentals of Brain Network Analysis. Academic Press; 2016.