. 2024 Jun;31(6):874-883.
doi: 10.1038/s41594-024-01249-y. Epub 2024 Mar 8.

Structure of the human outer kinetochore KMN network complex

Affiliations

Structure of the human outer kinetochore KMN network complex

Stanislau Yatskevich et al. Nat Struct Mol Biol. 2024 Jun.

Abstract

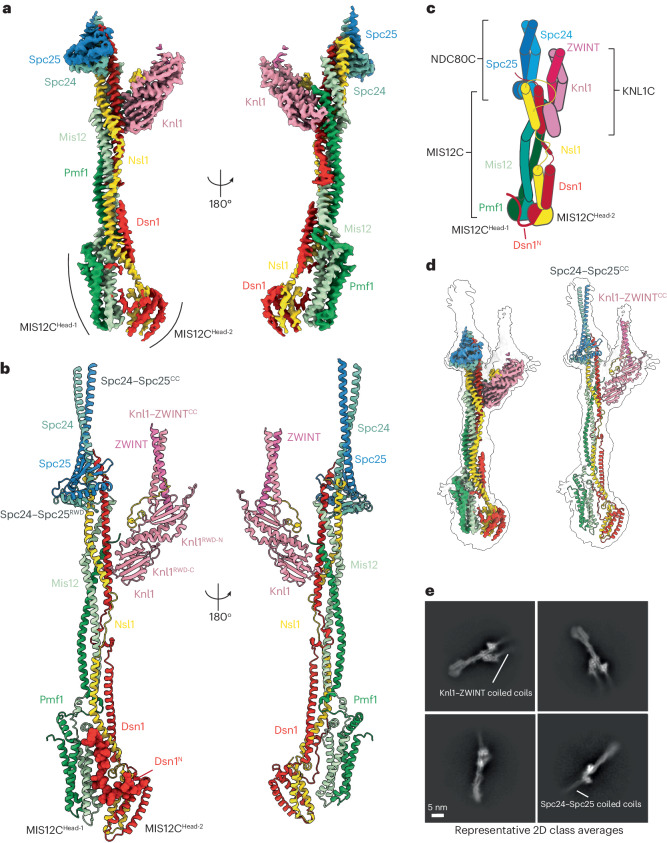
Faithful chromosome segregation requires robust, load-bearing attachments of chromosomes to the mitotic spindle, a function accomplished by large macromolecular complexes termed kinetochores. In most eukaryotes, the constitutive centromere-associated network (CCAN) complex of the inner kinetochore recruits to centromeres the ten-subunit outer kinetochore KMN network that comprises the KNL1C, MIS12C and NDC80C complexes. The KMN network directly attaches CCAN to microtubules through MIS12C and NDC80C. Here, we determined a high-resolution cryo-EM structure of the human KMN network. This showed an intricate and extensive assembly of KMN subunits, with the central MIS12C forming rigid interfaces with NDC80C and KNL1C, augmented by multiple peptidic inter-subunit connections. We also observed that unphosphorylated MIS12C exists in an auto-inhibited state that suppresses its capacity to interact with CCAN. Ser100 and Ser109 of the N-terminal segment of the MIS12C subunit Dsn1, two key targets of Aurora B kinase, directly stabilize this auto-inhibition. Our study indicates how selectively relieving this auto-inhibition through Ser100 and Ser109 phosphorylation might restrict outer kinetochore assembly to functional centromeres during cell division.


Conflict of interest statement

The authors declare no competing interests.

Figures

Fig. 1
Fig. 1. Overall architecture of the human KMNJunction complex.
a, Composite cryo-EM density map of the human KMNJunction complex, composed of the rigid Spc24–Spc25–MIS12C–Knl1–ZWINT body derived from the Body 1 (Extended Data Fig. 2c) and the more mobile MIS12CHead-1–MIS12CHead-2 body derived from the Body 2 (Extended Data Fig. 2c). b, Molecular model of the human KMNJunction complex, highlighting the auto-inhibitory Dsn1N region in space-filling representation. Spc24–Spc25CC and Knl1–ZWINTCC coiled coils are shown. Coordinates traced: G86–W197 (Spc24), D80–N224 (Spc25), R2097–H2342 (Knl1), Q183–G221 (ZWINT). c, Schematic of the human KMNJunction complex, with diagrams of the peptide linkages present in the complex. d, A high-resolution sharpened composite map (left) and molecular model (right) of the human KMNJunction complex fitted into the transparent gray consensus unmasked map of the KMN network complex that shows coiled-coil densities of the Spc24–Spc25 and Knl1–ZWINT complexes. e, Representative cryo-EM 2D class averages of the KMN network showing coiled coils of Spc24–Spc25 and Knl1–ZWINT complexes projecting from the central KMNJunction complex.
Fig. 2
Fig. 2. Molecular details of MIS12C auto-inhibition.
a, Cryo-EM density map of MIS12CHead-1 and MIS12CHead-2 in the auto-inhibited state; (c) and (d) refer to the views in c and d, respectively. b, Molecular model of the MIS12C head groups in the auto-inhibited state, highlighting the auto-inhibitory Dsn1N element. Residues of Dsn1 that are N-terminal to Arg92 are disordered. c, Molecular details of the WRR linchpin interaction with the MIS12CHead-1, with Ser100 forming stabilizing interactions with the backbone of the linchpin loop. d, Molecular details of the RKSL zipper binding across MIS12CHead-1 and MIS12CHead-2 and locking the auto-inhibited MIS12C state. e, The MIS12C–CENP-C complex structure (gray, PDB: 5LSK ref. ) overlaid over the auto-inhibited MIS12C structure (green, this work). CENP-C is displayed in space-filling representation, and Dsn1N is colored red, showing a direct steric clash between CENP-C and Dsn1N. The N terminus of CENP-C is indicated with ‘N,’ and the N-terminal half of CENP-C bound to MIS12C (residues 6–22) is labeled ‘CENP-C (N)’ and residues 28–48 are labeled ‘CENP-C (C).’ The boundaries of the Dsn1N auto-inhibitory segment (residues 93–113) are labeled and colored pink. f, Rotation of MIS12CHead-2 in transition from the MIS12C auto-inhibited state to the MIS12C–CENP-C complex creates a binding site for CENP-C by removing steric hindrance from both MIS12CHead-2 and the Dsn1–Nsl1 connector-α3 helices, which also optimizes contacts to Arg14, Arg15 and Phe17 of CENP-C. The N termini of the Dsn1–Nsl1 connector-α3 helices bend slightly on transition to the MIS12C–CENP-C complex. g, Summary of the ITC data for dissociation constants (Kd) and stoichiometry (n) between MIS12C variants and either CENP-C2–22 or Dsn192-113 (Dsn1N auto-inhibitory) peptides; experimental data and detailed descriptions are provided in Extended Data Figure 4.
Fig. 3
Fig. 3. Spc24–Spc25 forms a rigid interface with MIS12C.
a, Cryo-EM density map of the MIS12C–Spc24–Spc25 interface. b, Molecular model of the MIS12C–Spc24–Spc25 interface, composed of rigidly docked Spc24–Spc25RWD formed from both a Dsn1 peptide contact with Spc24–Spc25 and Nsl1 peptide interface with Spc25; (c) and (d) refer to the views in c and d, respectively. c, Molecular details of the Dsn1 peptide interaction with Spc24–Spc25, highlighting a number of electrostatic interactions and the buried hydrophobic surface of Dsn1. d, Molecular details of the Nsl1 peptide interaction with Spc24–Spc25, similarly showing an electrostatic and geometric match between the Nsl1 peptide and Spc25 surface.
Fig. 4
Fig. 4. KNL1C forms multiple interactions with MIS12C.
a, Overview of the MIS12C–KNL1C interface. The pair of RWD domains of Knl1 dominate this interface. b, Molecular details of the Knl1RWD-C interaction with MIS12C stalk, formed by Trp2249 docking into shallow grooves of the MIS12C central stalk and additionally supported by a number of electrostatic interactions on the opposite end of the Knl1RWD-C. c, The Nsl1 C-terminal peptide augments the central Knl1RWD-C β-sheet interaction with MIS12C, forming additional contacts with Knl1RWD-N.
Fig. 5
Fig. 5. Molecular model of the complete human KMN network complex.
Molecular model and cartoon schematic of the complete KMN network complex based on the structures determined in this study and AlphaFold2 models. The existence of the bent conformation of NDC80C is not firmly established. NDC80CH, NDC80 calponin homology domain; NDC80tetramerization, NDC80C tetramerization domain.
Extended Data Fig. 1
Extended Data Fig. 1. Cryo-EM sample preparation.
a. Coomassie blue−stained SDS-PAGE gels of the purified KMN network components and their corresponding schematics that were used in this study for structure-function analysis. The purifications were repeated at least three independent times with identical results. b AlphaFold2 prediction of the full-length Knl1 protein obtained from Uniprot server. The Knl1 region coloured red (amino acids 1870–2342) was used in this study as it contains all structured regions of the Knl1 protein. c Coomassie blue-stained SDS-PAGE gel of the reconstituted KMN network complex that was used for cryo-EM grid preparations and structural analysis. The reconstitutions were repeated at least five independent times with identical results. Source data
Extended Data Fig. 2
Extended Data Fig. 2. Cryo-EM data processing.
a Representative cryo-electron micrograph obtained during data collection. A total of 17,815 micrographs were obtained during data collection. b Representative 2D class averages generated in cryoSPARC during initial 2D classification steps. c Cryo-EM data processing workflow summary as described in the Methods section. d Fourier Shell Correlation (FSC) plots of the three main maps used to generate molecular models. The maps are also highlighted in (c). e Consensus KMNJunction complex coloured by local resolution as well as angular distribution of particle views. Source data
Extended Data Fig. 3
Extended Data Fig. 3. Molecular details of Dsn1 auto-inhibition.
a Unmasked map of the KMN network complex was used to generate masks around Spc24:Spc25 coiled-coils (Body 3) and independently for Knl1:ZWINT coiled-coils (Body 4). The masks and maps were subsequently used for MultiBody refinement as implemented in RELION 4.0. MultiBody refinement improved local resolution to enable tracing of the coiled-coils for both bodies, as shown in the insets on the right where molecular model of the coiled-coils was fitted into a transparent cryo-EM density map of the Body 3 and Body 4. b Molecular model of the Dsn1N fitted into the MIS12CHead-2 cryo-EM density map, showing side-chain resolution at the key interaction regions: Left: view showing side chain density for Trp96 and Arg98. Right: a rotated view showing density for Lys108, Ser109 and Leu110. c MIS12C:CENP-C structure (grey, PDB ID: 5LSK ref. ) overlayed with the auto-inhibited MIS12C shows that the back side of the MIS12C is available to bind a portion of the CENP-C (residues 1–21). d CENP-C multiple sequence alignment, highlighting the CENP-C regions that can bind to the MIS12C in the auto-inhibited state (accessible region, C-terminal portion) and the region of CENP-C (N-terminal portion) that is blocked from engaging MIS12C.
Extended Data Fig. 4
Extended Data Fig. 4. Isothermal titration calorimetry experiments.
The Kd and stoichiometries (n) values are averages between at least two experiments. The reported error values are calculated standard deviations. CENP-C2–22 and Dsn192-113 peptides were injected using a syringe into the cell containing MIS12C protein variants. Protein and peptide concentrations in cell and syringe are indicated in square brackets. a Titration of CENP-C2–22 peptide to full-length and unmodified MIS12C, MIS12C (WT). b Titration of CENP-C2–22 peptide to MIS12C with deleted Dsn1N (6–113 residues deleted, MIS12CDsn1ΔN). c Titration of CENP-C2–22 peptide to MIS12C with S100D and S109D substitutions in Dsn1 protein (MIS12CDsn1 S100D/S109D). d Titration of Dsn192-113 peptide to MIS12C (WT). e Titration of Dsn192-113 peptide to MIS12CDsn1ΔN. f Titration of Dsn192-113 peptide with W96A/R97A/R98A substitutions (Dsn192-113 W96A/R97A/R98A) to MIS12C (WT).
Extended Data Fig. 5
Extended Data Fig. 5. Biochemical analysis of CENP-C interactions with MIS12C.
a Coomassie blue-stained SDS-PAGE gels of the MIS12C:CENP-C1–71 interaction reconstitution. Wild-type MIS12C, MIS12CDsn1ΔN, MIS12C with W96A/R97A/R98A substitutions in Dsn1 (MIS12CDsn1 W96A/R97A/R98A) or MIS12CDsn1 S100D/S109D was used in these experiments to test interaction with CENP-C1–71 tagged at the C-terminus with Maltose Binding Protein (MBP, CENP-C1–71-MBP) to allow robust visualization of CENP-C. The binding experiments were repeated at least two independent times with identical results. b SEC elution chromatograms of all of the experiments described in (a). c Multiple sequence alignment of Dsn1 protein using model eukaryotes shows that the -WRR- linchpin and -RKSL- motif are conserved. d AlphaFold2 Multimer prediction of the K. lactis MIS12C structure. Coloured by pLDDT score. e AlphaFold2 Multimer prediction of the K. lactis MIS12C coloured by subunit with insert highlighting conservation of the auto-inhibitory Dsn1N mechanism. Source data
Extended Data Fig. 6
Extended Data Fig. 6. AlphaFold2 model of CENP-T:MIS12C interactions.
a AlphaFold2 Multimer prediction of the CENP-T:MIS12C interaction based on the full-length MIS12C protein sequences for all proteins apart from Dsn1, for which residues 113–356 were used to remove auto-inhibitory Dsn1N region. Only CENP-T residues 180–230 were used for this prediction. The model on the left is coloured by pLDDT score whereas the model on the right is coloured by chain. The residues forming the dominant interaction of CENP-T with MIS12 head 1 have pLDDT scores of 70–83. The positional alignment error (PAE) score is shown in the top left of the panel, with the CENP-T-MIS12C interaction confidence prediction indicated in green boxes. The blue-colouring indicates a low PAE score (high confidence). b A CENP-T-interacting region of MIS12C is shown as an electrostatic surface potential while Thr195 and Ser201 of CENP-T are highlighted in red. Both Thr195 and Ser201 are targets of CDK kinase in cells and both residues face positively-charged patches on MIS12C. c Overlay of CENP-T:MIS12C AlphaFold2 prediction on the MIS12C structure determined in this study. The auto-inhibitory Dsn1N region and CENP-T peptidic region are shown in space-filling representation, highlighting an extensive steric clash.
Extended Data Fig. 7
Extended Data Fig. 7. Biochemical characterization of MIS12C:NDC80C interactions.
a Coomassie blue-stained SDS-PAGE gels of the MIS12C:NDC80C interaction reconstitutions. MIS12C (WT), MIS12C with E219/RV220R/F221A substitutions in Nsl1 (MIS12CNsl1 E219/RV220R/F221A) and MIS12C with P332W/R334A/L336R substitutions in Dsn1 (MIS12CDsn1 P332W/R334A/L336R) were tested for binding to full-length, unmodified NDC80C. The binding experiments were repeated at least two independent times with identical results. The gels are aligned according to the fraction number of the protein sample eluted from the size exclusion column. b SEC elution chromatograms of all of the experiments described in (a). c. Comparison of the Spc24:Spc25 interaction with peptides from MIS12C and CENP-T (PDB ID: 3VZA ref. ). Source data
Extended Data Fig. 8
Extended Data Fig. 8. Molecular details of MIS12C:KNL1C interactions.
a Cryo-EM density map of the KNL1C:MIS12C interface, highlighting the resolution of interactions in this region. b Unsharpened and unmasked cryo-EM map of the KMN network shows a long peptide of Nsl1 binding to the Knl1:ZWINT interface and then folding across the Knl1 surface. c AlphaFold2 structure prediction of the Knl1:ZWINT:Nsl1 complex, demonstrating strong agreement with the experimental density maps in (b). The model on the left is coloured by chain while the model on the right is coloured by pLDDT score. d Sequence alignment of the Nsl1 protein showing conservation of two Nsl1 motifs involved in Knl1 interaction.
Extended Data Fig. 9
Extended Data Fig. 9. Biochemical validation of the MIS12C:Knl1 interface.
a Coomassie blue-stained SDS-PAGE gels of the MIS12C:Knl1 interaction reconstitutions. MIS12C (WT) and MIS12C with Nsl1 truncated at the C-terminus (1–264 Nsl1 construct, MIS12CNsl1ΔC) were tested in their ability to bind either wild-type RWD domains of Knl1 (2131–2337 construct, labelled Knl1 for simplicity) or Knl1 mutants (R2248D/W2249S substitutions, Knl1mut1, and S2270R/S2272W substitutions, Knl1mut2, as well as S2270R/S2272W/R2248A/W2249S substitutions, Knl1mut3). The binding experiments were repeated at least two independent times with identical results. The gels are aligned according to the fraction number of the protein sample eluted from the size exclusion column. b SEC elution chromatograms of all of the experiments described in (a). Source data

References

    1. McAinsh AD, Marston AL. The four causes: the functional architecture of centromeres and kinetochores. Annu. Rev. Genet. 2022;56:279–314. doi: 10.1146/annurev-genet-072820-034559. - DOI - PMC - PubMed
    1. Yatskevich S, Barford D, Muir KW. Conserved and divergent mechanisms of inner kinetochore assembly onto centromeric chromatin. Curr. Opin. Struct. Biol. 2023;81:102638. doi: 10.1016/j.sbi.2023.102638. - DOI - PubMed
    1. Musacchio A, Desai A. A molecular view of kinetochore assembly and function. Biology. 2017;6:5. doi: 10.3390/biology6010005. - DOI - PMC - PubMed
    1. Navarro AP, Cheeseman IM. Kinetochore assembly throughout the cell cycle. Semin. Cell Dev. Biol. 2021;117:62–74. doi: 10.1016/j.semcdb.2021.03.008. - DOI - PMC - PubMed
    1. Fischer ES. Kinetochore-catalyzed MCC formation: A structural perspective. IUBMB Life. 2023;75:289–310. doi: 10.1002/iub.2697. - DOI - PMC - PubMed

MeSH terms