. 2024 Jun;31(6):925-938.
doi: 10.1038/s41594-024-01246-1. Epub 2024 Mar 8.

Structure and interactions of the endogenous human Commander complex

Affiliations

Structure and interactions of the endogenous human Commander complex

Saara Laulumaa et al. Nat Struct Mol Biol. 2024 Jun.

Erratum in

Abstract

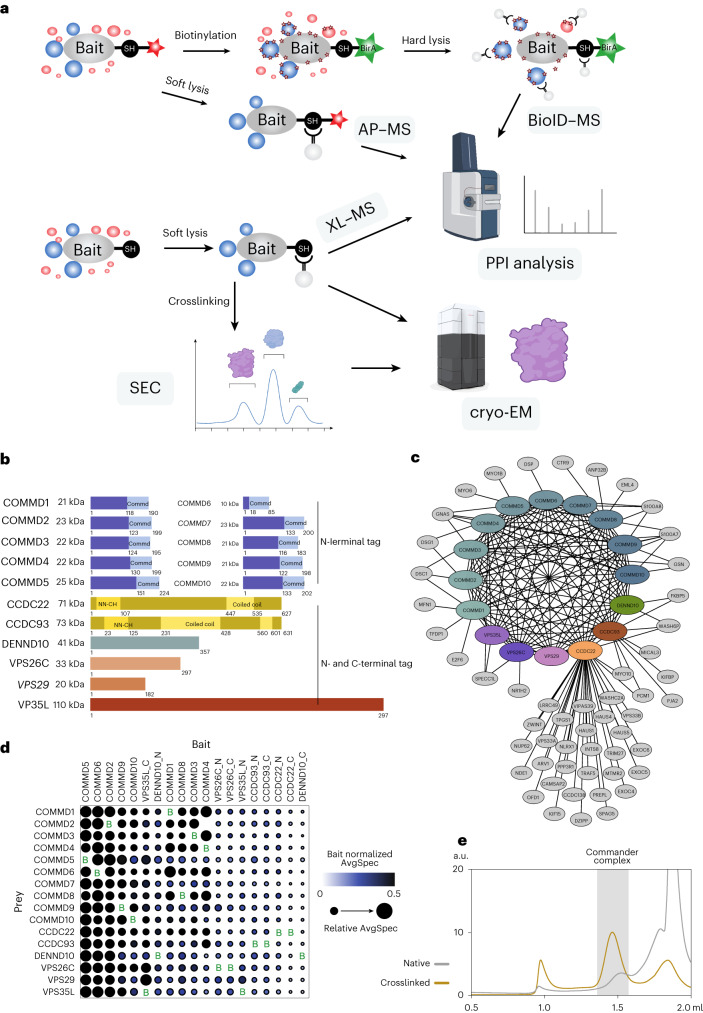
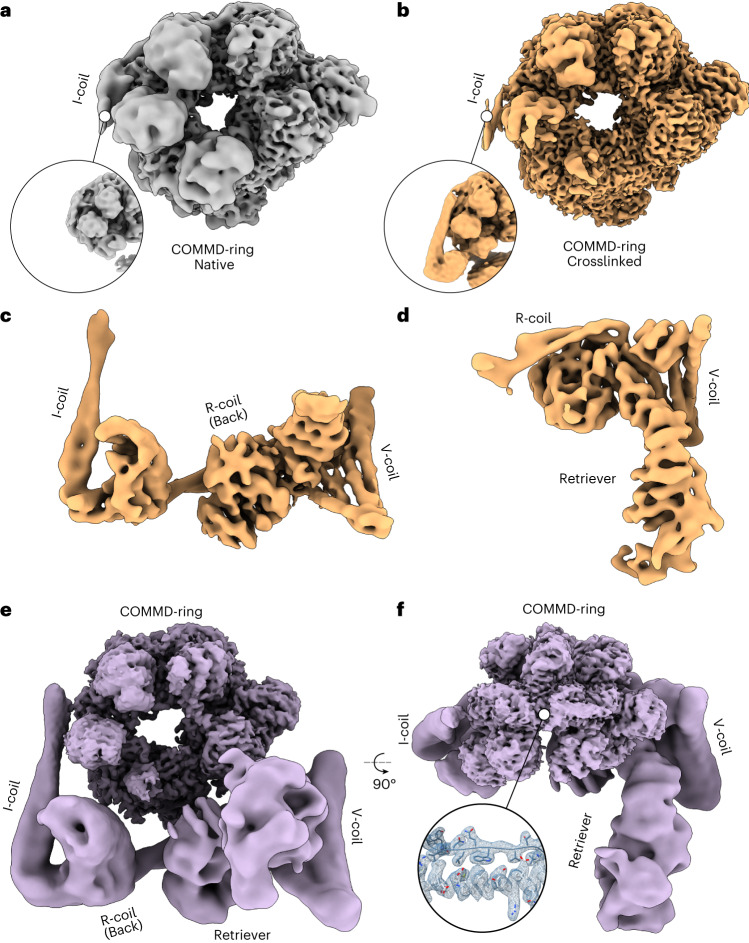
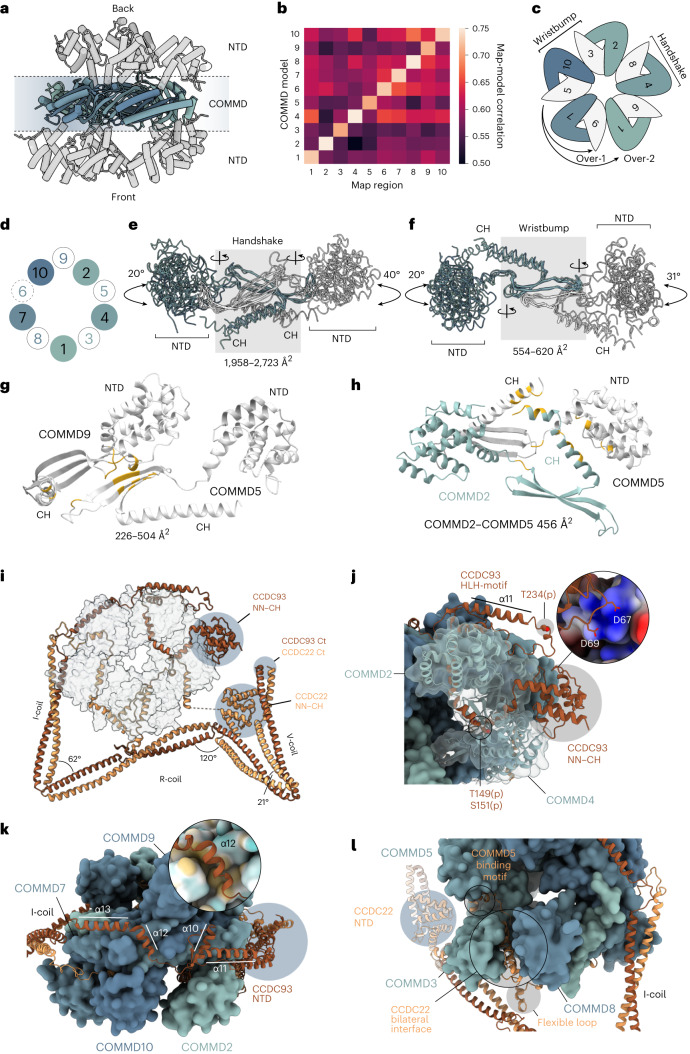
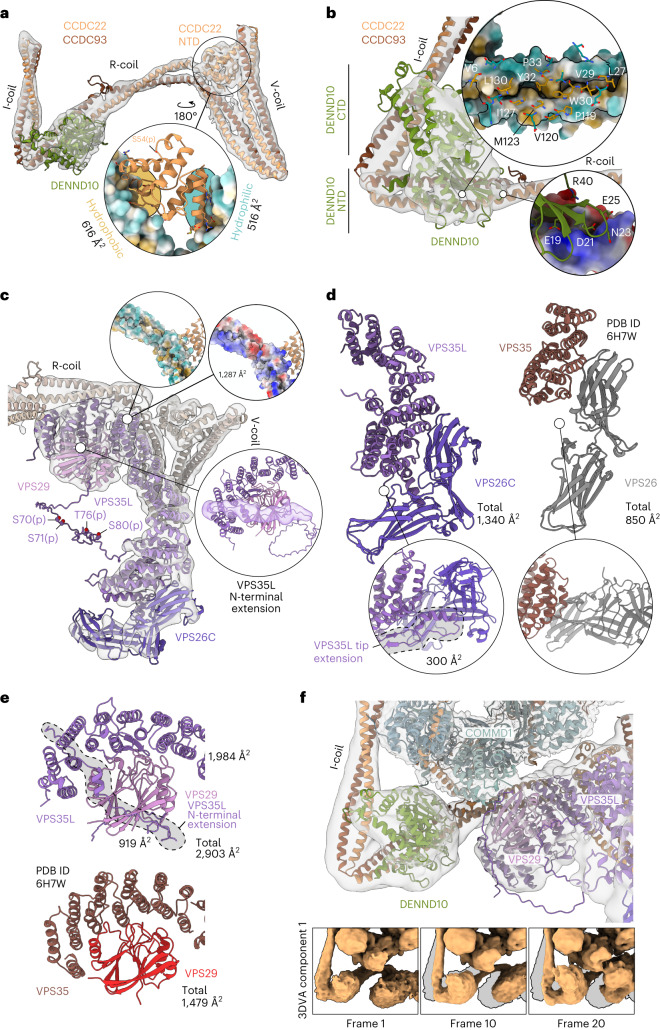
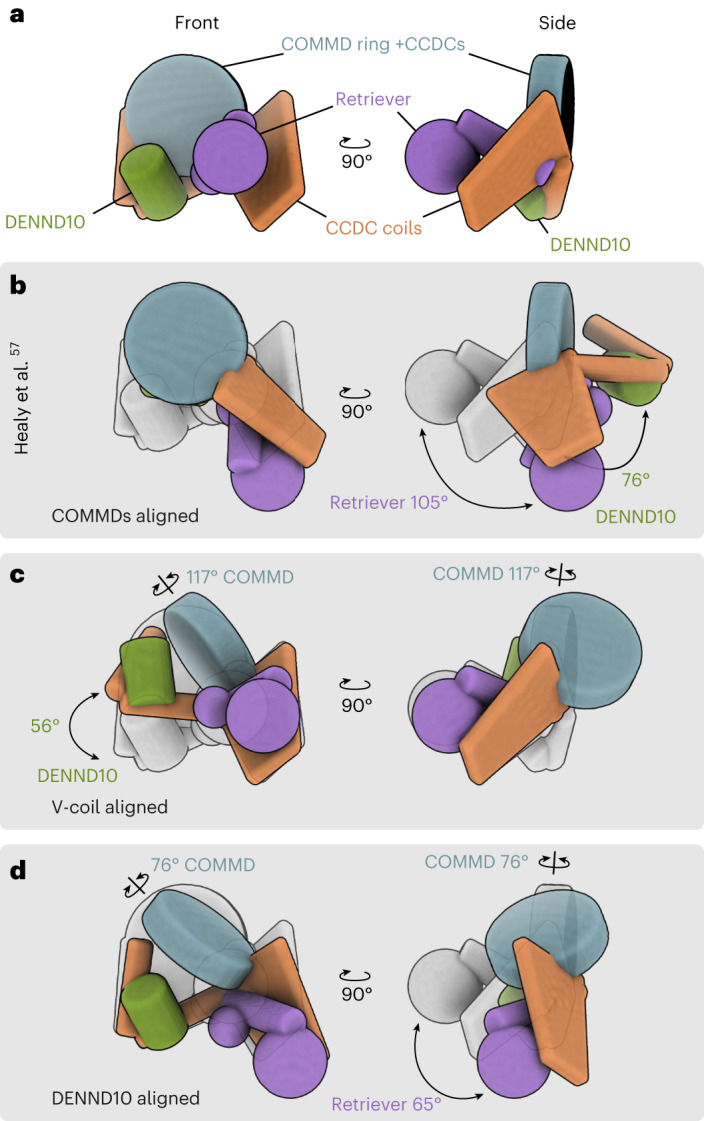
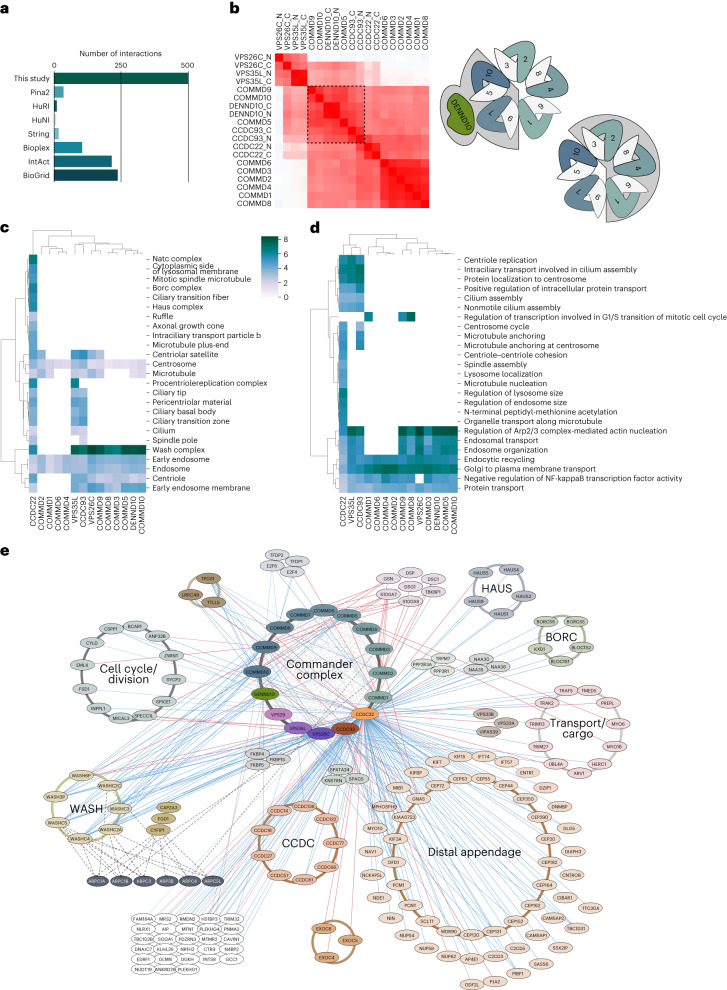
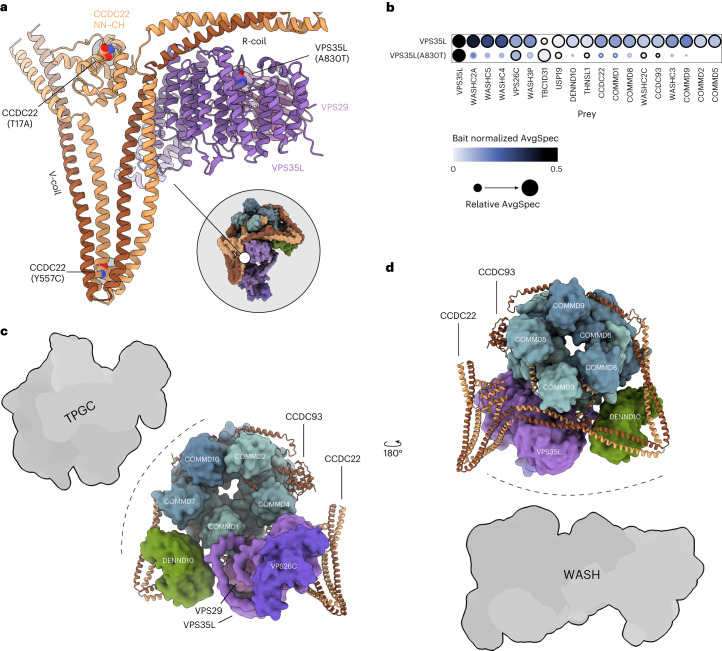
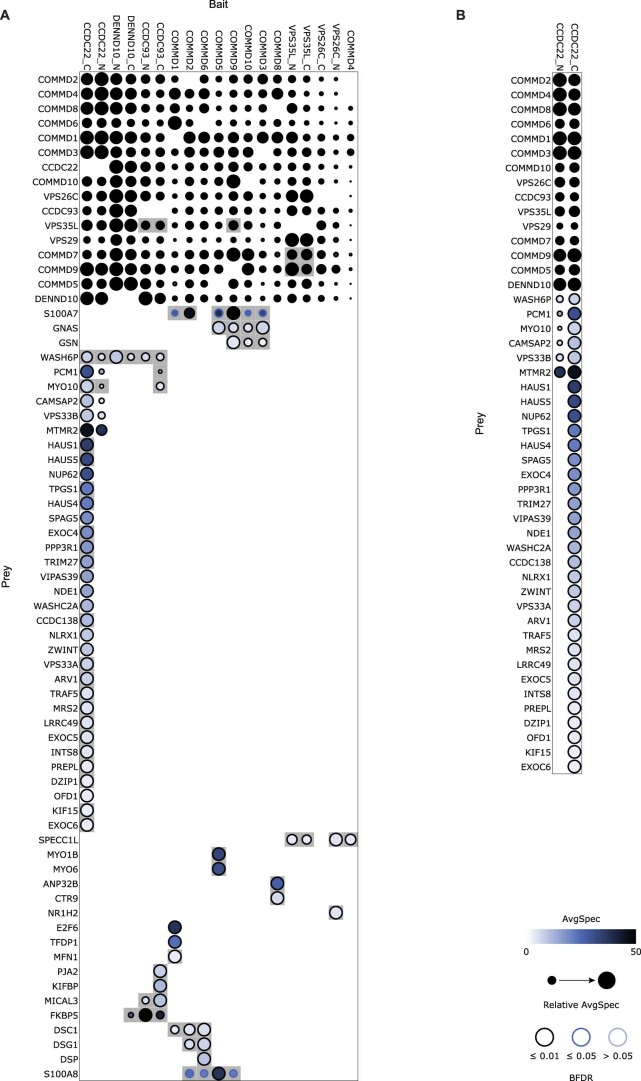
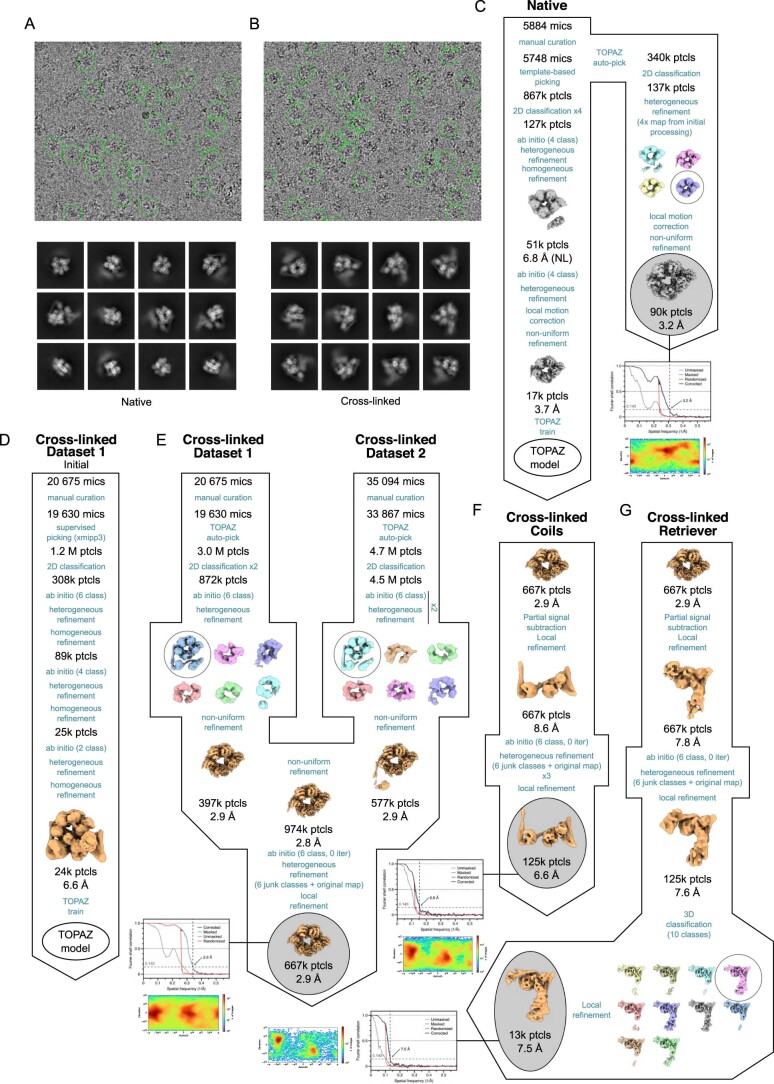
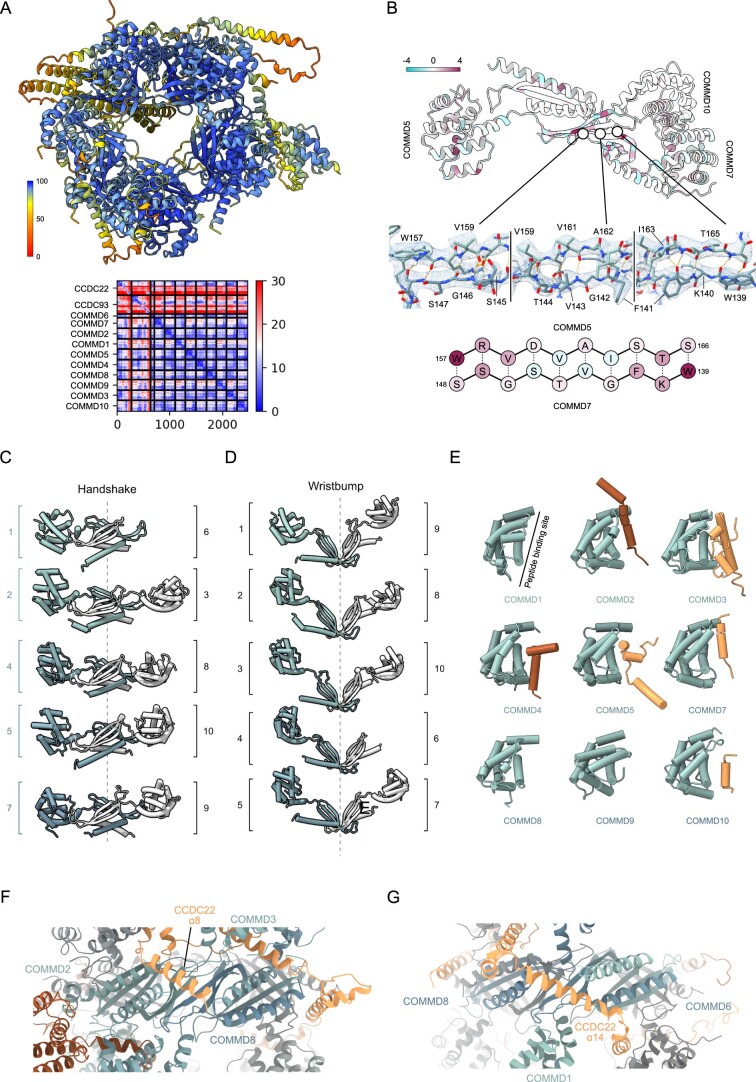
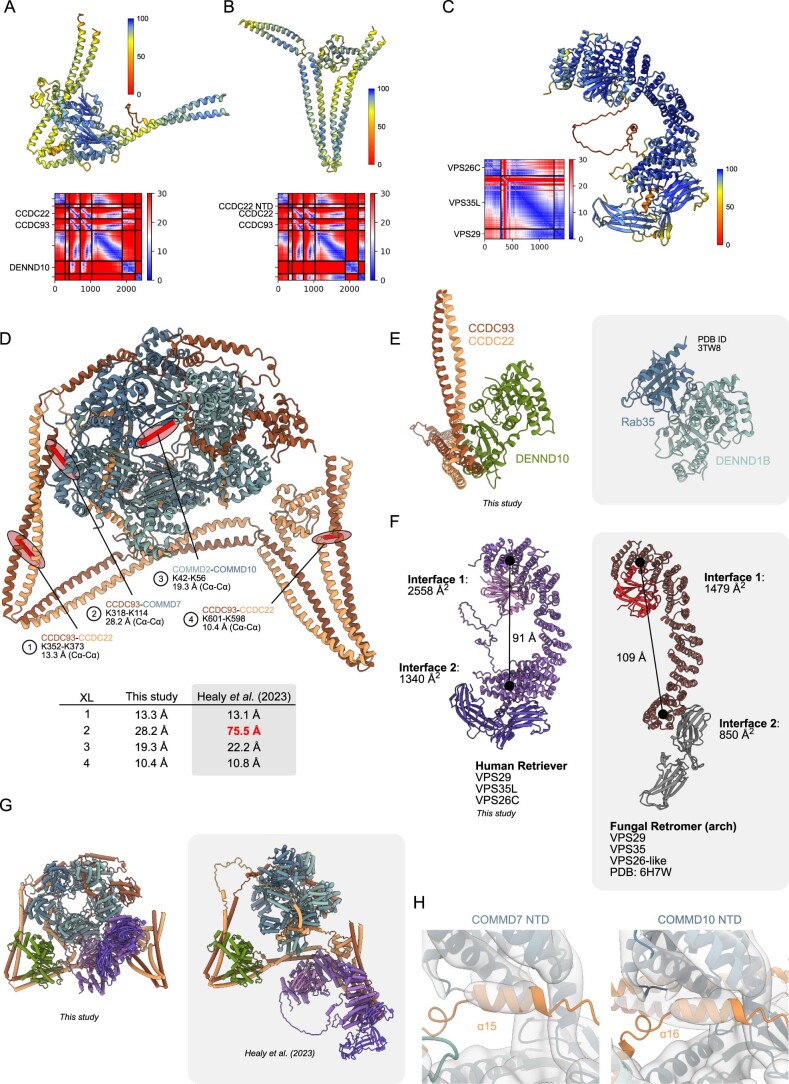
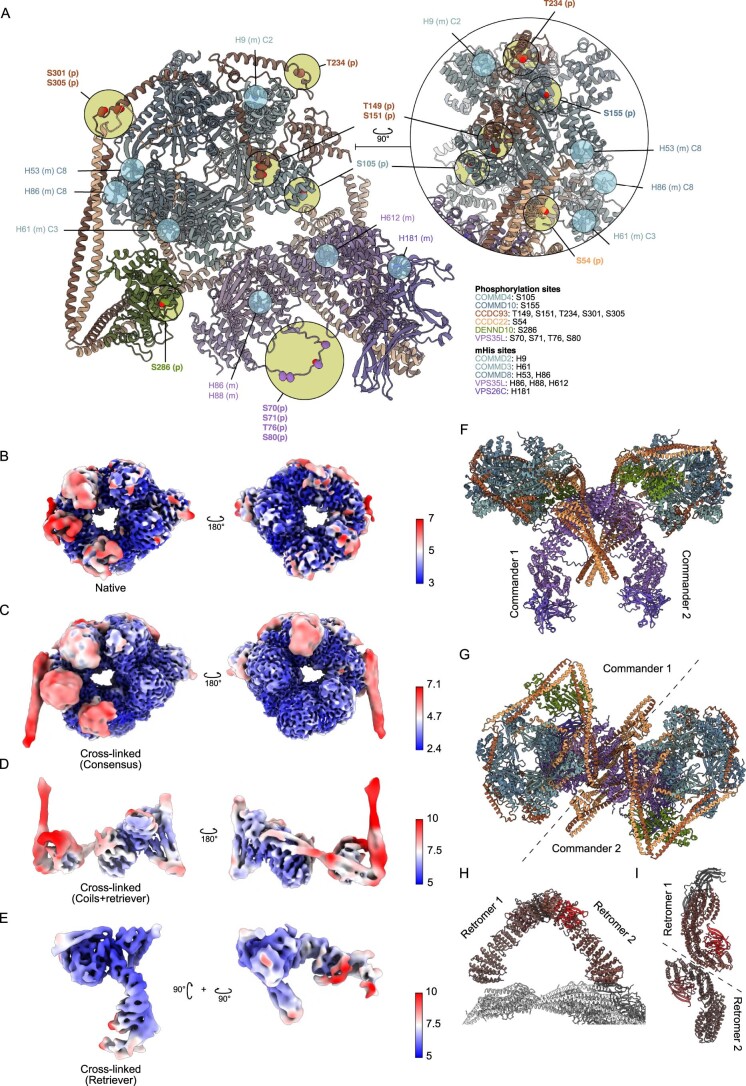
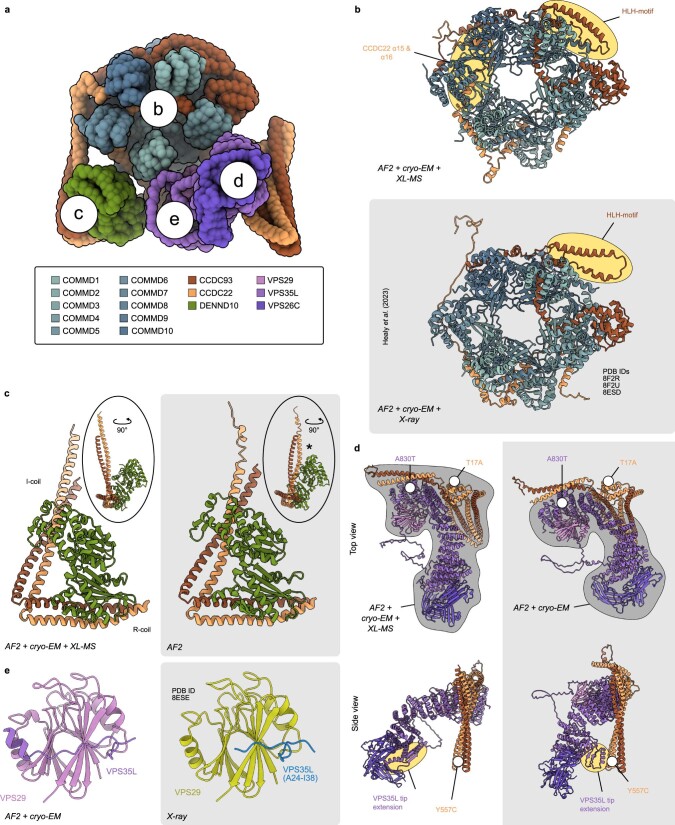
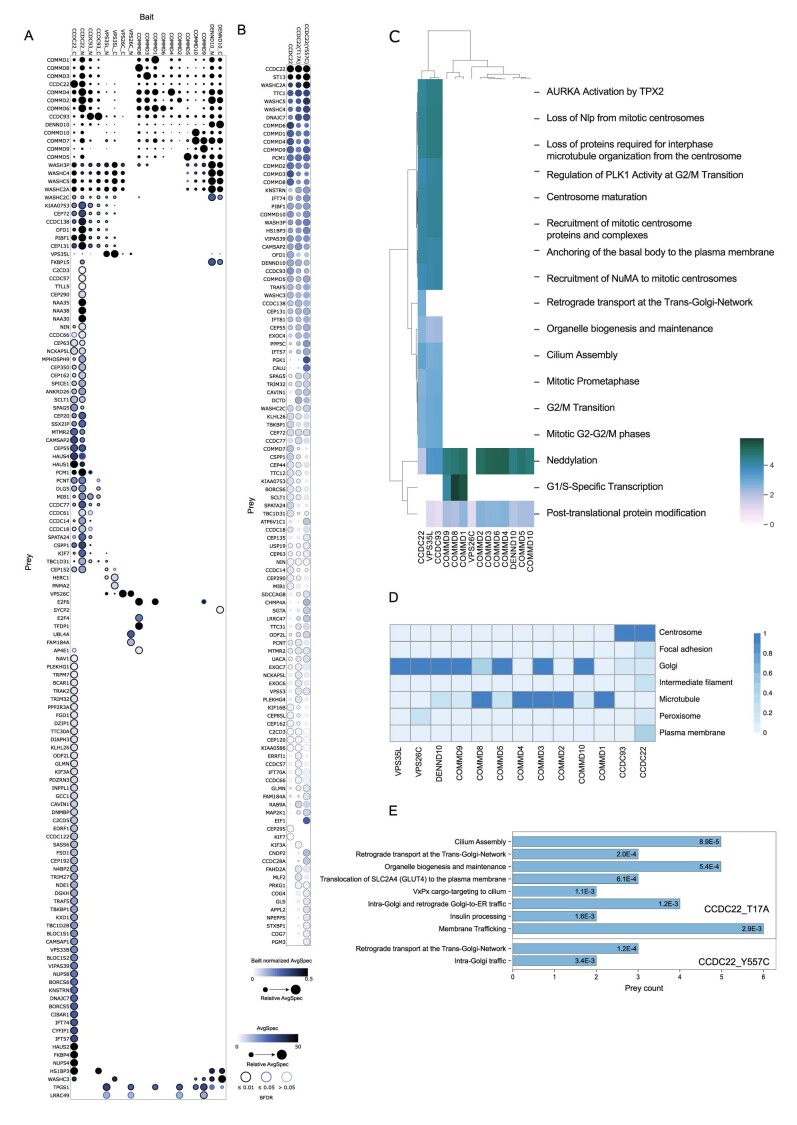
The Commander complex, a 16-protein assembly, plays multiple roles in cell homeostasis, cell cycle and immune response. It consists of copper-metabolism Murr1 domain proteins (COMMD1-10), coiled-coil domain-containing proteins (CCDC22 and CCDC93), DENND10 and the Retriever subcomplex (VPS26C, VPS29 and VPS35L), all expressed ubiquitously in the body and linked to various diseases. Here, we report the structure and key interactions of the endogenous human Commander complex by cryogenic-electron microscopy and mass spectrometry-based proteomics. The complex consists of a stable core of COMMD1-10 and an effector containing DENND10 and Retriever, scaffolded together by CCDC22 and CCDC93. We establish the composition of Commander and reveal major interaction interfaces. These findings clarify its roles in intracellular transport, and uncover a strong association with cilium assembly, and centrosome and centriole functions.


Conflict of interest statement

The authors declare no competing interests.

Figures

Fig. 1
Fig. 1. Purification and analysis of the endogenous Commander complex.
a, Schematic of the study design using AP–MS, proximity-dependent BioID–MS, crosslinking (XL)–MS, size-exclusion chromatography (SEC) and cryo-EM. b, The known 16 members of the Commander complex proteins, their molecular weights (in kDa) and known domain compositions. The 14 complex proteins used as baits in the studies are shown in a normal, roman typeface. c, High-confidence and stable Commander complex interactome identified by AP–MS analysis. d, Stoichiometry analysis of N- or C-terminally tagged Commander complex components identified with AP–MS. The color of each circle represents the abundance of each prey normalized to the mean abundance of the bait, and the circle radius indicates the relative abundance across all samples. e, Size-exclusion chromatography of the purified Commander complex with or without crosslinking. The peak indicated in gray background was used for cryo-EM analysis. a.u., arbitrary units. Source data
Fig. 2
Fig. 2. Cryo-EM maps of the Commander complex.
a,b, Cryo-EM maps of the Commander complex COMMD-ring from native (gray) (a) and from crosslinked (gold) (b) samples. The insets show the I-coil region from both maps at lower isosurface threshold. c, Focused cryo-EM density map with DENND10 and CCDC22/93 coiled coils (focused map 1). d, Focused cryo-EM density map with Retriever subregion (focused map 2). e, A composite map of the complete Commander complex. f, Same as in e, rotated 90° around the x axis as indicated. The inset shows the structural detail of the map from within the COMMD-ring. Source data
Fig. 3
Fig. 3. Structure of the COMMD-ring.
a, The structure of the COMMD-ring is shown as a ribbon representation from the side. COMMD domains and NTDs are indicated. b, Heatmap depicting model-to-map cross-correlation coefficients for COMMD domains placed in each COMMD map region after real space refinement. c, Schematic diagram of COMMD-ring subunit organization. COMMDs with NTDs toward the viewer are indicated in blue-green shades, while COMMDs with NTDs away from the viewer are indicated in white. Handshake, wristbump, over-1 and over-2 interactions are indicated. d, Schematic representation of the NTD organization within the COMMD-ring. Numbers indicate COMMD proteins. Colors as in c. COMMD6 is indicated in dashed lines as it lacks an NTD. e,f, Superposed COMMD chains depicting the handshake (e) and wristbump (f) interactions between two chains with range of interaction surface areas for each COMMD pair. Angles of NTD rotation along the indicated hinge axes are shown. Colors as in c. g, Model of over-1 interaction between COMMDs 2 and 5. Interacting residues in gold, with buried surface area ranges indicated. h, Model of over-2 interaction between COMMDs 5 and 2, colors as in g. i, Overview of CCDCs intertwined within the COMMD-ring. jl, Major CCDC interaction sites with COMMD chains. j, CCDC93 NN–CH domain binds the side of COMMD4 NTD and encircles the COMMD2 NTD in a headlock with HLH motif contacting the NN–CH domain. Experimentally identified phosphorylation sites are indicated. k, Top view of the COMMD-ring, showing the arrangement of CCDC93 α10–α13. The inset shows the hydrophobic binding pocket of α12 on COMMD7. Coloring indicates hydrophobic (yellow) and hydrophilic (cyan) surfaces. l, CCDC22 forms a bilateral interaction interface between COMMD3 and COMMD8. The loop protruding out of the density map between α13 and α14 of CCDC22 as well as the NN–CH domain of CCDC22 are indicated. NTD, N-terminal domain; CH, C-terminal helix; Ct, C-terminus.
Fig. 4
Fig. 4. Structures and interactions of the effector subunits.
a, CCDC22/93 coiled-coil regions, NTD of CCDC22 and DENND10 in density. The inset shows the binding site of CCDC22 NN–CH between the C-terminal V-coil characterized by hydrophobic and hydrophilic interfaces. Ser54 phosphorylation site identified in this study is indicated. b, DENND10 interface with R-coil of CCDC22/93. The major interface consists of a hydrophobic core along the groove of the R-coil and a charged patch on the C-terminal side of R-coil. c, The structure of the Retriever subcomplex in the context of Commander. Four experimentally identified phosphorylation sites (Ser70, Ser71, Thr76 and Ser80) are indicated in the disordered intervening N-terminal region of the model. The insets show the Retriever interfaces with CCDC22/93 through the C-terminal part of VPS35L, mainly via charged interactions. The N-terminal extension of VPS35L is shown in density where contributions from VPS29 and VPS35L C-terminal parts have been masked and low-pass filtered. d, Interfaces between the mobile NTD of COMMD1 with both DENND10 and VPS29/VPS35L. The insets show the first, middle and last frames of component 1 from 3D variability analysis (3DVA), reconstructed from particles using the intermediates job type. e, Interaction between VPS35L and VPS29 (top) compared to corresponding interaction in fungal Retromer arch (PDB 6H7W). The N-terminal extension of VPS35L accounts for nearly 33% of the buried interface. f, Interaction between VPS35L and VPS26C compared to the fungal VPS35–VPS26 interface. The insets show that VPS35L contains an extended helix that provides an expanded binding interface to VPS26C. Side chains in a and b are included only for visualization purposes.
Fig. 5
Fig. 5. Analysis of overall tertiary fold of the endogenous Commander complex compared to existing literature.
a, A simplified ‘ragdoll’ representation of major components of the Commander complex from this study. bd, The overall structural model from Healy et al. highlight the major differences between these models with alignment centers of the models located at the COMMD-ring (b), V-coil (c) and DENND10 (d). The COMMD-ring is represented by a disc aligned to the COMMD domains, the coiled-coil domains are represented by cylinders (I- and R-coils) or a trapezoidal prism (V-coil + CCDC22 NN–CH), DENND10 as a cylinder and Retriever subcomplex as spheres (VPS29, VPS26C + N-terminal half of VPS35L α-solenoid) or a cylinder (VPS35L C-terminal half of VPS35L α-solenoid). Component relative rotation angles are calculated based on the underlying atomic coordinates of backbone Cα atoms.
Fig. 6
Fig. 6. Molecular context, cellular interactions and functions of the Commander complex.
a, Comparison of high-confidence Commander complex interactions (from BioID–MS) to interactions in databases. b, Bait–bait clustering of BioID interactions of Commander proteins reveals two distinct clusters suggesting two different subcomplexes. c,d, GO-CC (c) and GO-BP (d) term analysis and clustering based on Commander complex BioID interactions. e, Complete map of the molecular interactions formed by the Commander complex. The key shows the Commander complex components used as baits color coded as in Fig. 1, identified interactions with AP–MS and BioID are shown as red and blue edges, respectively. Reciprocal interactome analysis with ARP proteins is shown in the lower right corner. Interacting proteins are organized to designated protein complexes (CORUM; with brown to light orange-colored circles), and based on their function (light gray circles). The nodes linked to cilium assembly (based on GO-BP) are shown with a light orange node color.
Fig. 7
Fig. 7. RSS and XLID related mutations and putative interaction interfaces of the Commander complex.
a, Three mutations associated with RSS or XLID highlighted within the context of the Commander complex structure. b, Effect of A830T mutation on VPS35L in BioID–MS. All PPIs passing HCI criteria to either wild-type VPS35L or VPS35L(A830T) are plotted for both constructs, with HCIs indicated using a black outline and non-HCIs with a light blue outline. Node color corresponds to the bait normalized abundance of the average spectral count for each prey, and node radius to its relative abundance across all baits determined by ProHits-Viz. c, Composite model of the Commander complex, indicating putative interaction interfaces with TPGC. d, Rotated view of the model in c, with putative interaction interface of the WASH complex indicated.
Extended Data Fig. 1
Extended Data Fig. 1. Affinity purification mass spectrometry analysis of Commander components, related to Fig. 1.
a, Dot-plot visualization (BFDR ≤ 0.05) of the Commander complex proteins’ interactors detected by the AP-MS. Each node corresponds to the abundance of the average spectral count for each prey, and the node size relative abundance of the prey. BFDR values are indicated with circles around the node, and previously uncharacterized interactions are highlighted with gray background. b, Focused Dot-plot visualization of the CCDC22 interactions. Commander complex components, WASH complex components, and proteins involved in WASH complex recruitment are indicated in bold typeface.
Extended Data Fig. 2
Extended Data Fig. 2. Cryo-EM of native and crosslinked Commander, related to Fig. 2.
a-b, Representative cryo-EM micrographs and selected 2D class averages of a native and b crosslinked Commander. Particle images have been low-pass filtered to 4 Å and show particles picked for the consensus map reconstruction. c-g, Cryo-EM data processing workflow for c, native Commander, d preliminary processing of crosslinked Commander dataset 1, e, final processing of crosslinked Commander datasets 1 and 2 consensus maps, f, focused map 1 of crosslinked Commander datasets (coiled coil region), and g, focused map 2 of crosslinked Commander datasets (Retriever subcomplex).
Extended Data Fig. 3
Extended Data Fig. 3. Molecular models of Commander complex top half, related to Fig. 3.
a, AF2 prediction and the predicted alignment error (PAE) plot of the top half of the Commander complex, constituting the full sequences of COMMDs and residues 120–392 of CCDC22 and residues 21–377 of CCDC93. b, Top: Example wristbump interface between COMMD5 and COMMD7. Middle: three closeups of the model in cryo-EM density, highlighting the residues involved in the wristbump interaction interface between COMMD5 and COMMD7. Bottom: schematic representation of the example wristbump interface. Coloring is by sequence conservation within the human COMMD proteins in Top and Bottom subpanels. c-d, Structural models of all c, handshake and d, wristbump interactions. e, Models of NTDs of COMMD proteins (except COMMD6) depicted alongside parts of CCDC93 or CCDC22 that interact with them at the peptide binding site. f-g, Detail of f CCDC22 α8 or g CCDC22 α14 binding site on the COMMD-ring.
Extended Data Fig. 4
Extended Data Fig. 4. Molecular models of Commander complex bottom half, related to Fig. 4.
a, AF2 model of DENND10 region of the Commander complex used as an initial model with predicted alignment error plots indicating the relevant chains. Model is colored according to per-residue pLDDt scores. Model has been trimmed based on the fit to the cryo-EM density map. AF2 model contained all chains of the bottom half during prediction. b, V-coil region of Commander as in a, with different random seed in AF2 prediction. c, Retriever subcomplex model as in a. d, Chemical crosslinks identified by MS in the context of the Commander structure model. e, Comparison of DENND1B-Rab35 complex structure (PDB 3TW8) with DENND10 in the context of Commander. I-coil sterically blocks the putative Rab binding site on DENND10. f, Structure of Retriever in the context of the Commander complex compared to the Fungal retromer structure. Interface 1: VPS29-VPS35(L). Interface 2: VPS35(L)-VPS26(C). Retriever adopts a contracted conformation compared to retromer and exhibits larger interaction interfaces. g, Comparison of Commander complex models presented in this study (left) and in Healy et al. (right), kindly provided by the authors, superposed via DENND10. h, Density supporting the placement of CCDC22 α15 and α16. Map (EMD-17340) was low-pass filtered to 7 Å.
Extended Data Fig. 5
Extended Data Fig. 5. Detected post-translational modifications, local resolution estimates and putative dimerization mode of Commander complex, related to Figs. 1, 3, and 4.
a, Molecular model of Commander complex with all detected phosphorylation and histidine methylation sites. m: met-His site, p: phosphorylation site. Inset: rotated model showing details on the CCDC93 NN-CH domain side of the complex. b-e, Local resolution estimates of cryo-EM maps from b native Commander, c crosslinked Commander consensus map d crosslinked Commander focused map 1 (Coils) and e crosslinked Commander focused map 2 (Retriever). Color bar indicates resolution in Å. f, Model of putative head-to-head dimerization of Commander complex prepared by superposition via VPS29 and VPS35(L) C-terminal region. g, Top view of the model in f. h, Retromer arch model (PDB ID 6H7W) depicted in the same orientation as Commander dimer model in f. i, Top view of the model in h. Models in h-i color-coded as in Extended Data Fig. 4f.
Extended Data Fig. 6
Extended Data Fig. 6. Comparative analysis of conformational variation in the Commander complex structure compared to existing literature, related to Fig. 5.
a, Overview of the Commander complex structure with location of following panels indicated. Comparison of b the COMMD-ring, c DENND10, I-coil, and R-coil region, d Retriever subcomplex from the structure presented in this study and the overall model presented by Healy et al. e, Comparison of VPS29 with VPS35L (13-37) presented in this study (left) and crystal structure of VPS29 with VPS35L (16-38) peptide (right). Major structural differences are highlighted with yellow, and sources of structural data are indicated for each structure. The three disease mutations analyzed in AP-MS and BioID (Fig. 7) are indicated in d.
Extended Data Fig. 7
Extended Data Fig. 7. Molecular interactors, context, and cellular pathways connected with individual Commander complex components, related to Fig. 6.
a, Dot-plot visualization (BFDR ≤ 0.05) of interactors of the Commander complex detected by the BioID-MS. Node color corresponds to the abundance of the average spectral count for each prey, and node radius to its relative abundance. b, Dot-plot visualization of RSS syndrome related point mutants of CCDC22 analyzed by BioID-MS. All PPIs passing HCI criteria to any of the CCDC22 variants are plotted, with HCIs are indicated with black outline and non-HCIs with light blue. Node color corresponds to the bait normalized abundance of the average spectral count for each prey, and node radius to its relative abundance across all baits determined by ProHits-Viz. c, Reactome pathways enriched for the Commander complex proteins. d, Molecular level localization of the Commander complex proteins obtained by MS-microscopy. e, Reactome pathways enriched (p < 0.005, values marked in bars) for the RSS disease variant HCIs distinct from the wild-type CCDC22.

References

    1. Wang J, et al. Endosomal receptor trafficking: retromer and beyond. Traffic. 2018;19:578–590. doi: 10.1111/tra.12574. - DOI - PMC - PubMed
    1. Dey G, Jaimovich A, Collins SR, Seki A, Meyer T. Systematic discovery of human gene function and principles of modular organization through phylogenetic profiling. Cell Rep. 2015;10:993–1006. doi: 10.1016/j.celrep.2015.01.025. - DOI - PMC - PubMed
    1. Hein MY, et al. A human interactome in three quantitative dimensions organized by stoichiometries and abundances. Cell. 2015;163:712–723. doi: 10.1016/j.cell.2015.09.053. - DOI - PubMed
    1. Huttlin EL, et al. The BioPlex network: a systematic exploration of the human interactome. Cell. 2015;162:425–440. doi: 10.1016/j.cell.2015.06.043. - DOI - PMC - PubMed
    1. Li Y, Calvo SE, Gutman R, Liu JS, Mootha VK. Expansion of biological pathways based on evolutionary inference. Cell. 2014;158:213–225. doi: 10.1016/j.cell.2014.05.034. - DOI - PMC - PubMed

MeSH terms

Substances