. 2024 Mar 8;23(1):48.
doi: 10.1186/s12943-024-01965-5.

Activation of the PI3K/AKT signaling pathway by ARNTL2 enhances cellular glycolysis and sensitizes pancreatic adenocarcinoma to erlotinib

Affiliations

Activation of the PI3K/AKT signaling pathway by ARNTL2 enhances cellular glycolysis and sensitizes pancreatic adenocarcinoma to erlotinib

Weiyu Ge et al. Mol Cancer. .

Abstract

Background: Pancreatic adenocarcinoma (PC) is an aggressive malignancy with limited treatment options. The poor prognosis primarily stems from late-stage diagnosis and when the disease has become therapeutically challenging. There is an urgent need to identify specific biomarkers for cancer subtyping and early detection to enhance both morbidity and mortality outcomes. The addition of the EGFR tyrosine kinase inhibitor (TKI), erlotinib, to gemcitabine chemotherapy for the first-line treatment of patients with advanced pancreatic cancer slightly improved outcomes. However, restricted clinical benefits may be linked to the absence of well-characterized criteria for stratification and dependable biomarkers for the prediction of treatment effectiveness.

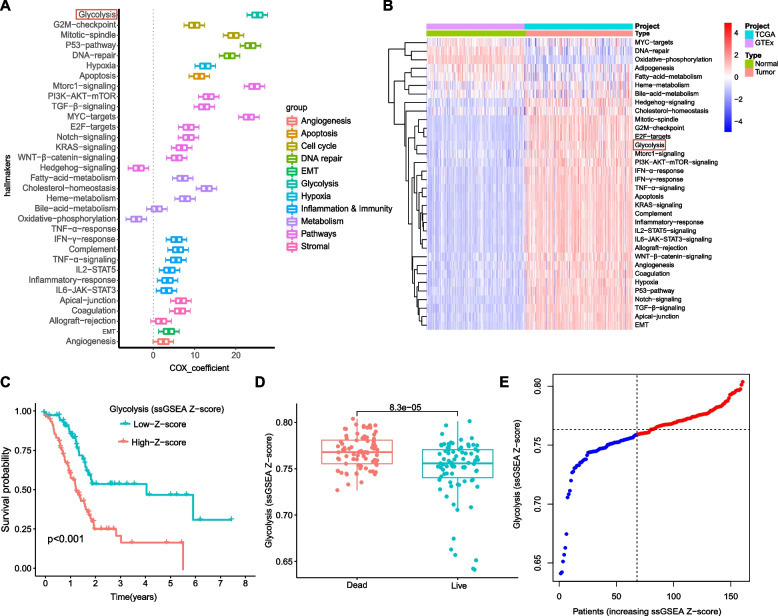
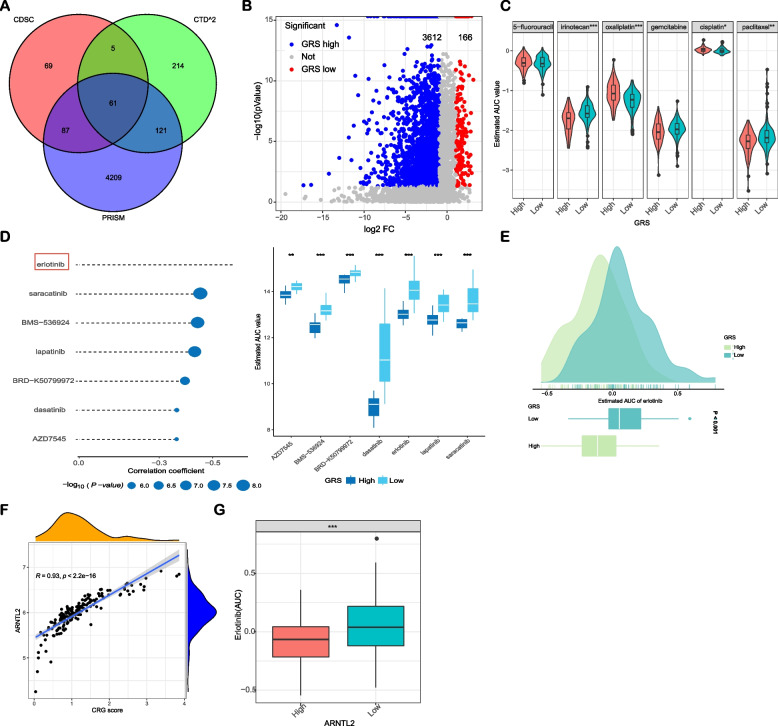
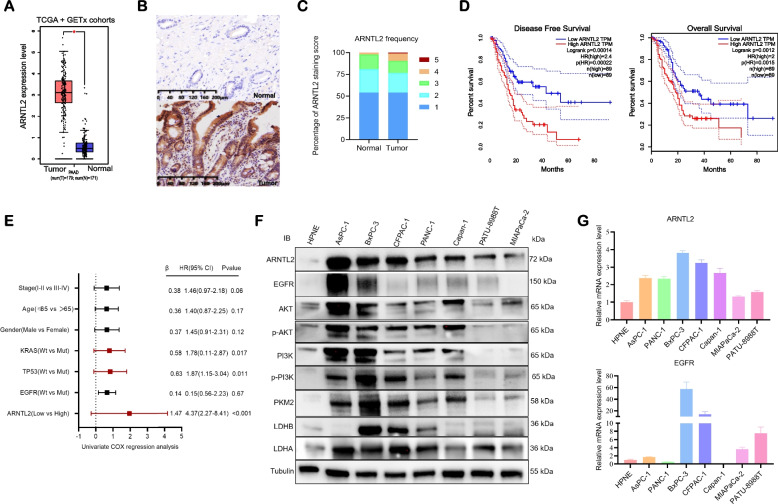
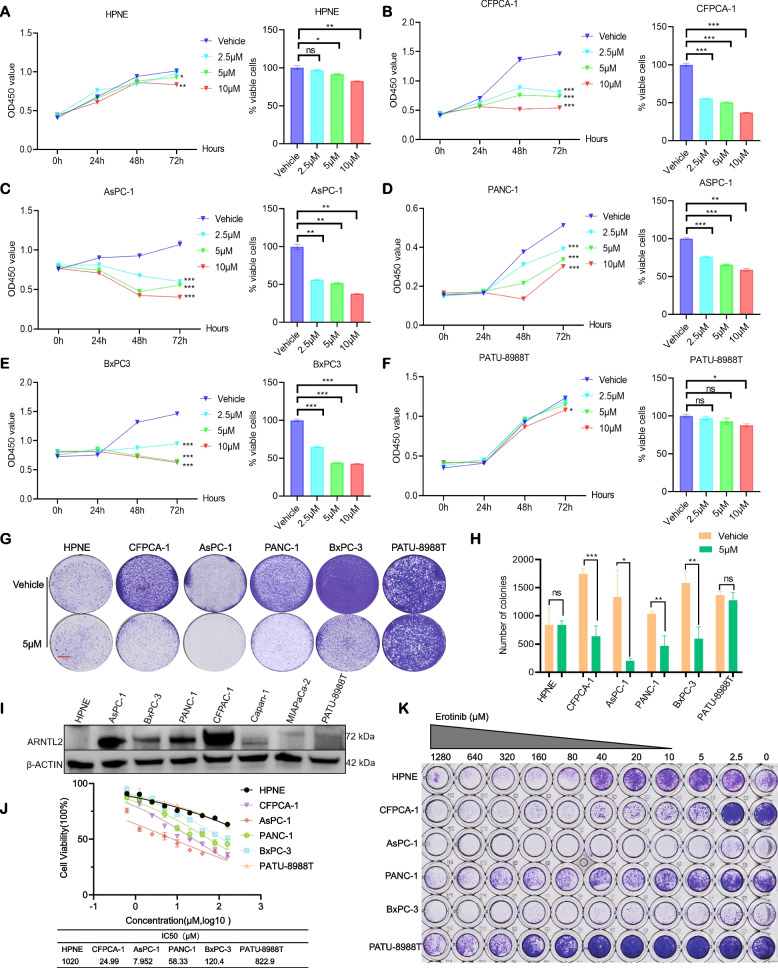
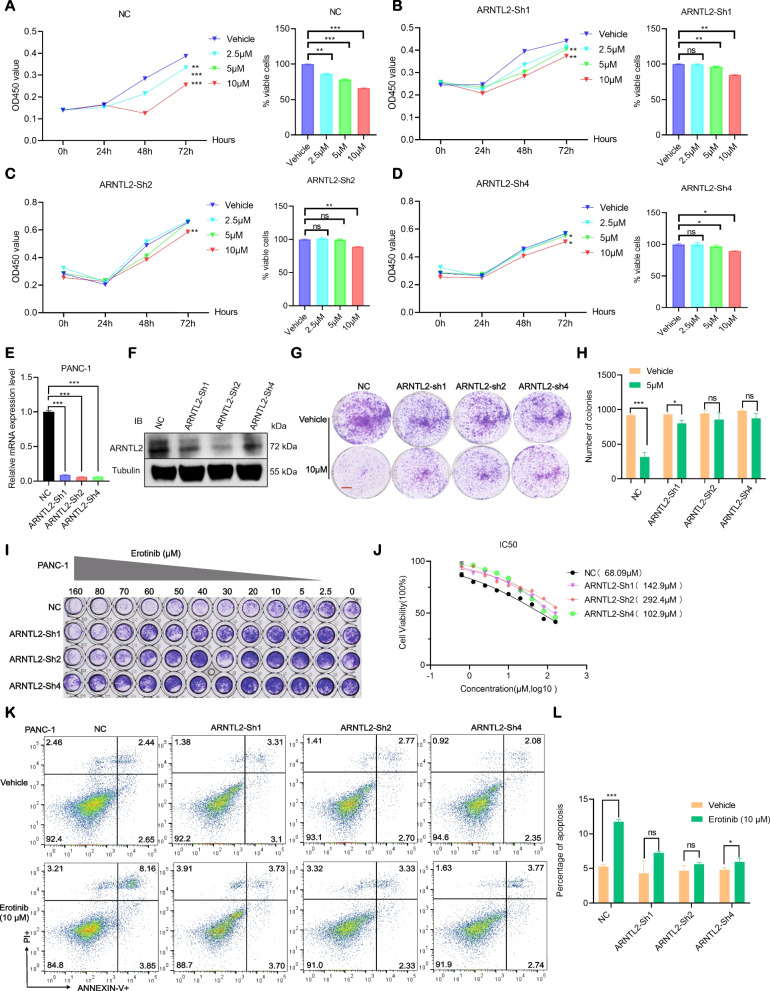
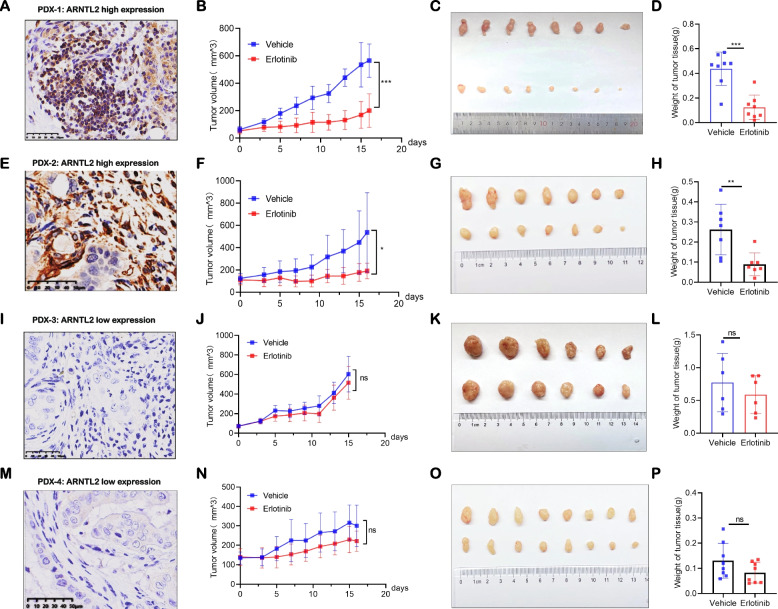
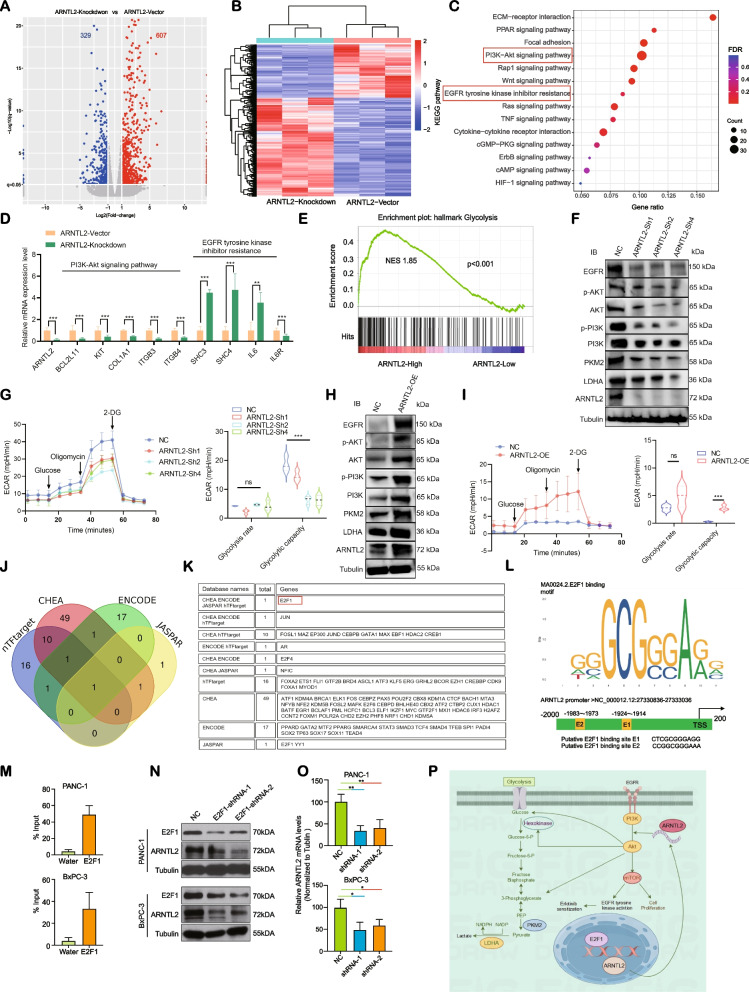
Methods and results: We examined the levels of various cancer hallmarks and identified glycolysis as the primary risk factor for overall survival in PC. Subsequently, we developed a glycolysis-related score (GRS) model to accurately distinguish PC patients with high GRS. Through in silico screening of 4398 compounds, we discovered that erlotinib had the strongest therapeutic benefits for high-GRS PC patients. Furthermore, we identified ARNTL2 as a novel prognostic biomarker and a predictive factor for erlotinib treatment responsiveness in patients with PC. Inhibition of ARNTL2 expression reduced the therapeutic efficacy, whereas increased expression of ARNTL2 improved PC cell sensitivity to erlotinib. Validation in vivo using patient-derived xenografts (PDX-PC) with varying ARNTL2 expression levels demonstrated that erlotinib monotherapy effectively halted tumor progression in PDX-PC models with high ARNTL2 expression. In contrast, PDX-PC models lacking ARNTL2 did not respond favorably to erlotinib treatment. Mechanistically, we demonstrated that the ARNTL2/E2F1 axis-mediated cellular glycolysis sensitizes PC cells to erlotinib treatment by activating the PI3K/AKT signaling pathway.

Conclusions: Our investigations have identified ARNTL2 as a novel prognostic biomarker and predictive indicator of sensitivity. These results will help to identify erlotinib-responsive cases of PC and improve treatment outcomes. These findings contribute to the advancement of precision oncology, enabling more accurate and targeted therapeutic interventions.

Keywords: ARNTL2; Erlotinib; Pancreatic adenocarcinoma; Prognosis; Targeted therapy, precision oncology.


Conflict of interest statement

The authors declare no competing interests.

Figures

Fig. 1
Fig. 1
Glycolysis is identified as the primary risk factor for survival. A Univariate Cox regression analysis indicated that glycolysis was the primary risk factor among various hallmarks of cancer; B Heatmap showing differentially enriched biological pathways between normal and PC tumor tissues; C Kaplan–Meier analysis showed that patients with higher ssGSEA scores of glycolysis displayed worse OS; D-E Glycolysis ssGSEA scores were significantly elevated in patients who died during follow up. Survival difference was compared using the log-rank test
Fig. 2
Fig. 2
Identification of erlotinib with higher drug sensitivity in PC patients with high-GRS. A Venn diagram for summarizing included candidate agents from CTD2, GDSC, and PRISM datasets; B Volcano plot of differential candidate agents between low-GRS and high-GRS groups. (Wilcoxon rank-sum test: adjust p < 0.05, and log2FC > 1); C The differential drug response analysis of current treatment for advanced pancreatic cancer; D The results of Spearman’s correlation analysis and differential drug response analysis of seven candidate agents; E Comparison of estimated erlotinib’s sensitivity (logAUC) between low-GRS and high-GRS groups; F Relationship between erlotinib’s sensitivity and the expression of ARNTL2 in PC; G Expression level of ARNTL2 between low-GRS and high-GRS groups
Fig. 3
Fig. 3
The functional implications of ARNTL2 and its relationship with EGFR in PC. A mRNA expression of ARNTL2 in PC from TCGA cohort and normal tissues from GTEx cohort; B Protein expression of ARNTL2 in PC and normal tissues; C IHC score of ARNTL2 in pancreatic cancer TMAs; D Kaplan–Meier survival analysis of the correlation between ARNTL2 expression and OS and DFS of PC patient in TCGA cohort; E The univariate Cox regression analysis were performed to depict the correlations between ARNTL2 expression and the clinicopathological features; F The protein expression levels of ARNTL2, EGFR and EGFR downstream signaling PI3K/AKT signaling pathway in PC cell lines (AsPC-1, BxPC-3, PANC-1, CFPAC-1, Capan-1, PATU-8988 T and MIAPaCa-2) and normal pancreatic duct cells (HPNE) were determined by western blot analysis; G The mRNA expression levels of ARNTL2 and EGFR in PC cell lines and normal pancreas cells were determined by qRT-PCR analysis. All data are presented as the mean ± SEM of triplicate experiments. *p < 0.05 by repeated measures with Student’s t-test
Fig. 4
Fig. 4
ARNTL2 highly expressed PC cells are sensitive to erlotinib in vitro. Cell proliferation of HPNE cells (A), CFPAC-1 (B), AsPC-1 (C), PANC-1 (D), BxPC-3 (E) and PATU-8988 T (F) treated for 72 h with erlotinib at 2.5 μM, 5 μM and 10 μM, respectively; G-H Colony-formation assay of 5 pancreatic cancer cell lines and one normal pancreatic duct cells were grown in the absence or presence of erlotinib at the indicated concentrations for 7–10 days, fixed and stained; I ARNTL2 expression levels across the PC cell lines; J IC50 assay of erlotinib in pancreatic cancer cell lines and normal pancreatic duct cells (K) Synergistic response to erlotinib treatment in pancreatic cancer cell lines and normal pancreatic duct cells. All data are presented as the mean ± SEM of triplicate experiments. *p < 0.05; **p < 0.01; ***p < 0.001 by repeated measures with Student’s t test
Fig. 5
Fig. 5
ARNTL2 knockdown limits the response of PC cells to erlotinib. A-D Cell proliferation of PANC-1 cells incubated with shRNA-1, shRNA-2, and shRNA-4 against ARNTL2 or control (NC) and treated for 72 h with erlotinib at 2.5 μM, 5 μM, and 10 μM, respectively; EF ARNTL2 knockdown efficiency of the shRNAs was measured by western blotting and q-PCR, respectively; G-H Colony-formation assay of PANC-1 cells incubated with shRNA-1, shRNA-2 and shRNA-4 against ARNTL2 or control (NC) were grown in the absence or presence of erlotinib at the indicated concentrations for 7–10 days, fixed and stained; I Synergistic response to erlotinib treatment in PANC-1 cells incubated with shRNA-1, shRNA-2 and shRNA-4 against ARNTL2 or control (NC); J IC50 assay of erlotinib in PANC-1 cells incubated with shRNA-1, shRNA-2 and shRNA-4 against ARNTL2 or control (NC). K-L Flow cytometry analysis of erlotinib-induced cell apoptosis in ARNTL2 knockdown PANC-1 cells treated with erlotinib and stained with Annexin V-APC-633/PI. All data are presented as the mean ± SEM of triplicate experiments. *p < 0.05; **p < 0.01; ***p < 0.001 by repeated measures with Student’s t test
Fig. 6
Fig. 6
Overexpression of ARNTL2 sensitizes PC cells to erlotinib treatment. A-B Cell proliferation of ARNTL-vector, ARNTL2-OE PATU-8988 T and treated for 72 h with erlotinib at 2.5 μM, 5 μM and 10 μM, respectively; C-D ARNTL2 overexpression efficiency was measured by western blotting and q-PCR, respectively; EF Colony-formation assay of ARNTL2-overexpression PATU-8988 T cells and control cells(NC) were grown in the absence or presence of erlotinib at the indicated concentrations for 7–10 days, fixed and stained; G Synergistic response to erlotinib treatment in ARNTL2-overexpression PATU-8988 T cells and control cells(NC); H IC50 assay of erlotinib in ARNTL2-overexpression PATU-8988 T cells and control cells(NC); I-J Flow cytometry analysis of erlotinib-induced cell apoptosis in ARNTL2-overexpression PATU-8988 T cells and control cells(NC) treated with erlotinib and stained with Annexin V-APC-633/PI. All data are presented as the mean ± SEM of triplicate experiments. *p < 0.05; **p < 0.01; ***p < 0.001 by repeated measures with Student’s t test
Fig. 7
Fig. 7
Erlotinib has strong therapeutic implications for ARNTL2-high patients in patient-derived xenografts. A, E, I, M Images illustrating the IHC staining for human ARNTL2 in PC-PDX1 (A), PC-PDX2 (E), PC-PDX3(I), and PC-PDX4(M); (B, F, J, N) Tumor growth curves of PC-PDX1 (B), PC-PDX2 (F), PC-PDX3 (J) and PC-PDX4 (N) treated with erlotinib and vehicle. Arrows indicate the day when treatment started; (C, G, K, O) Representative tumor images of erlotinib and vehicle group of PC-PDX1 (C), PC-PDX2 (G), PC-PDX3(K) and PC-PDX4 (O) at the end of treatment; (D, H, L, P) Quantitative analysis of PC-PDX1 (D), PC-PDX2(H), PC-PDX3 (L) and PC-PDX4(P) weight at the end of treatment; All data are presented as the mean ± SEM of triplicate experiments. **p < 0.01; ***p < 0.001 by repeated measures with Student’s t-test
Fig. 8
Fig. 8
ARNTL2/E2F1 axis-mediated glycolysis sensitizes PC cells to erlotinib treatment via activating the PI3K/AKT pathway. A Volcano plot of differentially expressed gene profiles (ARNTL2-Knockdown vs. ARNTL2-Vector); B Heatmap of the indicated genes in PANC-1 cells with or without ARNTL2 knockdown; C KEGG analysis indicated that PI3K-Akt signaling pathway served as one of the major enriched signaling in ARNTL2-Knockdown group; D The mRNA levels of the indicated genes in PANC-1 cells with or without ARNTL2 knockdown; E GSEA analysis identified the glycolytic status in high ARNTL2 expression group; F Western blot analysis identified that the protein levels of PI3K-Akt signaling pathway and glycolysis related molecules in PANC-1 cells were decreased in ARNTL2-silenced group; G Glycolysis rate of PANC-1 cells ARNTL2 knockdown was examined by a Seahorse XFe96 Glycolysis Stress Test analyzer; H Western blot analysis identified that the protein levels of PI3K-Akt signaling pathway and glycolysis related molecules in PATU-8988 T cells were increased in ARNTL2-overexpressed group; I Glycolysis rate of PATU-8988 T cells overexpressing ARNTL2 was examined by a Seahorse XFe96 Glycolysis Stress Test analyzer; J-K Venn diagrams of four gene lists: transcription factors predicted by the hTFtarget, CHEA, ENCODE and JASPAR databases, ARNTL2 is transcriptionally activated by E2F1; L E2F1-binding motifs and predicted E2F1-binding sites (E1and E2) on the promoter region of ARNTL2 were obtained from the JASPAR database; M Chromatins were isolated from PANC-1 and BxPC-3 cells. The binding of E2F1 and blank control (Water) to the ARNTL2 promoter was tested using ChIP assay. N and O PANC-1 and BxPC-3 cells were incubated with E2F1 shRNA-1 and shRNA-2 or control (NC), western blot and qRT-PCR were used to test the protein and mRNA levels of ARNTL2. P Schematic representation depicting the mechanisms that the E2F1/ARNTL2 mediated glycolysis sensitizes PC cells to erlotinib treatment via activating PI3K/AKT pathway. All data are presented as the mean ± SEM of triplicate experiments. *p < 0.05, **p < 0.01 by repeated measures with Student’s t-test

References

    1. Siegel RL, Miller KD, Wagle NS, Jemal A. Cancer statistics, 2023. CA Cancer J Clin. 2023;73:17–48. doi: 10.3322/caac.21763. - DOI - PubMed
    1. Xia C, Dong X, Li H, Cao M, Sun D, He S, Yang F, Yan X, Zhang S, Li N, Chen W. Cancer statistics in China and United States, 2022: profiles, trends, and determinants. Chin Med J (Engl) 2022;135:584–590. doi: 10.1097/CM9.0000000000002108. - DOI - PMC - PubMed
    1. Kolbeinsson HM, Chandana S, Wright GP, Chung M. Pancreatic Cancer: A Review of Current Treatment and Novel Therapies. J Invest Surg. 2023;36:2129884. doi: 10.1080/08941939.2022.2129884. - DOI - PubMed
    1. Wood LD, Canto MI, Jaffee EM, Simeone DM. Pancreatic Cancer: Pathogenesis, Screening, Diagnosis, and Treatment. Gastroenterology. 2022;163:386–402.e381. doi: 10.1053/j.gastro.2022.03.056. - DOI - PMC - PubMed
    1. Halbrook CJ, Lyssiotis CA. Pasca di Magliano M, Maitra A: Pancreatic cancer: Advances and challenges. Cell. 2023;186:1729–1754. doi: 10.1016/j.cell.2023.02.014. - DOI - PMC - PubMed

Publication types

MeSH terms