. 2024 Jul 27;73(2):419-433.
doi: 10.1093/sysbio/syae009.

Ecological Predictors of Organelle Genome Evolution: Phylogenetic Correlations with Taxonomically Broad, Sparse, Unsystematized Data

Affiliations

Ecological Predictors of Organelle Genome Evolution: Phylogenetic Correlations with Taxonomically Broad, Sparse, Unsystematized Data

Konstantinos Giannakis et al. Syst Biol. .

Abstract

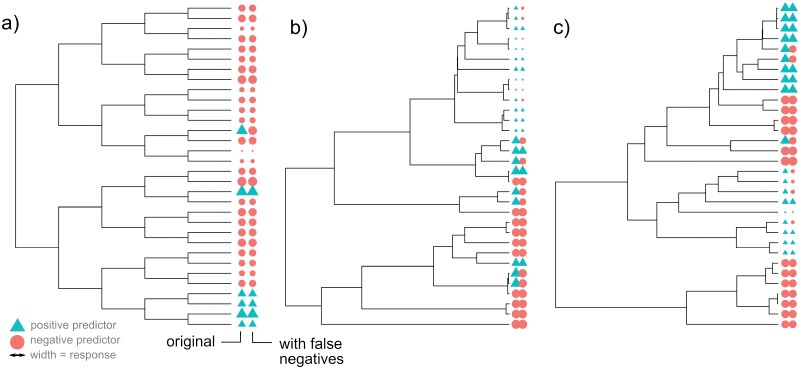
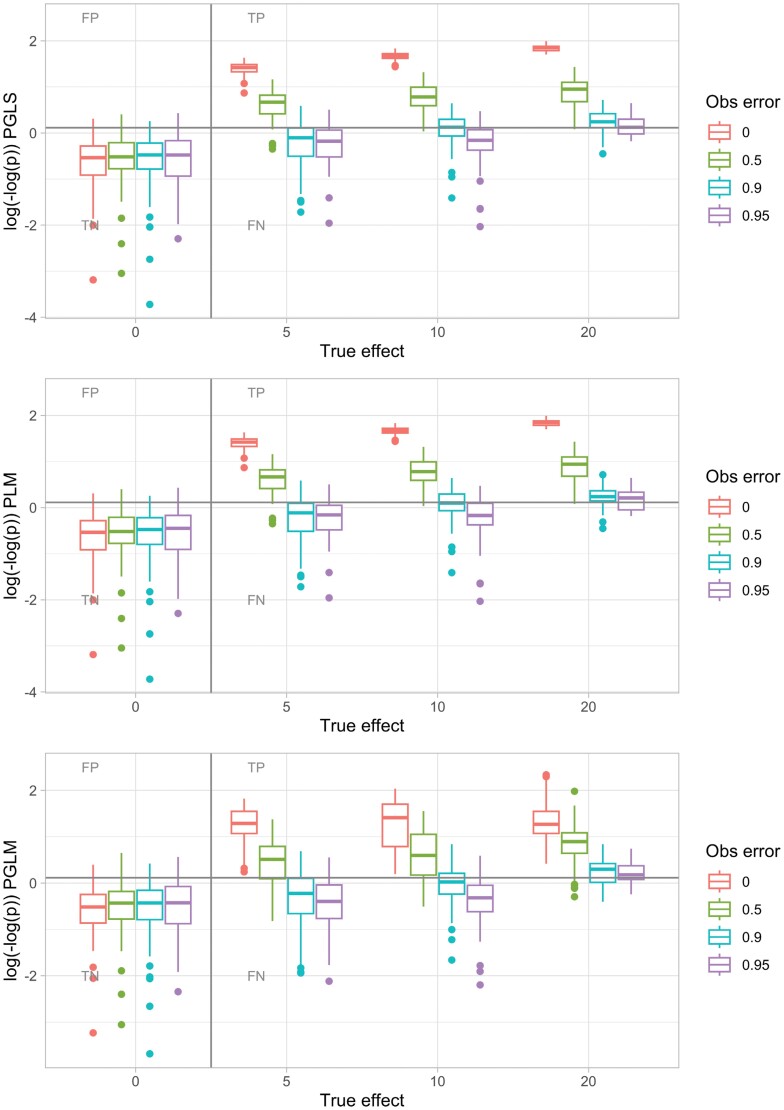
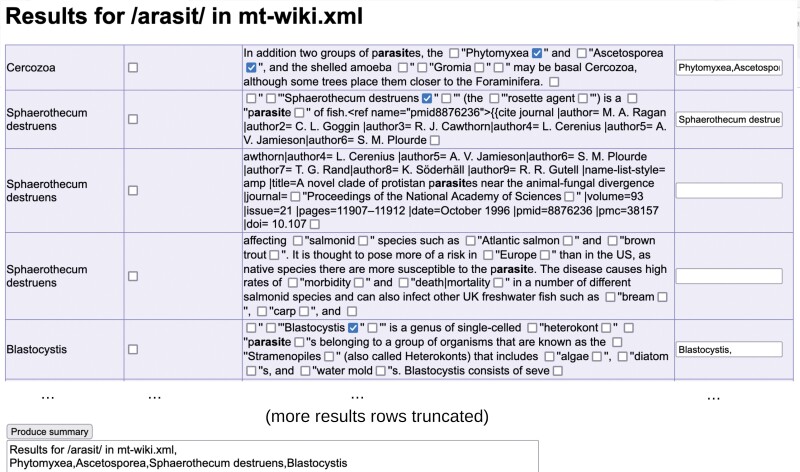
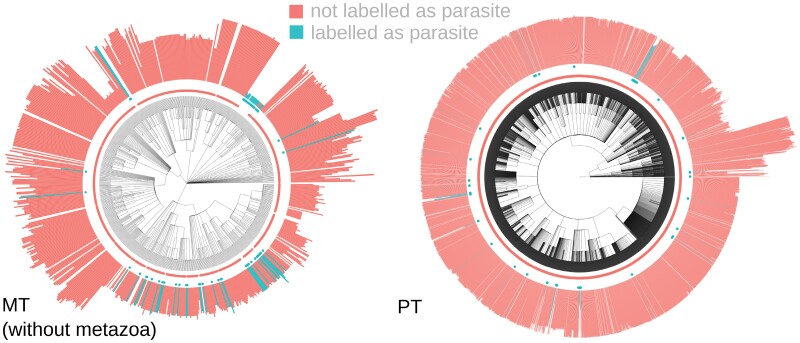
Comparative analysis of variables across phylogenetically linked observations can reveal mechanisms and insights in evolutionary biology. As the taxonomic breadth of the sample of interest increases, challenges of data sparsity, poor phylogenetic resolution, and complicated evolutionary dynamics emerge. Here, we investigate a cross-eukaryotic question where all these problems exist: which organismal ecology features are correlated with gene retention in mitochondrial and chloroplast DNA (organelle DNA or oDNA). Through a wide palette of synthetic control studies, we first characterize the specificity and sensitivity of a collection of parametric and non-parametric phylogenetic comparative approaches to identify relationships in the face of such sparse and awkward datasets. This analysis is not directly focused on oDNA, and so provides generalizable insights into comparative approaches with challenging data. We then combine and curate ecological data coupled to oDNA genome information across eukaryotes, including a new semi-automated approach for gathering data on organismal traits from less systematized open-access resources including encyclopedia articles on species and taxa. The curation process also involved resolving several issues with existing datasets, including enforcing the clade-specificity of several ecological features and fixing incorrect annotations. Combining this unique dataset with our benchmarked comparative approaches, we confirm support for several known links between organismal ecology and organelle gene retention, identify several previously unidentified relationships constituting possible ecological contributors to oDNA genome evolution, and provide support for a recently hypothesized link between environmental demand and oDNA retention. We, with caution, discuss the implications of these findings for organelle evolution and of this pipeline for broad comparative analyses in other fields.

Keywords: Comparative methods; ecology; mtDNA; organelle evolution; phylogenetic generalized linear model; phylogenetic linear model; ptDNA.


Figures

Figure 1.
Figure 1.
Example simulated phylogenies in the control studies. In each case, the tip labels give the true states (left) and observed states after false negative observations of the predictor (right). In this example, predictor evolution is irreversible, so that once the positive value is acquired it is never lost. Color gives predictor value (circles negative, triangles positive); the size of each symbol gives the response value. (A) A symmetric, balanced tree with no influence of predictor on response. (B and C) Birth–death trees with different death parameters, with a strong influence of predictor on response.
Figure 2.
Figure 2.
Example of PGLS, PLM, and PGLM sensitivity–specificity investigation. Evolutionary dynamics were simulated on a tree with 256 leaves, with differing true effect c linking predictor value and response evolution. Predictor value was allowed to change reversibly through evolution; the equivalent plot for irreversible dynamics is shown in Supplementary Fig. 4. Observations of the predictor value were occluded with an observation error parameter giving the probability that a positive value is observed as a negative. The gray line corresponds to P = 0.05; points above would be interpreted as the presence of a signal (without multiple hypothesis correction), and points below as the absence of a signal. PGLS with covariance structure derived from a Brownian model rarely gives FP correlations and has substantial power to detect TP correlations even for high observation error probabilities; PLM is almost identical in performance. PGLM likewise limits FP and retains power to detect TP, although the spread of P values reported by PGLM for positive cases is rather broader. nlme (Pinheiro et al. 2020) was used for PGLS; phylolm (Tung Ho and Ané 2014) for PLM and PGLM with generalized estimating equations. Here, an average of 8 evolutionary events innovated a positive predictor value; the effects of other simulation parameters and methods are shown in Supplementary Figs. 2–6.
Figure 3.
Figure 3.
Screenshot of user interface for semi-automated extraction of organismal traits from online encyclopedia content. A custom script seeks a regular expression associated with a trait (here/arasit/, designed to match [Pp]arasit[ic/ism/etc]) in the corpus of Wikipedia articles describing species and taxa within our phylogeny of interest. The text surrounding each instance of the expression is reported, with check boxes allowing the selection of hyperlinked terms that are manually deemed to match the trait (some examples demonstrated)—which are then stored in boxes on the right, where terms can also be manually entered. An example set of entries is shown in the figure; this query returned several hundred more. After parsing entries (many truncated here), a summary button creates a comma-separated list of all positively identified or entered terms.
Figure 4.
Figure 4.
Example oDNA data. (left) mtDNA, without metazoa for clarity; (right) ptDNA. Colour (and central point markers) give the predictor value (parasitism positive or negative). The length of bars gives oDNA gene count.
Figure 5.
Figure 5.
Features correlated with oDNA gene counts. PLM coefficients (x-axis) and P values (y-axis, double-logged and inverted) for relationships between different organismal traits and organelle DNA gene counts (mtDNA and ptDNA), counted as confirmed protein-coding genes or CDS regions. This analysis is applied to the cross-eukaryote dataset as described in the text. The figure shows statistics from the PLM approach (the corresponding PGLM statistics are shown in Supplementary Fig. 9), but colors correspond to profiles of statistical significance using both PLM and PGLM approaches. ** denotes P < 0.05 after Bonferroni; * P < 0.05 without correction; –P > 0.05 (e.g., **/* means one approach gave a Bonferroni-robust P < 0.05 and the other gave 0.05 not robust to Bonferroni). The PLM coefficient gives the average inferred change in gene count if an organism has a given property. The majority of traits give substantially higher P values and lower-magnitude coefficients; plots are vertically truncated to focus on the more robust results. Example of the full distributions of oDNA gene counts with different features can be seen in (Supplementary Figs. 13–14).

Similar articles

Cited by

References

    1. Allen J.F. 2015. Why chloroplasts and mitochondria retain their own genomes and genetic systems: colocation for redox regulation of gene expression. Proc. Natl. Acad. Sci. U.S.A. 112(33):10231–10238. doi:10.1073/pnas.1500012112 - DOI - PMC - PubMed
    1. Allen J.F., Martin W.F. 2016. Why have organelles retained genomes?. Cell Syst. 2(2):70–72. doi:10.1016/j.cels.2016.02.007 - DOI - PubMed
    1. Auguie B., Antonov A. 2017. gridExtra: miscellaneous functions for “Grid” graphics. R Package Version 2.3. Computer Software. Available from: https://cran.r-project.org/web/packages/gridExtra/.
    1. Barbrook A.C., Howe C.J., Purton S. 2006. Why are plastid genomes retained in non-photosynthetic organisms?. Trends Plant Sci. 11(2):101–108. doi:10.1016/j.tplants.2005.12.004 - DOI - PubMed
    1. Bates D., Mächler M., Bolker B., Walker S. 2015. Fitting linear mixed-effects models using lme4. J. Stat. Softw. 67(October):1–48. doi:10.18637/jss.v067.i01 - DOI