Transcriptome and single-cell transcriptomics reveal prognostic value and potential mechanism of anoikis in skin cutaneous melanoma
- PMID: 38460046
- PMCID: PMC10924820
- DOI: 10.1007/s12672-024-00926-0
Transcriptome and single-cell transcriptomics reveal prognostic value and potential mechanism of anoikis in skin cutaneous melanoma
Abstract
Background: Skin cutaneous melanoma (SKCM) is a highly lethal cancer, ranking among the top four deadliest cancers. This underscores the urgent need for novel biomarkers for SKCM diagnosis and prognosis. Anoikis plays a vital role in cancer growth and metastasis, and this study aims to investigate its prognostic value and mechanism of action in SKCM.
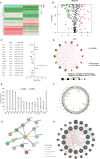
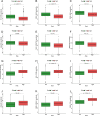
Methods: Utilizing consensus clustering, the SKCM samples were categorized into two distinct clusters A and B based on anoikis-related genes (ANRGs), with the B group exhibiting lower disease-specific survival (DSS). Gene set enrichment between distinct clusters was examined using Gene Set Variation Analysis (GSVA) and the Kyoto Encyclopedia of Genes and Genomes (KEGG) analysis.
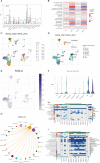
Results: We created a predictive model based on three anoikis-related differently expressed genes (DEGs), specifically, FASLG, IGF1, and PIK3R2. Moreover, the mechanism of these prognostic genes within the model was investigated at the cellular level using the single-cell sequencing dataset GSE115978. This analysis revealed that the FASLG gene was highly expressed on cluster 1 of Exhausted CD8( +) T (Tex) cells.
Conclusions: In conclusion, we have established a novel classification system for SKCM based on anoikis, which carries substantial clinical implications for SKCM patients. Notably, the elevated expression of the FASLG gene on cluster 1 of Tex cells could significantly impact SKCM prognosis through anoikis, thus offering a promising target for the development of immunotherapy for SKCM.
Keywords: Anoikis; Single-cell data analysis; Skin cutaneous melanoma; TCGA.
© 2024. The Author(s).
Conflict of interest statement
The writers indicated that their work was not influenced by competing financial interests or personal connection.
Figures


Similar articles
-
Identification of anoikis-related subtypes and development of risk stratification system in skin cutaneous melanoma.Heliyon. 2023 May 9;9(5):e16153. doi: 10.1016/j.heliyon.2023.e16153. eCollection 2023 May. Heliyon. 2023. PMID: 37215879 Free PMC article.
-
Development of a biomarker signature associated with anoikis to predict prognosis and immunotherapy response in melanoma.Arch Dermatol Res. 2024 May 24;316(6):219. doi: 10.1007/s00403-024-03085-y. Arch Dermatol Res. 2024. PMID: 38787413
-
HOPX is a tumor-suppressive biomarker that corresponds to T cell infiltration in skin cutaneous melanoma.Cancer Cell Int. 2023 Jun 21;23(1):122. doi: 10.1186/s12935-023-02962-2. Cancer Cell Int. 2023. PMID: 37344870 Free PMC article.
-
The Landscape of the Tumor Microenvironment in Skin Cutaneous Melanoma Reveals a Prognostic and Immunotherapeutically Relevant Gene Signature.Front Cell Dev Biol. 2021 Oct 1;9:739594. doi: 10.3389/fcell.2021.739594. eCollection 2021. Front Cell Dev Biol. 2021. PMID: 34660598 Free PMC article.
-
Development and validation of an immune gene set-based prognostic signature in cutaneous melanoma.Future Oncol. 2021 Nov;17(31):4115-4129. doi: 10.2217/fon-2021-0104. Epub 2021 Jul 22. Future Oncol. 2021. PMID: 34291650
Cited by
-
Identification of Anoikis-Related Genes in Gastric Cancer: Bioinformatics and Experimental Validation.Cancer Med. 2025 Apr;14(8):e70907. doi: 10.1002/cam4.70907. Cancer Med. 2025. PMID: 40263929 Free PMC article.
References
-
- Ferlay J, Ervik M, Lam F, Colombet M, Mery L, Piñeros M, et al. Global cancer observatory: cancer today. Lyon: International Agency for Research on Cancer; 2020.
LinkOut - more resources
Full Text Sources
Research Materials
Miscellaneous
