. 2024 Apr;20(4):2922-2942.
doi: 10.1002/alz.13767. Epub 2024 Mar 9.

BIN1K358R suppresses glial response to plaques in mouse model of Alzheimer's disease

Affiliations

BIN1K358R suppresses glial response to plaques in mouse model of Alzheimer's disease

Laura Fernandez Garcia-Agudo et al. Alzheimers Dement. 2024 Apr.

Abstract

Introduction: The BIN1 coding variant rs138047593 (K358R) is linked to Late-Onset Alzheimer's Disease (LOAD) via targeted exome sequencing.

Methods: To elucidate the functional consequences of this rare coding variant on brain amyloidosis and neuroinflammation, we generated BIN1K358R knock-in mice using CRISPR/Cas9 technology. These mice were subsequently bred with 5xFAD transgenic mice, which serve as a model for Alzheimer's pathology.

Results: The presence of the BIN1K358R variant leads to increased cerebral amyloid deposition, with a dampened response of astrocytes and oligodendrocytes, but not microglia, at both the cellular and transcriptional levels. This correlates with decreased neurofilament light chain in both plasma and brain tissue. Synaptic densities are significantly increased in both wild-type and 5xFAD backgrounds homozygous for the BIN1K358R variant.

Discussion: The BIN1 K358R variant modulates amyloid pathology in 5xFAD mice, attenuates the astrocytic and oligodendrocytic responses to amyloid plaques, decreases damage markers, and elevates synaptic densities.

Highlights: BIN1 rs138047593 (K358R) coding variant is associated with increased risk of LOAD. BIN1 K358R variant increases amyloid plaque load in 12-month-old 5xFAD mice. BIN1 K358R variant dampens astrocytic and oligodendrocytic response to plaques. BIN1 K358R variant decreases neuronal damage in 5xFAD mice. BIN1 K358R upregulates synaptic densities and modulates synaptic transmission.

Keywords: Alzheimer's disease; BIN1 K358R; MODEL‐AD; astrocytes; inflammation; oligodendrocytes.


Conflict of interest statement

The authors declare that the research was conducted in the absence of any commercial or financial relationships that could be construed as a potential conflict of interest. Author disclosures are available in the supporting information.

Figures
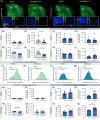
FIGURE 1
FIGURE 1
Increased amyloid beta plaque burden in 12‐month‐old (12 months) 5xFAD/BIN1 K358R mice. (A) Representative brain sections showing whole‐brain ThioS+ staining in 4‐month‐old (4 months) and 12 months 5xFAD and 5xFAD/BIN1 K358R mice. White boxes denote hippocampal subiculum and visual cortex where 20× confocal images were acquired for subsequent analysis. (B,C) ThioS+ plaque density and total plaque volume in the visual cortex of 4 months mice. (D,E) ThioS+ plaque density and total plaque volume in the subiculum of 4 months mice. (F,G) ThioS+ plaque density and total plaque volume in the visual cortex of 12 months mice. (H,I) ThioS+ plaque density and total plaque volume in the subiculum of 12 months mice. (J,K) Individual ThioS+ plaque size frequency distribution in the visual cortex and subiculum of 4 months mice. (L,M) Individual ThioS+ plaque size frequency distribution in the visual cortex and subiculum of 12 months mice. (N,O) OC+ plaque density and total plaque volume in the visual cortex of 4 months mice. (P,Q) OC+ plaque density and plaque total volume in the subiculum of 4 months mice. (R,S) OC+ plaque density and plaque total volume in the visual cortex of 12 months mice. (T,U) OC+ plaque density and plaque total volume in the subiculum of 12 months mice. Data are represented as mean ± SEM. Statistical significance is evaluated by unpaired two‐tailed t‐test; statistical trends are provided as p‐values on the graphs. n = 11 to 13. Pink data points in scatter plots on bar graphs represent female mice, while blue data points represent male mice. CTX, visual cortex; SEM, standard error of the mean; SUB, subiculum. *< 0.05, **< 0.01, ***< 0.001, ****< 0.0001.
FIGURE 2
FIGURE 2
Quantification of amyloid beta (Aβ)40‐42 in soluble and insoluble fractions from cortex and hippocampus of 5xFAD and 5xFAD/BIN1K358R mice. (A–D) Quantification of Aβ40 and Aβ42 in the soluble fraction of the visual cortex and the hippocampus of 4‐month‐old (4 months) mice. (E–H) Quantification of the soluble fractions of Aβ40 and Aβ42 in the visual cortex and hippocampus of 12 months mice. (I–L) Quantification of the insoluble fractions of Aβ40 and Aβ42 in the visual cortex and hippocampus of 4 months mice. (M–P) Quantification of the insoluble fractions of Aβ40 and Aβ42 in the visual cortex and hippocampus of 12 months mice. Data are represented as mean ± SEM. Statistical trends are given by p‐values on the graphs. n = 8 to 11. All graphs show an unpaired two‐tailed t‐test. Pink data points in scatter plots with bar graphs represent female mice, and blue data points represent male mice. CTX, visual cortex; IF, insoluble fraction; SF, soluble fraction; SUB, subiculum. *< 0.05, **< 0.01.
FIGURE 3
FIGURE 3
Reduced astroglial response in 5xFAD/BIN1K358R mice. (A) Representative images of IBA1 and ThioS stain in the subiculum of 12‐month‐old (12 months) 5xFAD and 5xFAD/BIN1K358R mice. (B) Quantification of IBA1+ microglia in contact with ThioS+ plaques (normalized to ThioS+ total volume) in the subiculum of 12 months mice. (C,D) IBA1+ microglia number and volume in the visual cortex of 12 months mice. (E,F) IBA1+ microglia number and volume in the subiculum of 12 months mice. (G) Representative images of GFAP, S100β and ThioS staining in the visual cortex and subiculum of 12 months 5xFAD and 5xFAD/BIN1K358R mice. (H–O) Number and volume of GFAP+ and S100β+ astrocytes in (H–K) the visual cortex and (L–O) subiculum of 12 months mice. Data are represented as mean ± SEM. n = 10 to 13. Statistical trends are given by p‐values on the graphs or by # when 0.05 < < 0.1 All graphs show a two‐way ANOVA with Tukey's multiple comparisons test. Pink data points in scatter plots with bar graphs represent female mice while blue data points represent male mice. CTX, visual cortex; SUB, subiculum. *< 0.05, **< 0.01, ***< 0.001, ****< 0.0001.
FIGURE 4
FIGURE 4
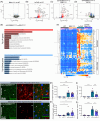
Transcriptomic analyses reveal attenuated glial responses upon BIN1K358R in 5xFAD mice. (A–D) Volcano plots showing DEG between 12‐month‐old (12 months) BIN1 K358R versus WT mice, 5xFAD versus WT mice, 5xFAD/BIN1 K358R versus BIN1 K358R mice, and 5xFAD/BIN1 K358R versus 5xFAD mice. Blue dots represent significant DEG (FDR < 0.05); red dots represent significant DEG with significant logFC (>1 or <−1); grey and green dots represent non‐significant DEG (FDR > 0.05). (E) Top Gene Ontology Biological Process terms obtained in Enrichr for upregulated and downregulated DEG in 5xFAD/BIN1 K358R versus 5xFAD mice, ranked by combined score. (F) Heatmap of DAA/DAO and inflammation related genes from 5xFAD/BIN1 K358R versus 5xFAD mice compared across all genotypes. (G) Representative 63× images of SerpinA3N stain in GFAP+ astrocytes in the subiculum of 12 months 5xFAD/BIN1 K358R mice. (H,I) Quantification of double labeled GFAP+SerpinA3N+ astrocytes in the visual cortex and subiculum of 12 months mice. (J) Representative 63× images of SerpinA3n stain in OLIG2+ oligodendrocytes in the subiculum of 12 months 5xFAD and 5xFAD/BIN1 K358R mice. (K,L) Quantification of OLIG2+ and SerpinA3N+ oligodendrocytes in the visual cortex and subiculum of 12 months mice. For transcriptomic data statistical significance is delimited by FDR < 0.05; n = 9 to 10. Histological data are represented as mean ± SEM; n = 8 to 12. Statistical trends are given by p‐values on the graphs or by # when 0.05 < < 0.1. Graphs in panels H–L show a two‐way ANOVA with Tukey's multiple comparisons test. Pink data points in scatter plots with bar graphs represent female mice while blue data points represent male mice. CTX, visual cortex; DAA, disease‐associated astrocytes; DAO, disease‐associated oligodendrocytes; DEG, differentially expressed genes; FDR, false discovery rate; SUB, subiculum; WT, wild‐type. *< 0.05, **< 0.01, ***< 0.001, ****< 0.0001.
FIGURE 5
FIGURE 5
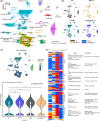
snRNA‐seq analysis shows BIN1 expression in oligodendrocytes in cortical brain region from mice. (A) Uniform manifold approximation and projection (UMAP) of snRNA‐seq analysis of 12‐month‐old mice provides transcriptomic evidence of 39 distinct clusters, including multiple neuronal subtypes, astrocytes, several oligodendrocyte subtypes, endothelial and other cell clusters. (B) UMAP of snRNA‐seq analysis of 12‐month‐old mice from genotype WT, BIN1K358R, 5xFAD, and 5xFAD/BIN1K358R (n = 2). (C) UMAP shows the normalized Bin1 expression levels. The violin plot presents the normalized Bin1 expression levels comparison using the Wilcoxon test. (D) Heatmap with gene ontology (GO) term enrichment analysis of differentially expressed gene from 5xFAD/BIN1K358R versus 5xFAD compared across all genotypes. WT, wild‐type. ns (> 0.05), *< 0.05.
FIGURE 6
FIGURE 6
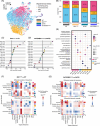
snRNA‐seq sub‐clustering of oligodendrocytes reveals cellular heterogeneity and enriched cell‐cell interaction with neurons in 5xFAD/BIN1K358R mice. (A) Uniform manifold approximation and projection (UMAP) of oligodendrocyte subclusters. (B) The proportion of oligodendrocyte subclusters by different genotypes. (C) Differential module eigengene (DME) analysis between BIN1K358R and wild‐type (WT), where in the lollipop plot, the size of each dot corresponds to the number of genes in that module, and “X” is placed over each point that does not reach statistical significance. (D) DME analysis between 5xFAD/BIN1K358R and 5xFAD. (E) Gene ontology (GO) term enrichment analysis of selected differential module eigengene enriched in disease‐associated oligodendrocytes (DAO), mature oligodendrocytes (MOL), and homeostatic MOL. (F) Differential number of interactions and interaction strength between BIN1K358R and WT with signal sender from Astrocyte, Excitatory Neuron, Inhibitory Neuron, Microglia, DAO, Homeostatic MOL, and MOL, where red (or blue) color represents increased (or decreased) signaling. (G) Differential number of interactions and interaction strength between 5xFAD/BIN1K358R and 5xFAD with signal sender from Astrocyte, Excitatory Neuron, Inhibitory Neuron, Microglia, DAO, Homeostatic MOL and MOL.
FIGURE 7
FIGURE 7
Neuronal damage markers are decreased in 5xFAD/BIN1K358R mice. (A) Representative images of LAMP1 and amyloid plaques by Amylo‐Glo in the subiculum of 12‐month‐old (12 months) 5xFAD and 5xFAD/BIN1 K358R mice. (B–C) Quantification of LAMP1+ deposit density and volume ratio to Amylo‐Glo+ plaques in the visual cortex (B) and subiculum (C) of 12 months mice. (D,E) Plasma neurofilament light chain (NfL) quantification of 4 months (D) and 12 months (E) mice. (F,G) Quantification of soluble (F) and insoluble (G) NfL fractions in the cortex of 12 months mice. (H) Representative images of NfL stain in the subiculum of 12 months 5xFAD and 5xFAD/BIN1 K358R mice. NfL blebs usually occur in the LAMP1 halo. (I,J) Quantification of brain NfL in the visual cortex (I) and subiculum (J) of 12 months mice. (K) Representative super‐resolution image of CA1 immunolabeled with Bassoon for presynaptic elements (red) and Homer1 for postsynaptic elements (green) showing the full captured field of view and a zoomed in box detailing the individual synapses. (L) Representative zoomed in super‐resolution images of CA1 from 12‐month‐old WT, BIN1 K358R, 5xFAD, and 5xFAD/ BIN1 K358R mice. (M,N) Quantification of synaptic densities in the cortex (M) and CA1 (N) showing increased synapses with BIN1 K358R genotype. (O) Time course of field excitatory postsynaptic potential (fEPSP) slope (as percentage of baseline) following theta burst stimulation (TBS, at t = 20 min) of slices from 12 months wild‐type (WT) and BIN1 K358R mice showing increased long‐term potentiation (LTP) in BIN1 K358R animals. (P) Mean potentiation (± SEM) during the last 10 minutes of recording in slices from 12 months mice shows increased potentiation in BIN1 K358R mice (p = 0.0024). (Q) Input–output curve over a range of stimulation currents did not reveal any differences between groups (slope of the curves; p = 0.40). (R) 12 months BIN1 K358R mice show increased paired‐pulse facilitation (PPF) at all three intervals tested (F[2,36] = 3.617, p = 0.037). Data are represented as mean ± SEM. n = 5 to 6 mice/sex/genotype. LTP: n = 10 slices/genotype. Statistical trends are given by p‐values on graph. n = 9‐13. Graphs in panels B and C show an unpaired two‐tailed t‐test. Graphs in panels D–J, M and N show a two‐way ANOVA with Tukey's multiple comparisons test. Pink data points in scatter plots with bar graphs represent female mice, and blue data points represent male mice. CTX, visual cortex; IF, insoluble fraction; SF, soluble fraction; SUB, subiculum. *< 0.05, **< 0.01, ***< 0.001, ****< 0.0001.

References

    1. Harold D, Abraham R, Hollingworth P, et al. Genome‐wide association study identifies variants at CLU and PICALM associated with Alzheimer's disease. Nat Genet. 2009;41:1088‐1093. - PMC - PubMed
    1. Lambert JC, Ibrahim‐Verbaas CA, Harold D, et al. Meta‐analysis of 74,046 individuals identifies 11 new susceptibility loci for Alzheimer's disease. Nat Genet. 2013;45:1452‐1458. - PMC - PubMed
    1. Seshadri S, Fitzpatrick AL, Ikram MA, DeStefano AL, Gudnason V, Boada M, et al. Genome‐wide analysis of genetic loci associated with Alzheimer disease. JAMA. 2010;303:1832‐1840. - PMC - PubMed
    1. Vardarajan BN, Ghani M, Kahn A, et al. Rare coding mutations identified by sequencing of Alzheimer disease genome‐wide association studies loci. Ann Neurol. 2015;78:487‐498. - PMC - PubMed
    1. Luukkainen L, Helisalmi S, Kytovuori L, et al. Mutation analysis of the genes linked to early onset Alzheimer's disease and frontotemporal lobar degeneration. J Alzheimers Dis. 2019;69:775‐782. - PubMed

Publication types