

Sphingolipid biosynthetic inhibitor L-Cycloserine prevents oxidative-stress-mediated death in an in vitro model of photoreceptor-derived 661W cells
- PMID: 38460719
- PMCID: PMC11089890
- DOI: 10.1016/j.exer.2024.109852
Sphingolipid biosynthetic inhibitor L-Cycloserine prevents oxidative-stress-mediated death in an in vitro model of photoreceptor-derived 661W cells
Abstract
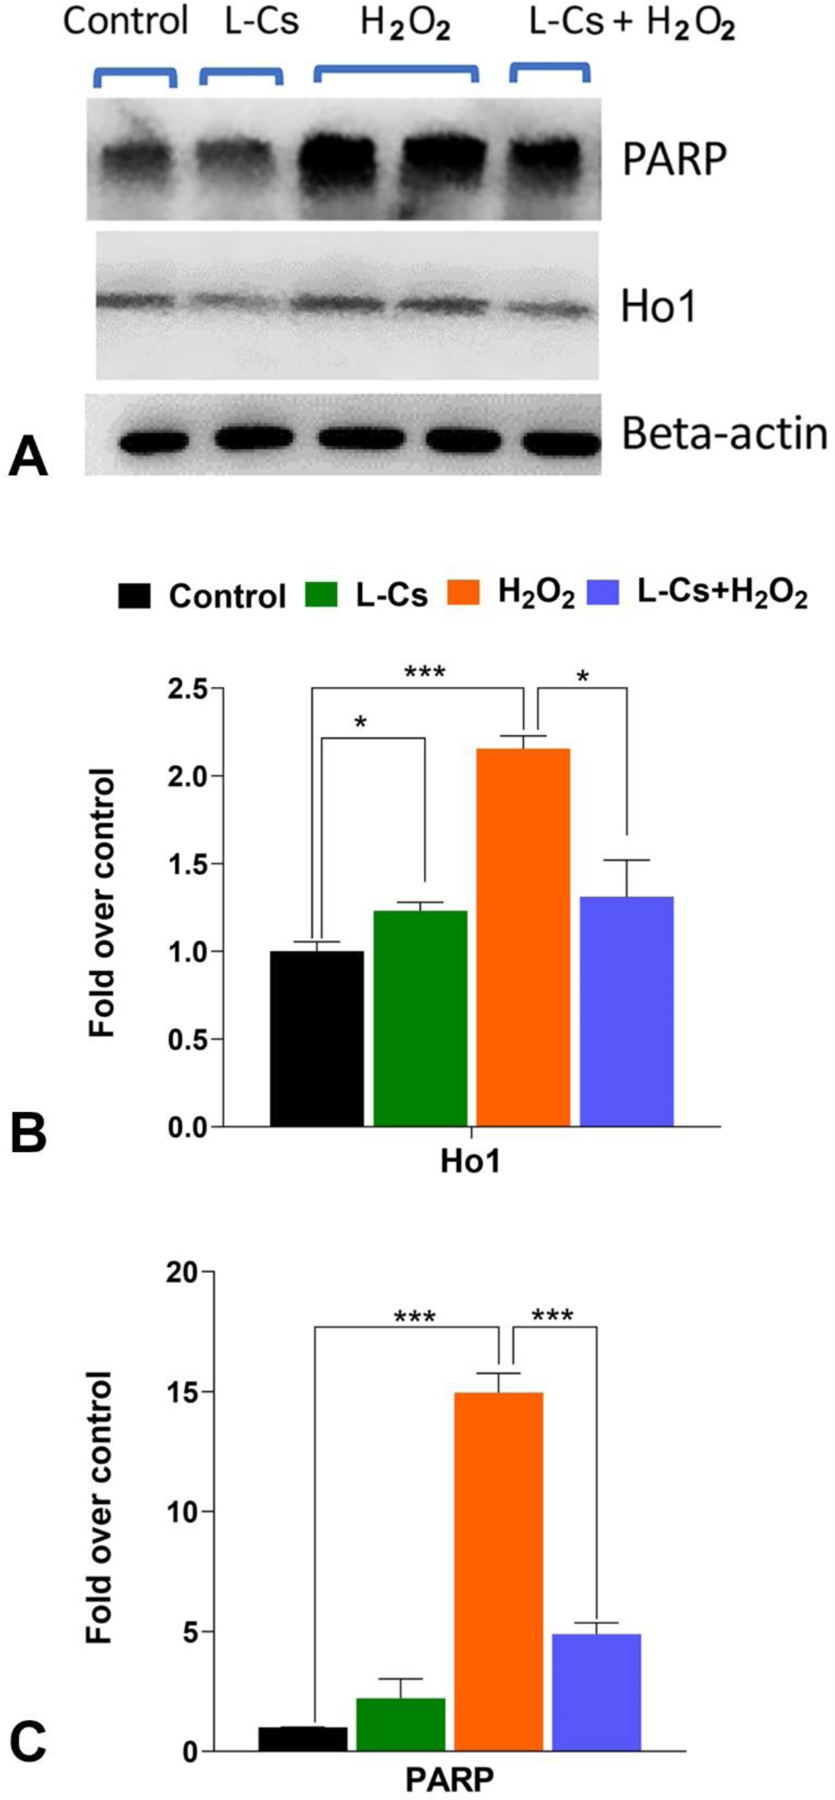
Oxidative stress plays a pivotal role in the pathogenesis of several neurodegenerative diseases. Retinal degeneration causes irreversible death of photoreceptor cells, ultimately leading to vision loss. Under oxidative stress, the synthesis of bioactive sphingolipid ceramide increases, triggering apoptosis in photoreceptor cells and leading to their death. This study investigates the effect of L-Cycloserine, a small molecule inhibitor of ceramide biosynthesis, on sphingolipid metabolism and the protection of photoreceptor-derived 661W cells from oxidative stress. The results demonstrate that treatment with L-Cycloserine, an inhibitor of Serine palmitoyl transferase (SPT), markedly decreases bioactive ceramide and associated sphingolipids in 661W cells. A nontoxic dose of L-Cycloserine can provide substantial protection of 661W cells against H2O2-induced oxidative stress by reversing the increase in ceramide level observed under oxidative stress conditions. Analysis of various antioxidant, apoptotic and sphingolipid pathway genes and proteins also confirms the ability of L-Cycloserine to modulate these pathways. Our findings elucidate the generation of sphingolipid mediators of cell death in retinal cells under oxidative stress and the potential of L-Cycloserine as a therapeutic candidate for targeting ceramide-induced degenerative diseases by inhibiting SPT. The promising therapeutic prospect identified in our findings lays the groundwork for further validation in in-vivo and preclinical models of retinal degeneration.
Keywords: Ceramide biosynthesis; L-Cycloserine; Oxidative stress; Photoreceptors; Retina; Retinal cell death; Serine palmitoyl transferase (SPT); Sphingolipids; Therapeutic intervention.
Published by Elsevier Ltd.
Conflict of interest statement
Declaration of competing interest The authors declare that they have no conflicts of interest with the contents of this article.
Figures


Similar articles
-
Inhibiting De Novo Biosynthesis of Ceramide by L-Cycloserine Can Prevent Light-Induced Retinal Degeneration in Albino BALB/c Mice.Int J Mol Sci. 2024 Dec 13;25(24):13389. doi: 10.3390/ijms252413389. Int J Mol Sci. 2024. PMID: 39769156 Free PMC article.
-
Ceramide is a mediator of apoptosis in retina photoreceptors.Invest Ophthalmol Vis Sci. 2006 Apr;47(4):1658-68. doi: 10.1167/iovs.05-1310. Invest Ophthalmol Vis Sci. 2006. PMID: 16565407
-
2-Acetyl-5-tetrahydroxybutyl imidazole (THI) protects 661W cells against oxidative stress.Naunyn Schmiedebergs Arch Pharmacol. 2017 Jul;390(7):741-751. doi: 10.1007/s00210-017-1374-3. Epub 2017 Apr 13. Naunyn Schmiedebergs Arch Pharmacol. 2017. PMID: 28409209
-
Sphingolipid homeostasis: How do cells know when enough is enough? Implications for plant pathogen responses.Plant Physiol. 2024 Dec 23;197(1):kiae460. doi: 10.1093/plphys/kiae460. Plant Physiol. 2024. PMID: 39222369 Review.
-
Ceramide and apoptosis: exploring the enigmatic connections between sphingolipid metabolism and programmed cell death.Anticancer Agents Med Chem. 2012 May;12(4):340-63. doi: 10.2174/187152012800228661. Anticancer Agents Med Chem. 2012. PMID: 21707511 Review.
Cited by
-
A review of the 661W cell line as a tool to facilitate treatment development for retinal diseases.Cell Biosci. 2025 Apr 1;15(1):41. doi: 10.1186/s13578-025-01381-2. Cell Biosci. 2025. PMID: 40170180 Free PMC article. Review.
-
Inhibiting De Novo Biosynthesis of Ceramide by L-Cycloserine Can Prevent Light-Induced Retinal Degeneration in Albino BALB/c Mice.Int J Mol Sci. 2024 Dec 13;25(24):13389. doi: 10.3390/ijms252413389. Int J Mol Sci. 2024. PMID: 39769156 Free PMC article.
-
Plasma lipidomic fingerprinting enables high-accuracy biomarker discovery for Alzheimer's disease: a targeted LC-MRM/MS approach.Geroscience. 2025 Jun 27. doi: 10.1007/s11357-025-01777-5. Online ahead of print. Geroscience. 2025. PMID: 40579668
-
A Review Discussing Synthesis and Translational Studies of Medicinal Agents Targeting Sphingolipid Pathways.Biomolecules. 2025 Jul 16;15(7):1022. doi: 10.3390/biom15071022. Biomolecules. 2025. PMID: 40723894 Free PMC article. Review.
-
Elevated Very-Long-Chain Ceramides in the Vitreous Humor of Patients With Proliferative Diabetic Retinopathy.Invest Ophthalmol Vis Sci. 2025 Feb 3;66(2):28. doi: 10.1167/iovs.66.2.28. Invest Ophthalmol Vis Sci. 2025. PMID: 39932474 Free PMC article.
References
-
- 2008. Cycloserine. Tuberculosis 88, 100–101. - PubMed
-
- Acharya U, Patel S, Koundakjian E, Nagashima K, Han X, Acharya JK, 2003. Modulating sphingolipid biosynthetic pathway rescues photoreceptor degeneration. Science (New York, N.Y.) 299, 1740–1743. - PubMed
-
- Beatty S, Koh H, Phil M, Henson D, Boulton M, 2000. The role of oxidative stress in the pathogenesis of age-related macular degeneration. Survey of ophthalmology 45, 115–134. - PubMed
Publication types
MeSH terms
Substances
Grants and funding
LinkOut - more resources
Full Text Sources
