. 2024 Mar 7;16(6):5249-5263.
doi: 10.18632/aging.205645. Epub 2024 Mar 7.

Molecular characterization of Golgi apparatus-related genes indicates prognosis and immune infiltration in osteosarcoma

Affiliations

Molecular characterization of Golgi apparatus-related genes indicates prognosis and immune infiltration in osteosarcoma

Jian Zhang et al. Aging (Albany NY). .

Abstract

Background: The Golgi apparatus (GA) is crucial for protein synthesis and modification, and regulates various cellular processes. Dysregulation of GA can lead to pathological conditions like neoplastic growth. GA-related genes (GARGs) mutations are commonly found in cancer, contributing to tumor metastasis. However, the expression and prognostic significance of GARGs in osteosarcoma are yet to be understood.

Methods: Gene expression and clinical data of osteosarcoma patients were obtained from the TARGET and GEO databases. A consensus clustering analysis identified distinct molecular subtypes based on GARGs. Discrepancies in biological processes and immunological features among the subtypes were explored using GSVA, ssGSEA, and Metascape analysis. A GARGs signature was constructed using Cox regression. The prognostic value of the GARGs signature in osteosarcoma was evaluated using Kaplan-Meier curves and a nomogram.

Results: Two GARG subtypes were identified, with Cluster A showing better prognosis, immunogenicity, and immune cell infiltration than Cluster B. A novel risk model of 3 GARGs was established using the TARGET dataset and validated with independent datasets. High-risk patients had poorer overall survival, and the GARGs signature independently predicted osteosarcoma prognosis. Combining risk scores and clinical characteristics in a nomogram improved prediction performance. Additionally, we discovered Stanniocalcin-2 (STC2) as a significant prognostic gene highly expressed in osteosarcoma and potential disease biomarker.

Conclusions: Our study revealed that patients with osteosarcoma can be divided into two GARGs subgroups. Furthermore, we have developed a GARGs prognostic signature that can accurately forecast the prognosis of osteosarcoma patients.

Keywords: Golgi apparatus; biomarkers; immune infiltration; osteosarcoma; prognosis.


Conflict of interest statement

CONFLICTS OF INTEREST: The authors declare that the research was conducted in the absence of any commercial or financial relationships that could be construed as a potential conflict of interest.

Figures

Figure 1
Figure 1
Prognostic gene screening and consensus clustering. (A) Volcano plot displaying univariate Cox regression results of GARGs. (B) The consensus matrix of 85 samples when k = 2. (C, D) The CDF curve for k = 2-9. (E) PCA plot of the two subtypes. (F) Kaplan-Meier survival analysis of the two subtypes. (G) Comparison of GARGs expression and clinical characteristics between the two subtypes. (H) The immune cell infiltration between the two subtypes was analyzed by the ssGSEA. *P<0.05, **P<0.01 and ***P<0.001. (I) GSVA was performed to analyze the differences between the two subtypes.
Figure 2
Figure 2
Functional enrichment analysis between the two subtypes. (A) Heatmap of DEGs between the two subtypes. (B) The volcano plot of DEGs. (C) Biological process and pathway enrichments ordered by statistical significance. (D) The network showed the interactions among the enriched terms.
Figure 3
Figure 3
Consensus cluster analysis based on the DEGs. (A) The consensus matrix when k = 3. (B, C) The CDF curve for k = 2-9. (D) PCA plot of the three subtypes. (E) Kaplan-Meier survival analysis of the three subtypes. (F) Comparison of DEGs expression and clinical characteristics between the three subtypes.
Figure 4
Figure 4
Construction and validation of the GARGs risk model. (A, B) LASSO regression analysis of 186 prognostic GARGs. (C) Multivariate Cox regression analysis. (D) Kaplan-Meier curves in the TARGET, GSE21257 and TCGA-SARC cohorts. (E) The AUC for the prediction of 1, 3, 5 years survival rate. (F) Distribution of survival status and risk scores. (G) Heatmap of the three model genes between the high- and low-risk groups.
Figure 5
Figure 5
The relationships between clinical characteristics and the GARGs signature. (A, B) Univariate and multivariate Cox regression analysis for independent prognostic analysis of risk model. (C) Nomogram based on gender, age, metastasis and risk in the TARGET cohort. (D) The nomogram calibration curves for predicting 1-, 3-, and 5-year survival. (E) The relationship between risk score and the two GARGs subtypes. (F) The relationship between the risk score and the three DEGs subtypes. (G) Sankey plot of GARGs subtype distribution in groups with different risk scores and survival status.
Figure 6
Figure 6
The risk score was related to immune infiltration. (A) The association between risk score and immune cell infiltration. (B) Risk score was significantly correlated with stromal scores, immune scores, and ESTIMATE scores. (CF) Relationship between risk score and immune cell infiltration and related functions via ssGSEA analysis. *P<0.05, **P<0.01 and ***P<0.001.
Figure 7
Figure 7
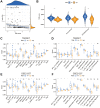
The expression levels of STC2. (A, B) The STC2 expression level in osteosarcoma and non-tumoral paired samples, based on the GSE99671 and GSE225588 cohort. (C) The qRT-PCR result of STC2 in hFOB 1.19, 143B, MG63, HOS cell lines. (D) The expressions of STC2 in tumor and adjacent normal tissues. *P<0.05, **P<0.01 and ***P<0.001.
Figure 8
Figure 8
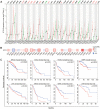
Expression and significance of STC2 in pan-cancer. (A) Pan-cancer analysis of STC2 expression based on the GEPIA2. (B) Survival map of STC2 in pan-cancer. (C) Kaplan-Meier survival curves for overall survival rate over TCGA cancer types.

Similar articles

Cited by

References

    1. Ritter J, Bielack SS. Osteosarcoma. Ann Oncol. 2010; 7:vii320–5. 10.1093/annonc/mdq276 - DOI - PubMed
    1. Meltzer PS, Helman LJ. New Horizons in the Treatment of Osteosarcoma. N Engl J Med. 2021; 385:2066–76. 10.1056/NEJMra2103423 - DOI - PubMed
    1. Kelley LM, Schlegel M, Hecker-Nolting S, Kevric M, Haller B, Rössig C, Reichardt P, Kager L, Kühne T, Gosheger G, Windhager R, Specht K, Rechl H, et al.. Pathological Fracture and Prognosis of High-Grade Osteosarcoma of the Extremities: An Analysis of 2,847 Consecutive Cooperative Osteosarcoma Study Group (COSS) Patients. J Clin Oncol. 2020; 38:823–33. 10.1200/JCO.19.00827 - DOI - PubMed
    1. Smeland S, Bielack SS, Whelan J, Bernstein M, Hogendoorn P, Krailo MD, Gorlick R, Janeway KA, Ingleby FC, Anninga J, Antal I, Arndt C, Brown KLB, et al.. Survival and prognosis with osteosarcoma: outcomes in more than 2000 patients in the EURAMOS-1 (European and American Osteosarcoma Study) cohort. Eur J Cancer. 2019; 109:36–50. 10.1016/j.ejca.2018.11.027 - DOI - PMC - PubMed
    1. Yang C, Tian Y, Zhao F, Chen Z, Su P, Li Y, Qian A. Bone Microenvironment and Osteosarcoma Metastasis. Int J Mol Sci. 2020; 21:6985. 10.3390/ijms21196985 - DOI - PMC - PubMed

Publication types