. 2024 Mar 9;15(1):1877.
doi: 10.1038/s41467-024-45825-8.

Identification of the growth cone as a probe and driver of neuronal migration in the injured brain

Affiliations

Identification of the growth cone as a probe and driver of neuronal migration in the injured brain

Chikako Nakajima et al. Nat Commun. .

Abstract

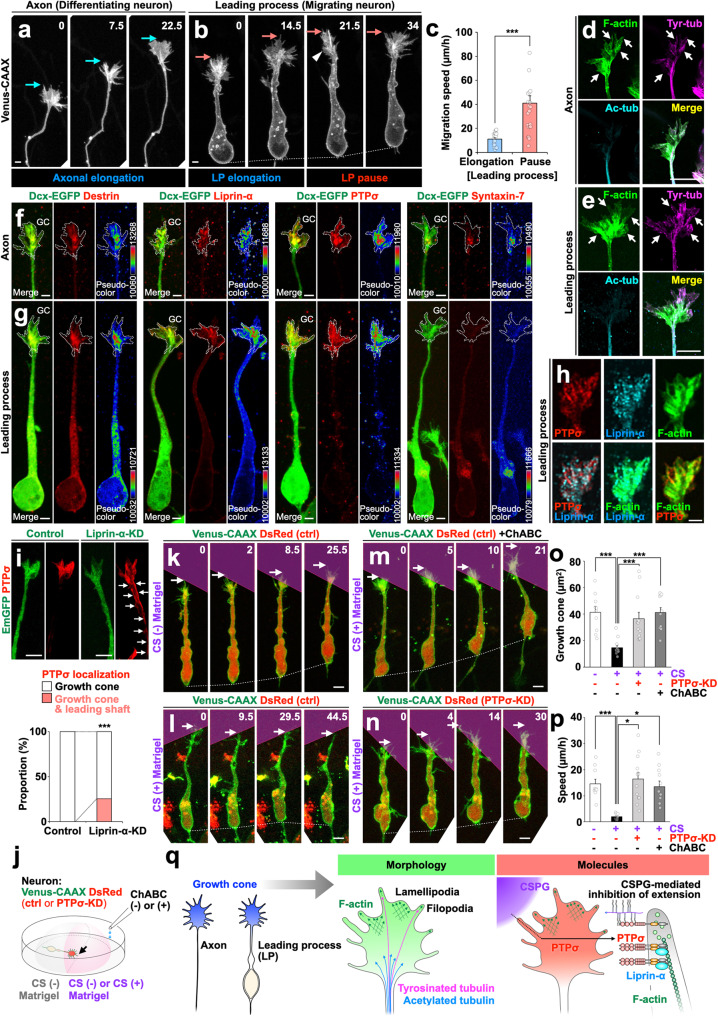
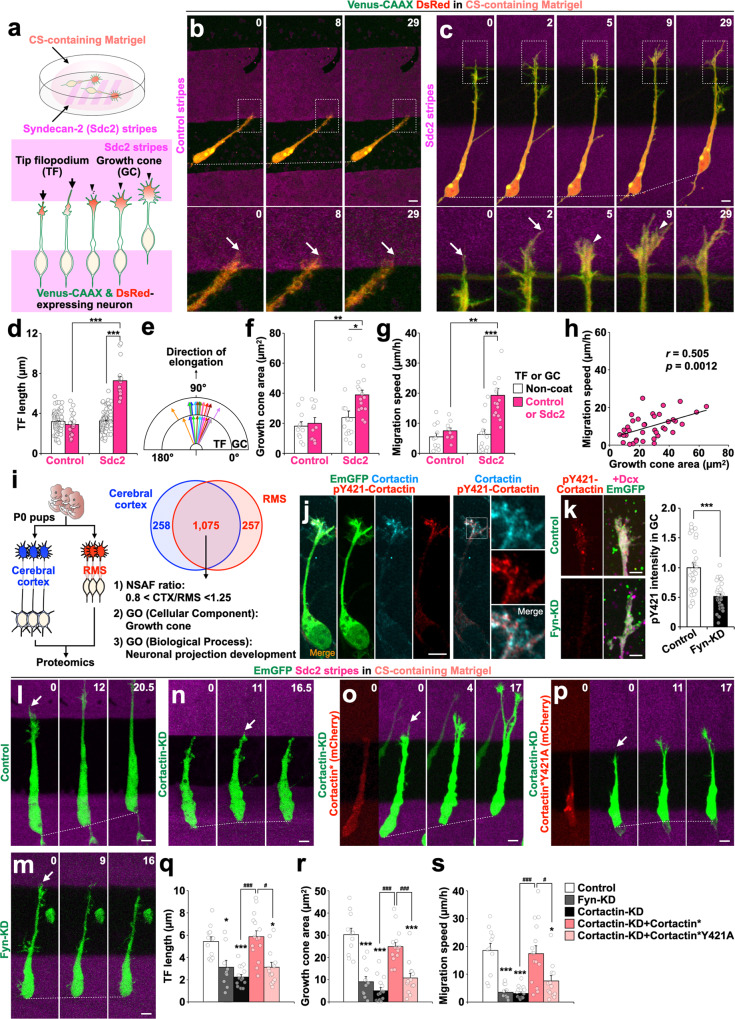
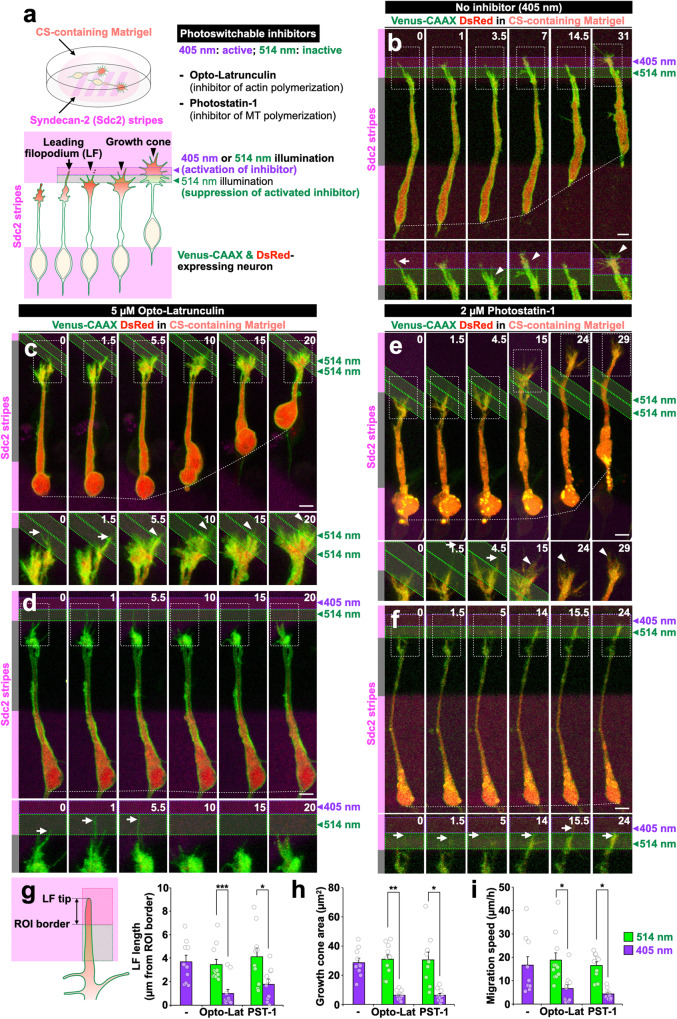
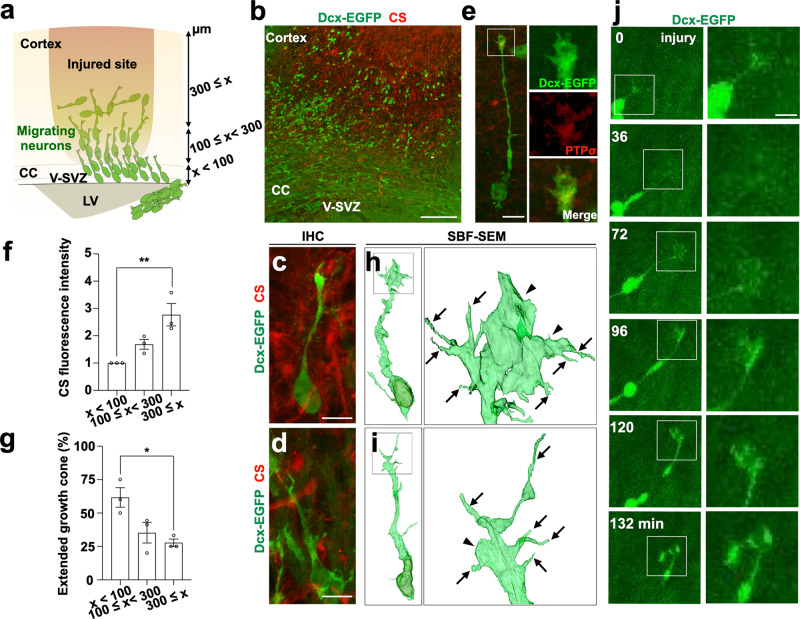
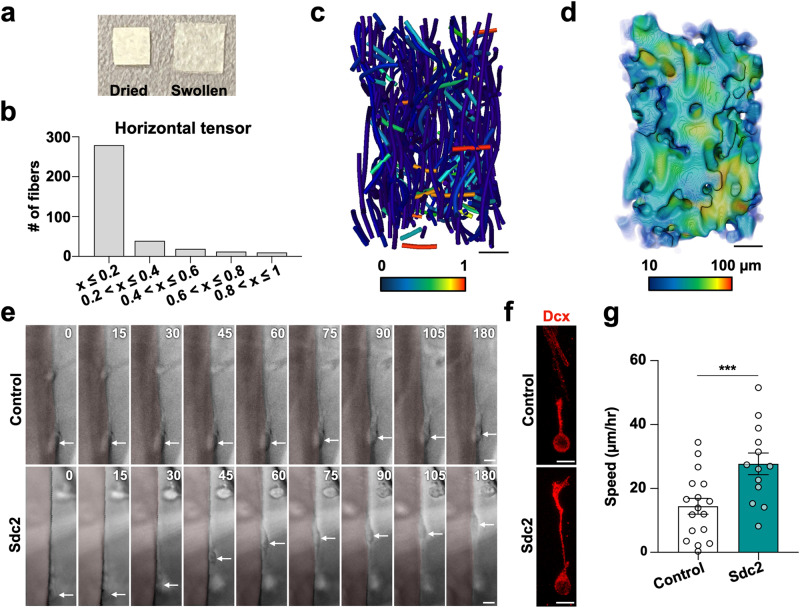
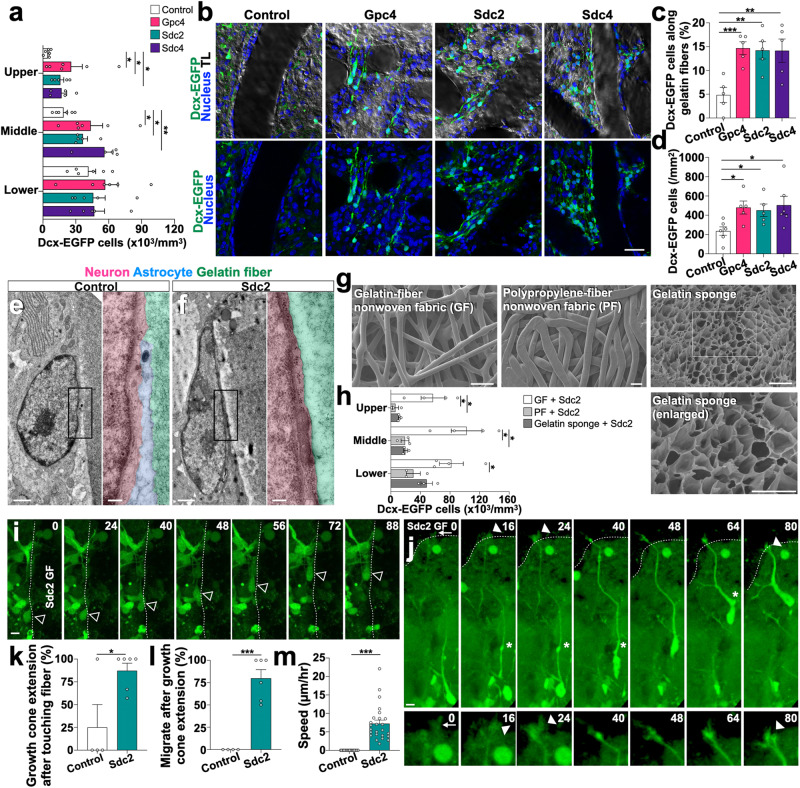
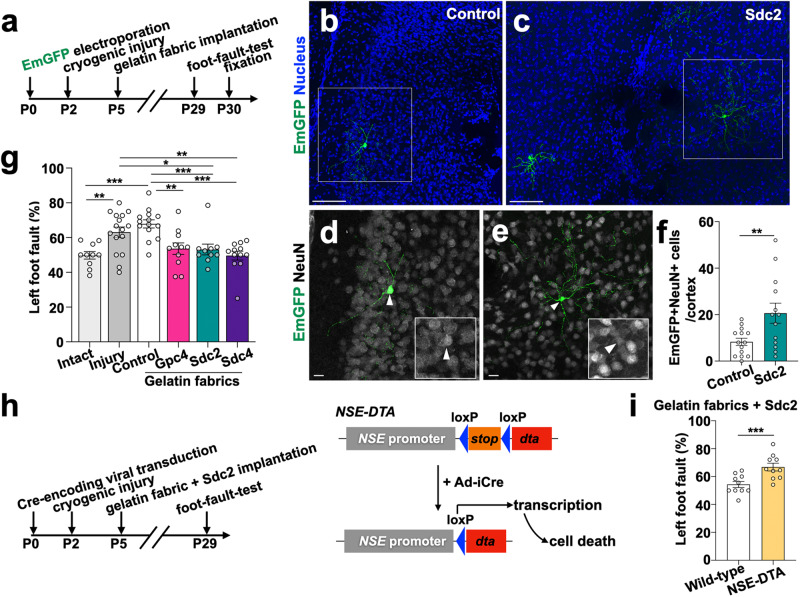
Axonal growth cones mediate axonal guidance and growth regulation. We show that migrating neurons in mice possess a growth cone at the tip of their leading process, similar to that of axons, in terms of the cytoskeletal dynamics and functional responsivity through protein tyrosine phosphatase receptor type sigma (PTPσ). Migrating-neuron growth cones respond to chondroitin sulfate (CS) through PTPσ and collapse, which leads to inhibition of neuronal migration. In the presence of CS, the growth cones can revert to their extended morphology when their leading filopodia interact with heparan sulfate (HS), thus re-enabling neuronal migration. Implantation of an HS-containing biomaterial in the CS-rich injured cortex promotes the extension of the growth cone and improve the migration and regeneration of neurons, thereby enabling functional recovery. Thus, the growth cone of migrating neurons is responsive to extracellular environments and acts as a primary regulator of neuronal migration.


Conflict of interest statement

The authors declare no competing interests.

Figures

Fig. 1
Fig. 1. Leading process in migrating neurons shares morphological and molecular features with axonal growth cone.
a, b Time-lapse images of Venus-CAAX-labeled axon and leading process (LP) of differentiating (a) and migrating (b) neuron, respectively. Blue and pink arrows indicate tip of axonal growth cone and LP growth cone-like structure, respectively. Arrowhead indicates transient collapsed state of LP growth cone-like structure. c Migration speed in LP elongation and pause phases. d, e Representative images of an axonal growth cone (d) and LP growth cone-like structures (e) stained with phalloidin (green) and immunolabeled with antibodies targeting tyrosinated-tubulin (magenta) and acetylated-tubulin (cyan). Arrows indicate F-actin and tyrosinated tubulin-positive signals. f, g Representative super-resolution images of axonal (f) and LP (g) growth cones with labelling of GFP (green) and of the axonal growth cone molecules Destrin, Liprin-α, PTPσ, and Syntaxin-7 (red and pseudocolors [numbers indicate 16-bit depth]). Dotted lines indicate the segmented growth cone area (GC). h Colocalization of PTPσ (red), Liprin-α (cyan), and F-actin (green) in the LP growth cone. i Representative super-resolution images of LP growth cones of control and Liprin-α-KD cells stained for GFP (green) and PTPσ (red). Arrows indicate PTPσ+ signals in the leading shaft. Quantification of PTPσ localization in the growth cone and leading shaft of control and Liprin-α-KD neurons is shown. j Experimental scheme for analysis of CSPG-PTPσ signaling. k–p Time-lapse images (k–n), growth cone area (o), and migration speed (p) of Venus-CAAX (green)- and DsRed (red; k–m, control; n, PTPσ-KD)-expressing migrating neurons cultured in Matrigel (magenta zone) with (l–n) or without k CS. Arrows indicate tips of growth cones (k–n). q Common morphological and molecular features of axonal and LP growth cones. Numbers indicate time in min (a, b, kn) from the first imaging frame. Scale bars: a, b, fh, 2 µm; d, e, i, kn, 5 µm. *p < 0.05, ***p < 0.005. Error bars indicate mean ± SEM.
Fig. 2
Fig. 2. Heparan sulfate proteoglycans promote growth cone extension and neuronal migration by relieving chondroitin sulfate-PTPσ-mediated inhibition.
a Experimental design for Sdc2-coated stripe assay embedded in the CS-containing Matrigel. b, c Time-lapse images of Venus-CAAX (green)- and DsRed (red)-expressing migrating neurons on control or Sdc2 stripes (magenta) cultured in the CS-containing Matrigel. Boxed areas are enlarged at the bottom. Arrows and arrowheads indicate tip filopodium and growth cone, respectively. d Length of tip filopodium on control and Sdc2 stripes. e Degree of formed tip filopodium (TF) and growth cone (GC) on Sdc2 stripes. f, g Growth cone area (f) and migration speed (g). h Correlation between growth cone area and migration speed. i Scheme of proteomics analysis. j Localization of Cortactin (cyan) and its pY421 form (red) in an LP growth cone of an EmGFP+ (green) neuron. Boxed area is enlarged. k Localization (left) and intensity (right) of pY421-Cortactin (red) in the growth cones of control and Fyn-KD (EmGFP, green) Dcx+ (magenta) neurons. l–s Functional analyses of Fyn and Cortactin in neuronal migration. Time-lapse images of EmGFP (green)-expressing migrating neurons on Sdc2 stripes (magenta); the neurons were cultured in CS-containing Matrigel. KD-resistant WT- (o) or Y421A- (p) Cortactin (Cortactin*) expressing cells are labelled with mCherry (red). Tip filopodium length (q), growth cone area (r), and migration speed (s) are shown. Arrows indicate tip filopodium on Sdc2 stripes. Numbers indicate time in min (b, c, lp) from the first imaging frame. Scale bars: b, c, j, lp, 5 µm; k, 2 µm. *p < 0.05, **p < 0.01, ***p < 0.005 (in qs, vs Control); #p < 0.05, ###p < 0.005. Error bars indicate mean ± SEM.
Fig. 3
Fig. 3. Leading filopodium promotes growth cone extension and subsequent neuronal migration in the presence of CS.
a Experimental design using Opto-Latrunculin and Photostatin-1. b–f Time-lapse images of Venus-CAAX (green)- and DsRed (red)-expressing migrating neurons on Sdc2 stripes (magenta) cultured without inhibitors (b), with 5 µM Opto-Latrunculin (c, d), or with 2 µM Photostatin-1 (e, f). Regions of illumination with 514 (b–f) and 405 (b, d, f) nm laser are shown in green and purple box, respectively. g–i Leading filopodium length (g), growth cone area (h), and speed (i) of migrating neurons treated with Opto-Latrunculin (Opto-Lat) or Photostatin-1 (PST-1). Arrows and arrowheads indicate leading filopodium and growth cone, respectively. Numbers indicate time in min from the first imaging frame (b–f). Scale bars: bf, 5 µm. *p < 0.05, **p < 0.01, ***p < 0.005. Error bars indicate mean ± SEM.
Fig. 4
Fig. 4. Migrating neurons in CS-rich injured cortex collapse their growth cones.
a Schematic image shows coronal brain section with neurons (green) migrating from the V-SVZ toward the injured cortical layers (brown) through the corpus callosum (CC). The scale indicates the distance from dorsal V-SVZ used in (d) and (e). b–d A Z-stack projection image of Dcx-EGFP+ cells (green) and CS (red) in a P9 injured brain section including V-SVZ, corpus callosum (CC), and cortex. The representative extended growth cone morphology (c) and collapsed morphology (d) of Dcx-EGFP+ cells in CS-induced injured cortex. e A representative image of Dcx-EGFP+ cells (green) expressing PTPσ (red) in the P14 injured cortex. The boxed area is enlarged. f Relative intensity of CS signal in the P9 injured cortex (0 to <100 μm, 100 to <300 μm, and 300 ≤ μm from the dorsal V-SVZ) was analyzed. The intensity in the area within 100 µm from the dorsal V-SVZ was set as 1. g The percentage of extended growth cones of observed Dcx-EGFP+ cells in the P9 injured cortex (0 to <100 μm, 100 to <300 μm, and 300 ≤ μm from the dorsal V-SVZ). h, i Representative three-dimensional constructions of migrating neurons (green) in the P9 injured cortex analyzed by SBF-SEM. Yellow represents nuclei. Extended (h) and collapsed (i) growth cones are shown. Boxed areas are enlarged. Arrows and arrowheads indicate filopodia and lamellipodia, respectively. Interactive 3D models of neurons are shown at https://sketchfab.com/3d-models/migratory-neuron-with-extended-growth-cone-b6c4b616f56343929cab8e3edca1c884 (h) and https://sketchfab.com/3d-models/migratory-neuron-with-collapsed-growth-cone-70648b036df64a01a30339717b22537f (i). j Time-lapse images of a slice cultured P8 Dcx-EGFP injured cortex section. A Dcx-EGFP+ cell migrates towards the injured site and the growth cone changes direction during the migration. Boxed areas are enlarged and shown on the right panels. Scale bars: b, 100 µm; c, d, e, 10 µm; j, 5 µm. *p < 0.05, **p < 0.01. Error bars indicate mean ± SEM.
Fig. 5
Fig. 5. Gelatin-fiber nonwoven fabric serves as a scaffold for migrating neurons.
a Dried and swollen gelatin fabrics. b, c The alignment distribution of gelatin fibers (b) and fiber centerlines (c). The color-code indicates the horizontal fiber orientation tensor (the more horizontal the fiber, the higher the value). d 3D image of voids among gelatin fibers in the fabric. The color-code indicates the void thickness. e Time-lapse images of migrating neurons (arrows) aligned with the control or Sdc2-containing gelatin fiber (pale pink) at different time points (minutes). f Representative Z-stack confocal images of migrating neurons (Dcx; red) on the gelatin fibers with or without Sdc2. g The speed of neurons migrating along the control or Sdc2-containing gelatin fibers embedded in Matrigel with CSPG. Scale bars: c, d, 100 µm; e, f, 5 µm. ***p < 0.005. Error bars indicate the mean ± SEM.
Fig. 6
Fig. 6. Gelatin fabrics containing HSPG promote growth cone extension and neuronal migrating in the injured brain.
a Densities of Dcx-EGFP+ neurons in the P9-injured cortical layers (lower, middle, and upper) containing gelatin fabrics with or without HSPGs. b Distribution of Dcx-EGFP+ neurons in the vicinity of and along the gelatin fibers with or without HSPGs in the P9-injured cortex. Transmitted light images (TL) are overlaid with Dcx-EGFP+ cells (green) and Hoechst 33342 (blue) Z-stack projection images. c, d The percentage (c) and density (d) of Dcx-EGFP+ cells along the gelatin fibers in P9 middle and upper cortex. e, f Transmission electron microscopy of the P9 cryoinjured cortex with implanted gelatin fibers. Boxed areas are enlarged. Migrating neurons (pink), gelatin fibers (green), and an astrocyte (blue). g Scanning electron microscopy of dried biomaterials. The cross-section image of the gelatin sponge is enlarged. h Density of Dcx-EGFP+ neurons in P9-injured cortical layers (lower, middle, and upper) implanted with Sdc2-including gelatin fabric (GF), gelatin sponge, and polypropylene fabric (PF). i, j Time-lapse images of Dcx-EGFP brain slice cultures with Sdc2-containing gelatin fibers. A Dcx-EGFP+ cell (open arrowheads) migrates along the fiber (i). Another cell migrates a long distance toward the fiber (j). An arrow, arrowheads, and asterisks indicate a filopodium, extended growth cones, and swellings, respectively. Dotted lines indicate the borders between the gelatin fiber and the tissue. k–m The graphs show the percentage of growth cone extension after touching gelatin fibers (k), the percentage of neuronal migration within 2 hours after growth cone extension (l), and the speed of migrating neurons attached to gelatin fibers (m). Scale bars: b, 200 µm; g (GF and PF), 100 µm; g (gelatin sponge), 10 µm; i, j, 5 µm; e, f, 1 µm; e (enlarged), f (enlarged), 0.2 µm. *p < 0.05, **p < 0.01, ***p < 0.005. Error bars indicate the mean ± SEM.
Fig. 7
Fig. 7. HSPG-containing gelatin scaffold facilitates neuronal regeneration with functional recovery after cortical injury.
a Experimental design for assessment of neuronal maturation and gait behavior. b–e Z-stack projection images of coronal brain sections show that EmGFP-labeled (green) V-SVZ-derived cells in the vicinity of the injury express mature neuronal marker NeuN (white). Magnified views of the EmGFP+NeuN+ cells in the boxed areas are presented in (d and e) (white arrowheads). f Quantification of EmGFP+NeuN+ cells in injured cortex. The graph shows the total number of EmGFP-labelled NeuN+ cells in P30 control or Sdc2-containing gelatin fabric-implanted injured cortices. A dot represents the examined brain. g Foot-fault test in mice with or without cortical injury and gelatin fabric implant. The graph represents the frequency of left hindlimb fault-steps. h Experimental design for the experiment using NSE-DTA mice. i Foot-fault test on adenovirus expressing Cre recombinase-injected NSE-DTA mice and wild-type mice, implanted with Sdc2-including gelatin fabric. The graph represents the frequency of left hindlimb fault-steps. Scale bars: b, c, 100 µm; d, e, 10 µm. *p < 0.05,  **p < 0.01, ***p < 0.005. Error bars indicate mean ± SEM.

Similar articles

Cited by

References

    1. Cajal SR. A quelle époque apparaissent les expansions des cellules nerveuses de la moelle épinière du poulet. Anat. Anz. 1890;5:609–613.
    1. Lowery LA, Van Vactor D. The trip of the tip: understanding the growth cone machinery. Nat. Rev. Mol. Cell Biol. 2009;10:332–343. doi: 10.1038/nrm2679. - DOI - PMC - PubMed
    1. Igarashi M. Molecular basis of the functions of the mammalian neuronal growth cone revealed using new methods. Proc. Japan Acad. Ser. B. 2019;95:358–377. doi: 10.2183/pjab.95.026. - DOI - PMC - PubMed
    1. Stoeckli ET. Understanding axon guidance: are we nearly there yet? Development. 2018;145:dev151415. doi: 10.1242/dev.151415. - DOI - PubMed
    1. Smith SJ. Neuronal Cytomechanics: The Actin-Based Motility of Growth Cones. Science. 1988;242:708–715. doi: 10.1126/science.3055292. - DOI - PubMed

MeSH terms

Substances

LinkOut - more resources