. 2024 Mar 9;15(3):201.
doi: 10.1038/s41419-024-06581-1.

Deficiency of skeletal muscle Agrin contributes to the pathogenesis of age-related sarcopenia in mice

Affiliations

Deficiency of skeletal muscle Agrin contributes to the pathogenesis of age-related sarcopenia in mice

Jie Chen et al. Cell Death Dis. .

Abstract

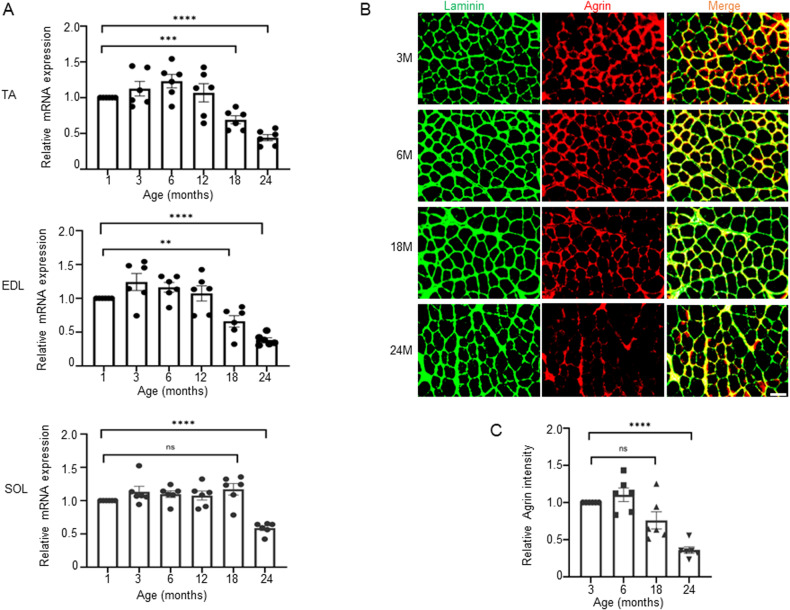
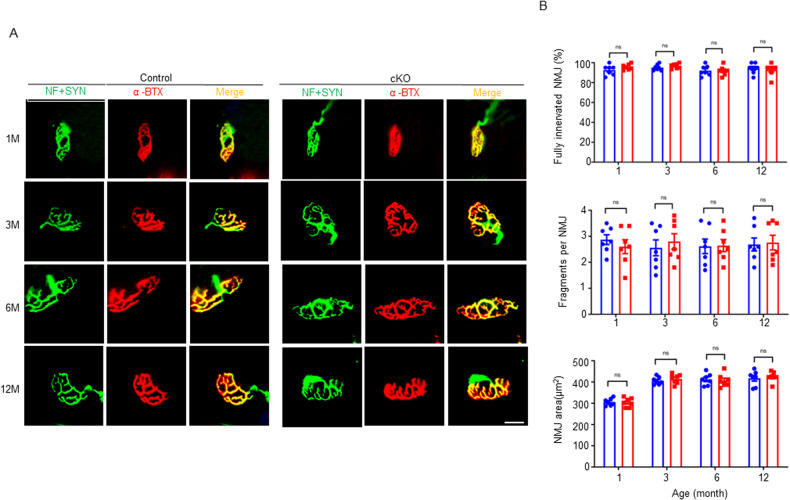
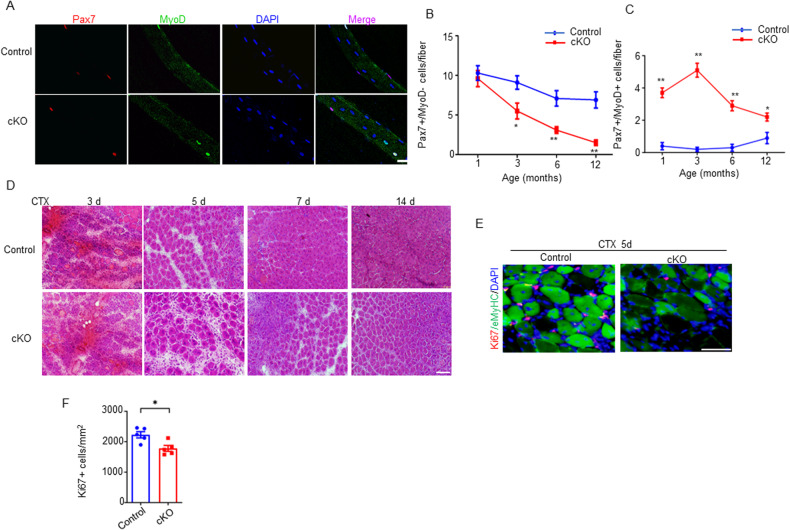
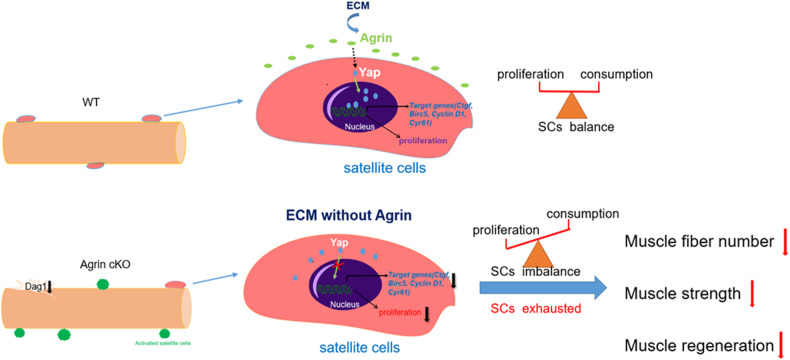
Sarcopenia, a progressive and prevalent neuromuscular disorder, is characterized by age-related muscle wasting and weakening. Despite its widespread occurrence, the molecular underpinnings of this disease remain poorly understood. Herein, we report that levels of Agrin, an extracellular matrix (ECM) protein critical for neuromuscular formation, were decreased with age in the skeletal muscles of mice. The conditional loss of Agrin in myogenic progenitors and satellite cells (SCs) (Pax7 Cre:: Agrin flox/flox) causes premature muscle aging, manifesting a distinct sarcopenic phenotype in mice. Conversely, the elevation of a miniaturized form of Agrin in skeletal muscle through adenovirus-mediated gene transfer induces enhanced muscle capacity in aged mice. Mechanistic investigations suggest that Agrin-mediated improvement in muscle function occurs through the stimulation of Yap signaling and the concurrent upregulation of dystroglycan expression. Collectively, our findings underscore the pivotal role of Agrin in the aging process of skeletal muscles and propose Agrin as a potential therapeutic target for addressing sarcopenia.


Conflict of interest statement

The authors declare no competing interests.

Figures

Fig. 1
Fig. 1. Reduced Agrin levels in aged muscles of mice.
A qRT‒PCR of Agrin in TA, EDL and soleus muscles from mice at different ages. n = 6 mice. B Representative immunofluorescence staining of α-Laminin (green) and Agrin (red) in TA muscles from WT mice at 3, 6, 12 and 24 months of age. Scale bar = 50 μm. C Quantification of data presented in B, n = 6 mice, **p < 0.01, ****p < 0.0001.
Fig. 2
Fig. 2. The absence of Agrin leads to progressive muscle fiber atrophy, fiber type conversion, and loss of muscle mass.
A Schematic diagrams of Pax7-Cre-driven deletion of Agrin in mice. B Representative immunofluorescence staining of Agrin (red) in control and cKO TA muscle sections and quantification of data, n = 5 mice per genotype. C Bodyweights of control and cKO mice at different ages. n = 15 mice per genotype. D Muscle weights of control and cKO mice at 3 and 12 months of age. n = 15 mice per group. E Representative H&E staining images of TA muscle (fast twitch) cross-sections. F Quantification of total fiber number and CNF percentage in TA muscles (fast twitch). n = 15 mice per group. G α-Laminin staining showing the relative size of myofibers in TA muscles from mice at 12 months of age. H Frequency of distribution for CSA (µm2) of TA muscle (n = 5 per genotype). I Representative immunofluorescence staining of α-Laminin (red) and MyHC-2B (green) in TA muscle in mice at 12 months of age. J Quantification of data in I, n = 7 mice per genotype. Scale bar = 50 μm, *p < 0.05, **p < 0.01, ****p < 0.0001.
Fig. 3
Fig. 3. The absence of Agrin leads to progressive muscle function deficits.
Grip strength (A) and running distance (B) of control and cKO mice at 3 and 12 months of age. n = 15 mice per group. Comparable single twitch and tetanic forces between control and cKO mice at 3 months (CE) and 12 months (FH) of age. D, G Representative tetanic curve. n = 15 mice per group. *p < 0.05, **p < 0.01, ****p < 0.0001.
Fig. 4
Fig. 4. NMJ structure was normal in Agrin cKO mice.
A Representative images of NMJs in cKO and control mice at 1, 3, 6 and 12 months of age. TA muscles were stained with α-BTX to label AChRs (red) and NF/SYN (green) to label nerve terminals. Scale bar = 10 μm. (B) Quantification of data in A. n = 8 mice per group and 25–30 NMJs of each mouse were counted.
Fig. 5
Fig. 5. The absence of Agrin disrupted muscle stem cells and impaired muscle regeneration.
A Representative immunofluorescence staining of Pax7 (red) and MyoD (green) for control and cKO EDL single muscle fibers. Scale bar = 10 μm. B, C Quantitative data of quiescent (Pax7+ MyoD−) and activated (Pax7− MyoD+) SCs in EDL single muscle fibers from control and cKO mice. n = 5 mice per group, 20 myofibers per mouse. D Representative H&E staining images of CTX-induced injured TA muscles from control and cKO mice. Scale bar = 100 μm. E Representative immunofluorescence staining of eMyHC (green) and Ki67 (red) in TA muscle sections after CTX injection. Scale bar = 50 μm (F) Quantification of data in E, n = 5 mice per genotype. *p < 0.05, **p < 0.01, ***p < 0.001.
Fig. 6
Fig. 6. AAV-mini-Agrin reversed age-associated muscle weakness.
Grip strength (A), running distance (B), single twitch force (C) and tetanic force (D) of control and AAV-Agrin treated mice (5 weeks after administration). n = 10 mice per group. E Representative H&E staining images of TA muscle sections from control and AAV-Agrin treated mice. Scale bar = 50 μm. F Quantification of the total number and average cross-sectional area. n = 10 mice per group. G Representative immunofluorescence staining of Pax7 and Ki67 in TA muscle sections from control and AAV-Agrin treated mice 5days after CTX injected. Scale bar = 20 μm. H Quantification of data in G. n = 6 mice per group, 15–20 section images per mouse. *p < 0.05, **p < 0.01.
Fig. 7
Fig. 7. Yap signaling and α-DG were involved in Agrin deficiency and sarcopenic muscles.
A Western blot analysis of Agrin mediated pathways in skeletal muscles from Agrin-deficient and aged mice. B Quantification of data in A. n = 3 mice per group. C qRT‒PCR analysis of Yap downstream targets in skeletal muscles from Agrin-deficient and aged mice. n = 5 mice per group. D Representative images of Yap (red) in young (2-3 months) and aged (18–20 months) myoblast. E Quantification of data in D, N > C refers to predominant nuclear YAP. n = 7 mice per group, Scale bar = 50 μm.*p < 0.05, **p < 0.01, ***p < 0.001, ****p < 0.0001.
Fig. 8
Fig. 8
Proposed model: Agrin deficiency reduces Yap activity and dystroglycan expression, leading to SCs excessively consumption and exhaustion with age, eventually causing muscle weakness and premature muscle aging.

References

    1. Rosenberg IH. Sarcopenia: origins and clinical relevance. J Nutr. 1997;127:990S–1S. doi: 10.1093/jn/127.5.990S. - DOI - PubMed
    1. Cruz-Jentoft AJ, Sayer AA. Sarcopenia. Lancet. 2019;393:2636–46. doi: 10.1016/S0140-6736(19)31138-9. - DOI - PubMed
    1. Cruz-Jentoft AJ, Baeyens JP, Bauer JM, Boirie Y, Cederholm T, Landi F, et al. Sarcopenia: European consensus on definition and diagnosis: Report of the European Working Group on Sarcopenia in Older People. Age Ageing. 2010;39:412–23. doi: 10.1093/ageing/afq034. - DOI - PMC - PubMed
    1. Chen LK, Liu LK, Woo J, Assantachai P, Auyeung TW, Bahyah KS, et al. Sarcopenia in Asia: consensus report of the Asian Working Group for Sarcopenia. J Am Med Dir Assoc. 2014;15:95–101. doi: 10.1016/j.jamda.2013.11.025. - DOI - PubMed
    1. De Spiegeleer A, Beckwee D, Bautmans I, Petrovic M, Sarcopenia Guidelines Development group of the Belgian Society of G, Geriatrics. Pharmacological Interventions to Improve Muscle Mass, Muscle Strength and Physical Performance in Older People: An Umbrella Review of Systematic Reviews and Meta-analyses. Drugs Aging. 2018;35:719–34. doi: 10.1007/s40266-018-0566-y. - DOI - PubMed

Publication types

LinkOut - more resources