. 2024 Mar 9;15(1):2163.
doi: 10.1038/s41467-024-46422-5.

Mi-2β promotes immune evasion in melanoma by activating EZH2 methylation

Affiliations

Mi-2β promotes immune evasion in melanoma by activating EZH2 methylation

Cang Li et al. Nat Commun. .

Abstract

Recent development of new immune checkpoint inhibitors has been particularly successfully in cancer treatment, but still the majority patients fail to benefit. Converting resistant tumors to immunotherapy sensitive will provide a significant improvement in patient outcome. Here we identify Mi-2β as a key melanoma-intrinsic effector regulating the adaptive anti-tumor immune response. Studies in genetically engineered mouse melanoma models indicate that loss of Mi-2β rescues the immune response to immunotherapy in vivo. Mechanistically, ATAC-seq analysis shows that Mi-2β controls the accessibility of IFN-γ-stimulated genes (ISGs). Mi-2β binds to EZH2 and promotes K510 methylation of EZH2, subsequently activating the trimethylation of H3K27 to inhibit the transcription of ISGs. Finally, we develop an Mi-2β-targeted inhibitor, Z36-MP5, which reduces Mi-2β ATPase activity and reactivates ISG transcription. Consequently, Z36-MP5 induces a response to immune checkpoint inhibitors in otherwise resistant melanoma models. Our work provides a potential therapeutic strategy to convert immunotherapy resistant melanomas to sensitive ones.


Conflict of interest statement

The authors declare no competing interests.

Figures

Fig. 1
Fig. 1. Identification of Mi-2β regulating melanoma cell resistance to immunotherapy.
a, b Mice bearing Mi-2β knockdown or shScramble B16F10 cells were treated with i.p. injection of control IgG (10 mg/kg) or anti-PD-1 (10 mg/kg) antibodies at day 6, 9, 12, 15 and 18 after tumor cell inoculation, tumor volume (n = 5) and tumor weight (n = 5) were measured. c Mouse survival (n = 5) over time. Log-rank test was used to determine P value. d The representative cell populations of CD4+ and CD8+ are shown. e Tumor-infiltrating lymphocytes in the graft tumor were measured by flow cytometry. e The number of CD4+ T cells and CD8+ were gated within CD45+ T cells (n = 5). f Granzyme B expression in CD8+ T was measured and quantified by flow cytometry (n = 5). a, b, e, f Values represent mean ± SD. The unpaired, two tailed t-test. Source data are provided as a Source Data file.
Fig. 2
Fig. 2. Mi-2β deficiency induced responses to immunotherapy in melanoma.
a A schematic for experimental strategy with anti-PD-1 treatment on genetically engineered melanoma mouse model. Mice carrying conditional alleles of Tyr::CreER;BRafCA;Ptenlox/lox or Tyr::CreER;BRafCA;Ptenlox/loxMi-2βlox/lox were administered with tamoxifen for constant 5 days to activate CreER to cause melanocyte-specific conversion of BrafCA to BrafV600E, and the conversion of the Ptenlox/lox and Mi-2βlox/lox alleles to null alleles, which expressed proteins of BRafV600E/Ptennull or BRafV600E/Ptennull /Mi-2βnull, respectively. Mice with measurable tumors were randomly treated with either control IgG (10 mg/kg) or anti-PD-1 (10 mg/kg) antibodies at day 9, 12, 15, 18 and 21 after Cre activation. b Survival of BRafV600E/Ptennull mice treated with IgG (n = 11) or anti-PD-1 (n = 12), and of BRafV600E/Ptennull /Mi-2βnull mice treated with IgG (n = 14) or anti-PD-1 (n = 11). Log-rank test was used for P value calculation, NS represents no significance. c TILs were assayed with flow cytometry. The number of CD8+ cells and CD4+ T cells gated within CD45+ T cells were demonstrated (n = 6). d Granzyme B expression in CD8+ T was determined and quantified by flow cytometry (n = 6). e Expression of activation markers on CD8+ T cells were determined by flow cytometry. MFI represents mean fluorescence intensity (n = 5). c, d, e Values represent mean ± SD. The unpaired, two tailed t-test. Source data are provided as a Source Data file.
Fig. 3
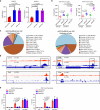
Fig. 3. Depletion of Mi-2β promotes the transcription of interferon-stimulated genes by promoting chromatin remodeling.
a The amount of secreted Cxcl9 or Cxcl10 were measured in B16F10 cells with Mi-2β silencing by ELISA (n = 3). b The graft melanomas were isolated and cultured in PBS with the same amount of cells for 4 h (for each group graft melanomas = 5), and then the secreted amount of the chemokines Cxcl9 and Cxcl10 in the culture medium was measured by ELISA. c Genomic distribution of DARs and binding consensus of the TFs. d ATAC-seq bedgraph panels of the gene locus showing the peak locations relative to the TSS. The panels were compared with ATAC signals between scramble and Mi-2β knockdown B16F10 cells. e ChIP assays were performed to detect Mi-2β binding on the promoter of Cxcl9 and Cxcl10 genes in both shScramble and Mi-2β knockdown B16F10 cells, with IP by anti-Stat1 was used as the positive binding control (n = 3). a, b, e Values represent mean ± SD. The unpaired, two tailed t-test. Source data are provided as a Source Data file.
Fig. 4
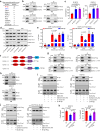
Fig. 4. Mi-2β promotes the K510 methylation of EZH2 to inhibit the transcription of ISGs.
a Mass spectral peptide count of Mi-2β-interacting proteins. b Endogenous Mi-2β-EZH2 interactions were detected by immunoprecipitation in B16F10 and the primary mouse melanoma cells (PM) (n = 3, independent experiments). c The amount of secreted Cxcl10 was measured in B16F10 cells with EZH2 silencing by ELISA (n = 3). d The epigenetic modifications of H3 (H3K27ac, H3K27me1 and H3K27me3) were measured in B16F10 cells or PM cells with EZH2 silencing by Western blot (n = 3, independent experiments). e ChIP–quantitative polymerase chain reaction for enrichment of H3K27me3/H3K27me1 at gene locus in B16F10 cells with shMi-2β (n = 3). f, g Mapping the interaction interface of EZH2 with Mi-2β by immunoprecipitation. HA-tagged EZH2 WT or deletion mutants and Flag-tagged Mi-2β were used as indicated and detected by immunoprecipitation in B16F10 cell. SANT1, SANT domain I; SANT2, SANT domain II; CXC, cysteine-rich domain; SET, methyltransferase catalytic domain (g: n = 3, independent experiments). h EZH2 lysine methylation was detected by immunoprecipitation with specific anti-Mi-2β antibodies, anti-EZH2 antibodies or anti- pan-monomethylated lysine antibodies, respectively (n = 3, independent experiments). Mi-2β (i) levels or total Mi-2β-Flag (j) in the whole-cell lysate (WCL) and pan-methylated lysine levels of immunoprecipitated EZH2, EZH2 K735A or EZH2 K510A were detected in B16F10 melanoma cells. Immunoglobulin G (IgG) Immunoprecipitation served as a negative control (n = 3, independent experiments). k The amount of secreted Cxcl9 and Cxcl10 were measured by ELISA in B16F10 cells of stable EZH2 silencing and EZH2 WT or mutant EZH2 reintroduction (n = 3). c, e, k Values represent mean ± SD. The unpaired, two tailed t-test. Source data are provided as a Source Data file.
Fig. 5
Fig. 5. Screening and identifying Mi-2β inhibitors.
a Schematic representing in vitro screen assay for testing Mi-2β chromatin modulatory activity using FRET-based nucleosome repositioning assay. b The chemical structure of Z36-MP5. c Orientation of Z36-MP5 to homologized Mi-2β. Z36-MP5 was docked into the ATP-binding pocket of homologized Mi-2β. The methyl group of Z36-MP5 extended to a solvent-exposed channel lined with the side chains of Tyr729, Leu755, Met966, and Ile1163, with generating H-bonds via the O atom of keto group with His727, O atom of amide group with Gly756, and protonated N atom of imidazole group with Asp873. The atoms of Z36-MP5 were colored as follows: carbon pink, oxygen red, nitrogen blue, and hydrogen white. The H-bonds between Z36-MP5 and homologized Mi-2β were shown as light-yellow dashed lines. d The inhibitory activity of Z36-MP5 for Mi-2β chromatin modulatory activity, measured as fold change of Mi-2β activity treated with control vehicle (n = 3). e The inhibitory activity of Z36-MP5 with IC50 values against Mi-2β at different ATP concentrations (n = 3). f The expression of Cxcl9 and Cxcl10 mRNA in B16F10 cells treated with Z36-MP5 as indicated concentration for 24 h was determined with RT-qPCR assay (n = 3). f Values represent mean ± SD. The unpaired, two tailed t-test. Source data are provided as a Source Data file.
Fig. 6
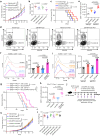
Fig. 6. Mi-2β inhibitor Z36-MP5 induced immune response to immunotherapy in resistant melanoma.
a Mice bearing B16F10 cell graft were treated with control IgG or anti-PD-1 antibodies, and vehicle control or Z36-MP5, as indicated, and the growth of tumor grafts was shown. For each group n = 5. Mice bearing B16F10 cells were treated with control IgG or anti-PD-1 antibody, and vehicle control or Z36-MP5, as indicated. For each group n = 5. Tumor weight (b) and mouse survival curve (c) were shown, with log-rank test for mouse survival curve P value. d, e Tumor-infiltrating lymphocytes (TILs)were assayed and quantified for CD4+ and CD8+ T-cell number in total CD45+ cells by flow cytometry (n = 5). f Granzyme B expression in CD8+ T was determined and quantified by flow cytometry (n = 5). g Mice carrying conditional alleles of Tyr::CreER;BRafCA;Ptenlox/lox were administered with tamoxifen for 5 days to activate CreER to cause melanocyte-specific conversion of BrafCA to BrafV600E, and the conversion of the Ptenlox/lox alleles to null alleles, which express proteins of BRafV600E/Ptennul. Mice with measurable tumors were randomly treated with either control IgG (10 mg/kg) or anti-PD-1 antibodies (10 mg/kg) and Z36-MP5 (30 mg/kg/day) as indicated. For each group n = 10. Mouse survival was shown with log-rank test for P value. h TILs were assayed by flow cytometry. The number of CD8+ T cells gated within CD45+ T cells were demonstrated (n = 5). i The expression of Granzyme B in CD8+ T was determined and quantified by flow cytometry (n = 5). MFI, mean fluorescence intensity. j A schematic for experimental strategy with anti-CD8 antibodies and Z36-MP5 treatment on melanoma mouse model. k, l Mice bearing B16F10 cell graft were treated with control IgG, anti-CD4 or anti-CD8, and then treated with Z36-MP5. The tumor volum (k) and weight (l) were shown. For each group n = 5. a, b, e, f, h, i, k, l Values represent mean ± SD. The unpaired, two tailed t-test. Source data are provided as a Source Data file.

References

    1. Franklin C, Livingstone E, Roesch A, Schilling B, Schadendorf D. Immunotherapy in melanoma: recent advances and future directions. Eur. J. Surg. Oncol. 2017;43:604–611. doi: 10.1016/j.ejso.2016.07.145. - DOI - PubMed
    1. Schadendorf D, et al. Pooled analysis of long-term survival data from phase II and phase III trials of ipilimumab in unresectable or metastatic melanoma. J. Clin. Oncol. 2015;33:1889–1894. doi: 10.1200/JCO.2014.56.2736. - DOI - PMC - PubMed
    1. Ribas A, et al. Association of pembrolizumab with tumor response and survival among patients with advanced melanoma. JAMA. 2016;315:1600–1609. doi: 10.1001/jama.2016.4059. - DOI - PubMed
    1. Larkin J, et al. Combined nivolumab and ipilimumab or monotherapy in untreated melanoma. N. Engl. J. Med. 2015;373:23–34. doi: 10.1056/NEJMoa1504030. - DOI - PMC - PubMed
    1. Postow MA, et al. Nivolumab and ipilimumab versus ipilimumab in untreated melanoma. N. Engl. J. Med. 2015;372:2006–2017. doi: 10.1056/NEJMoa1414428. - DOI - PMC - PubMed

MeSH terms