. 2024 Mar 9;15(1):2164.
doi: 10.1038/s41467-024-46480-9.

Interrogations of single-cell RNA splicing landscapes with SCASL define new cell identities with physiological relevance

Affiliations

Interrogations of single-cell RNA splicing landscapes with SCASL define new cell identities with physiological relevance

Xianke Xiang et al. Nat Commun. .

Abstract

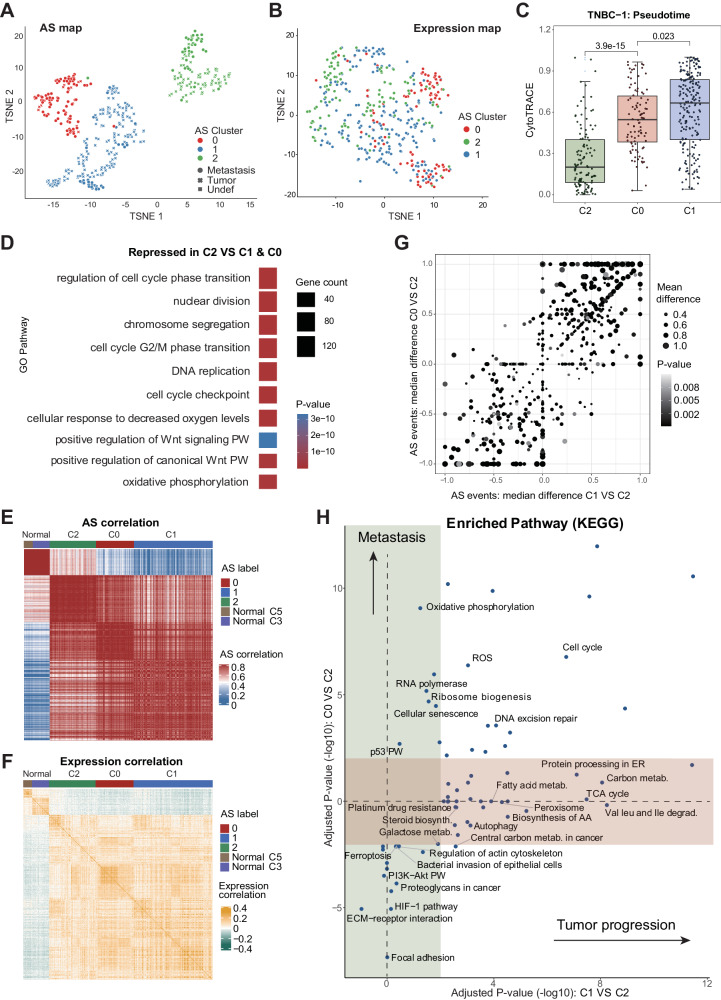
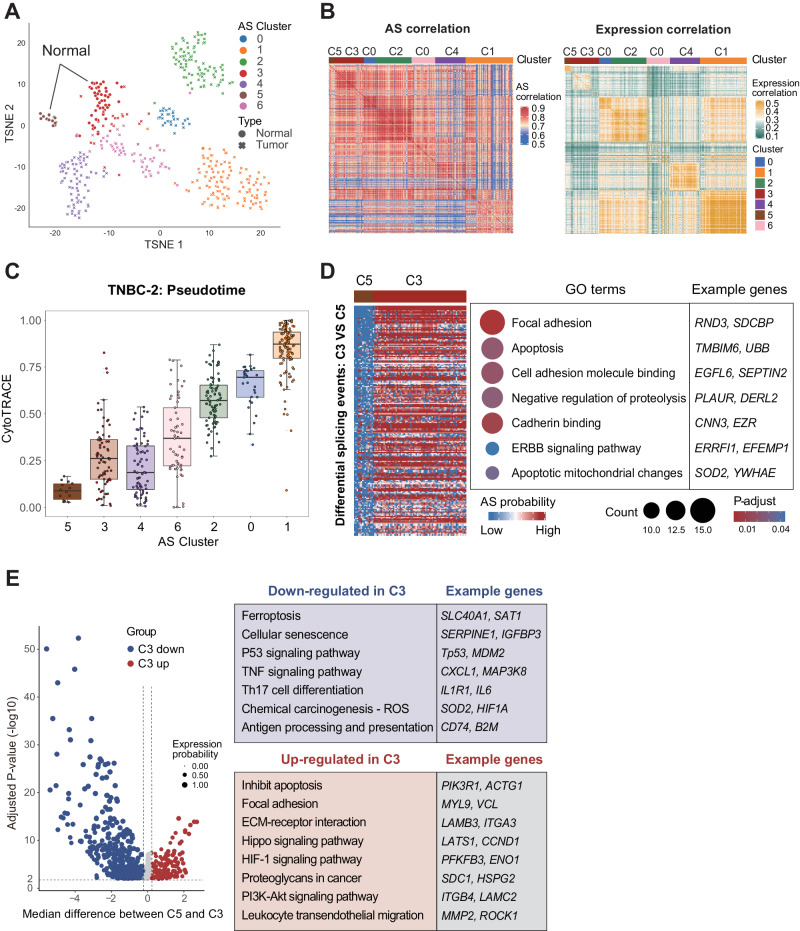
RNA splicing shapes the gene regulatory programs that underlie various physiological and disease processes. Here, we present the SCASL (single-cell clustering based on alternative splicing landscapes) method for interrogating the heterogeneity of RNA splicing with single-cell RNA-seq data. SCASL resolves the issue of biased and sparse data coverage on single-cell RNA splicing and provides a new scheme for classifications of cell identities. With previously published datasets as examples, SCASL identifies new cell clusters indicating potentially precancerous and early-tumor stages in triple-negative breast cancer, illustrates cell lineages of embryonic liver development, and provides fine clusters of highly heterogeneous tumor-associated CD4 and CD8 T cells with functional and physiological relevance. Most of these findings are not readily available via conventional cell clustering based on single-cell gene expression data. Our study shows the potential of SCASL in revealing the intrinsic RNA splicing heterogeneity and generating biological insights into the dynamic and functional cell landscapes in complex tissues.


Conflict of interest statement

The authors declare no competing interests.

Figures

Fig. 1
Fig. 1. Schematic overview of the SCASL pipeline.
SCASL takes raw scRNA-seq data as input and generates classifications of cell subpopulations. The pipeline is composed of 3 major steps: establishment of an AS probability matrix from the input data, imputation of the missing values in the matrix, and spectral clustering of the single cells.
Fig. 2
Fig. 2. TNBC tumor cell heterogeneity characterized by SCASL.
A, B UMAP plot showing clustering of 422 TNBC tumor cells by SCASL based on the AS landscapes (A) or clustering by Seurat based on the gene expression profiles with 3500 variable features. The cells are color labeled by the clusters defined by SCASL. The principal component analysis (PCA) is performed with a dimensionality reduction number of 20 for both methods. Source data are provided as a Source Data file. C Pseudotime analysis by CytoTRACE for the three cell clusters (the numbers of cells in C2, C0, and C1 are: 115, 94, and 196 respectively). Wilcoxon rank-sum test were used to evaluate the statistical significance between different groups (two-sided test, using Bonferroni correction to adjust for multiple comparisons). The X-axis is sorted from small to large according to the CytoTRACE value. The p-values of the differences between C2 and C0, and C0 and C1 are 3.9e-15 and 0.023 respectively. Data are presented as median values +/- SEM. Each box shows the median and interquartile range (IQR 25th–75th percentiles). Source data are provided as a Source Data file. D Gene Ontology (GO) functional enrichment of the genes downregulated in C2 cells compared to the other tumor cells (Wilcoxon test, two-sided test, p-value < 0.01). E, F Spearman correlations between the splicing profiles (E) or gene expression profiles (F) of TNBC tumor cells and normal breast epithelial cells. G Differential splicing profiles of C1 (X-axis) or C0 (Y-axis) compared to C2. Dot sizes represent the mean differences in the AS probabilities, and the p-values of differential splicing calculated by Fisher’s exact test are shown in grayscale (two-sided test). H Kyoto Encyclopedia of Genes and Genomes (KEGG) pathway enrichment analysis of the differentially expressed genes in C1 (X-axis) or C0 (Y-axis) compared to C2, represented by adjusted p-values obtained from GSEA.
Fig. 3
Fig. 3. SCASL identifies precancerous epithelial cells in TNBC based on AS landscapes.
A TSNE plot showing clustering of 443 normal epithelial cells and primary TNBC tumor cells based on AS landscapes. The principal component analysis (PCA) is performed with a dimensionality reduction number of 20. Source data are provided as a Source Data file. B Heatmaps showing Spearman correlations between all normal and tumor cells based on AS (left) or normalized gene expression (right) profiles. C Pseudotime analysis by CytoTRACE for the clusters defined by SCASL (the numbers of cells are 14, 70, 73, 57, 86, 29, and 114, from left to right). Data are presented as median values +/- SEM. Each box shows the median and interquartile range (IQR 25th–75th percentiles). Source data are provided as a Source Data file. D The heatmap on the left shows the AS probabilities of the differential splicing events in C3 compared to C5 (p-value < 1e-5, hypergeometric distribution test were used in enrichment analysis, one-sided test). The dot plot on the right shows the pathways enriched by the genes bearing the differential spliced events, and some examples are provided. E Volcano plot showing the differentially expressed genes (t-test, two-sided test, adjusted p-value < 0.01) in C3 vs. C5. Differences in the median gene expression levels between the cells of C3 and C5 are shown on the X-axis, and the statistical significance values of the differentially expressed genes (adjusted p-values) are shown on the Y-axis. The sizes of the dots represent the proportions of the cells with expression. Biological functions and processes enriched in the differentially expressed genes are listed to the right, and some representative genes are provided. Source data are provided as a Source Data file.
Fig. 4
Fig. 4. SCASL identifies developmental lineages of embryonic hepatoblasts.
A TSNE plot showing clustering of 486 embryonic liver cells by SCASL based on AS profiles. The principal component analysis (PCA) is performed with a dimensionality reduction number of 20. The arrows in the figure represent the approximate sequence of embryonic days corresponding to each cluster. Source data are provided as a Source Data file. B Pseudotime analysis by CytoTRACE for the hepatoblast/hepatocyte and cholangiocyte clusters. Seven hepatoblast/hepatocyte clusters contained a total of 349 cells (the numbers of cells are 31, 11, 30, 52, 140, 39, and 56, from left to right), and four cholangiocyte clusters contained a total of 137 cells (the number of cells are 57, 36, 13, and 21, from left to right). Data are presented as median values +/- SEM. Each box shows the median and interquartile range (IQR 25th–75th percentiles). Source data are provided as a Source Data file. C, D Biological function enrichment analysis of the differentially expressed genes (Wilcoxon test, two-sided test, p-value < 1e-5) in each cluster of the hepatocyte lineage compared to C2 (C) or in each cluster of the cholangiocyte lineage compared to C0. Red indicates upregulation, and blue indicates downregulation. E, F AS profiles of the top differential splicing events based on pairwise comparisons between the adjacent clusters along the hepatocyte (E) and cholangiocyte (F) lineages. G Biological function enrichment analysis of the differentially expressed genes for each cluster compared to all the other cells (Wilcoxon test, two-sided test, p-value < 1e-5). Functional processes related to hepatocytes, cholangiocytes, and stemness were selected and displayed in the dot plots.
Fig. 5
Fig. 5. Clusters of tumor-associated T cells defined by SCASL.
A UMAP plot showing clustering of 2349 T cells by SCASL based on AS profiles. The principal component analysis (PCA) is performed with a dimensionality reduction number of 30. Source data are provided as a Source Data file. Source data are provided as a Source Data file. B The heatmap on the left represents the distribution preferences of the T-cell clusters in different tissues (calculated based on the number of cells in each tissue/total number of cells in the cluster). The dot plot on the right shows the expression of signature and key functional genes in each cluster. The dot sizes represent the proportions of cells with expression, and the color scale represents the mean expression level. C Top differential splicing events between C3 and C4 Tregs. For each AS event, the dot size represents the proportion of cells in which the splicing probability was detectable from the RNA-seq reads, whereas the color scale represents the average AS probability in these cells. Previously studied AS events are marked in red, while events that have been studied for related functions are additionally marked with an asterisk. p-values are shown on the right side of each row (Wilcoxon test, two-sided test). Source data are provided as a Source Data file.
Fig. 6
Fig. 6. Comparison of the CD8 T-cell clusters defined by SCASL.
A Dot plot showing chemokines with differential expression between C0 and C8. The dot sizes represent the proportions of cells with expression, and the color scale represents the mean expression level. p-values are shown on the bottom of each column (Wilcoxon test, two-sided test). B Top differential splicing events between the CD8 T cells in C0 and C8. For each AS event, the dot size represents the proportion of cells in which the splicing probability was detectable from the RNA-seq reads, whereas the color scale represents the average AS probability in these cells. Previously studied AS events are marked in red, while events that have been studied for related functions are additionally marked with an asterisk. p-values are shown on the right side of each row (Wilcoxon test, two-sided test). Source data are provided as a Source Data file. C Volcano plot showing the differentially expressed genes between C0 and C6 (t-test adjusted p-value < 0.01, two-sided test). The median difference in gene expression levels between C0 and C6 cells is shown on the X-axis, and the statistical significance values of the differentially expressed genes (adjusted p-values) are shown on the Y-axis. The sizes of the dots represent the proportions of cells with expression. Biological functions and processes enriched in the differentially expressed genes are listed to the right, and some of the representative genes are provided. Source data are provided as a Source Data file. D Top differential splicing events between the CD8 T cells in C0 and C6. For each AS event, the dot size represents the proportion of cells in which the splicing probability was detectable from the RNA-seq reads, whereas the color scale represents the average AS probability in these cells. Previously studied AS events are marked in red, while events that have been studied for related functions are additionally marked with an asterisk. p-values are shown on the right side of each row (Wilcoxon test, two-sided test). Source data are provided as a Source Data file.

Similar articles

Cited by

References

    1. Matlin AJ, Clark F, Smith CW. Understanding alternative splicing: towards a cellular code. Nat. Rev. Mol. Cell Biol. 2005;6:386–398. doi: 10.1038/nrm1645. - DOI - PubMed
    1. Blencowe BJ. Alternative splicing: new insights from global analyses. Cell. 2006;126:37–47. doi: 10.1016/j.cell.2006.06.023. - DOI - PubMed
    1. Pan Q, et al. Deep surveying of alternative splicing complexity in the human transcriptome by high-throughput sequencing. Nat. Genet. 2008;40:1413–1415. doi: 10.1038/ng.259. - DOI - PubMed
    1. Chen J, Weiss W. Alternative splicing in cancer: implications for biology and therapy. Oncogene. 2015;34:1–14. doi: 10.1038/onc.2013.570. - DOI - PubMed
    1. Yeo GW, et al. Alternative splicing events identified in human embryonic stem cells and neural progenitors. PLoS Comput. Biol. 2007;3:1951–1967. doi: 10.1371/journal.pcbi.0030196. - DOI - PMC - PubMed