

Cardiac biopsies reveal differences in transcriptomics between left and right ventricle in patients with or without diagnostic signs of heart failure
- PMID: 38461325
- PMCID: PMC10924960
- DOI: 10.1038/s41598-024-56025-1
Cardiac biopsies reveal differences in transcriptomics between left and right ventricle in patients with or without diagnostic signs of heart failure
Abstract
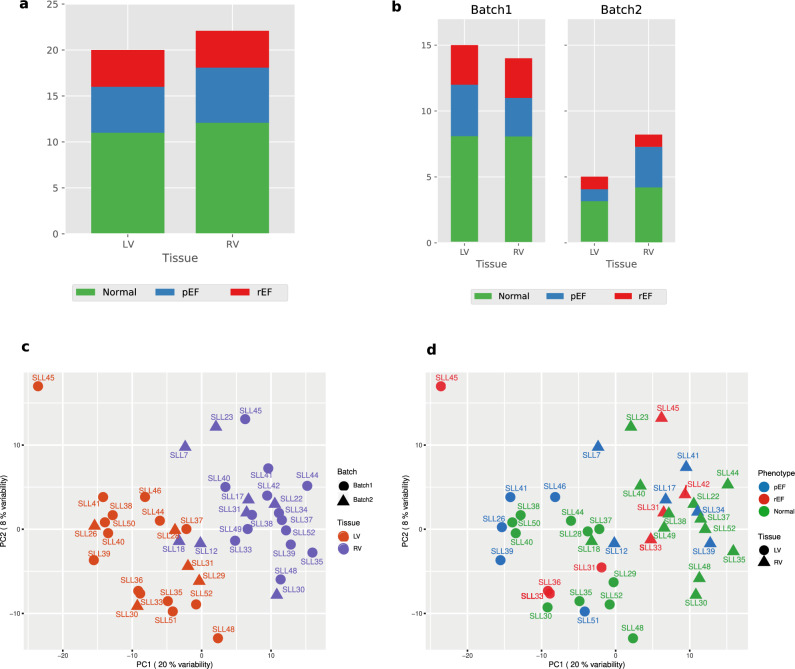
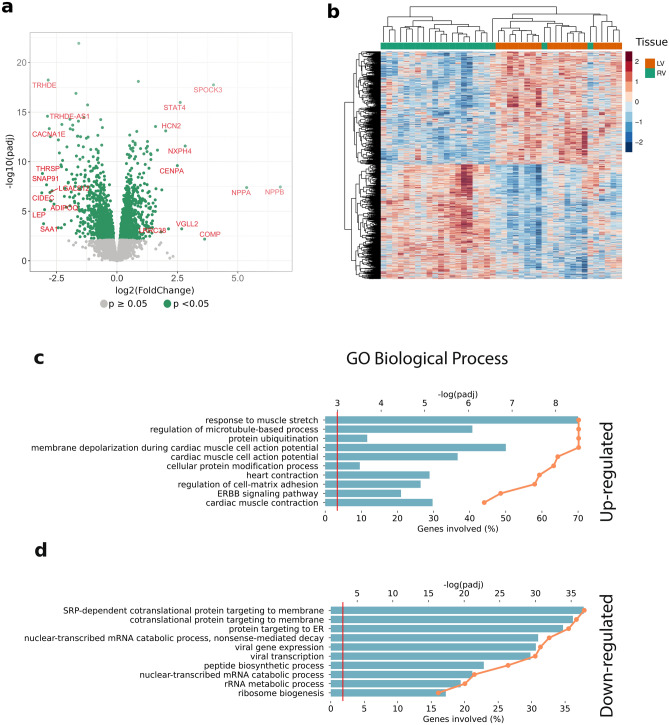
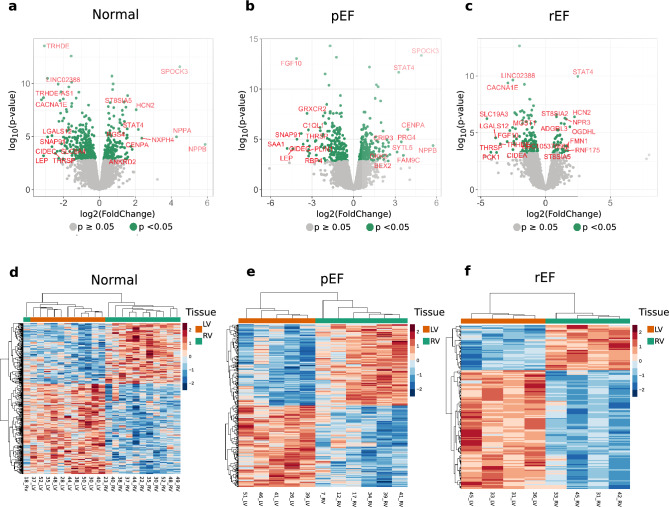
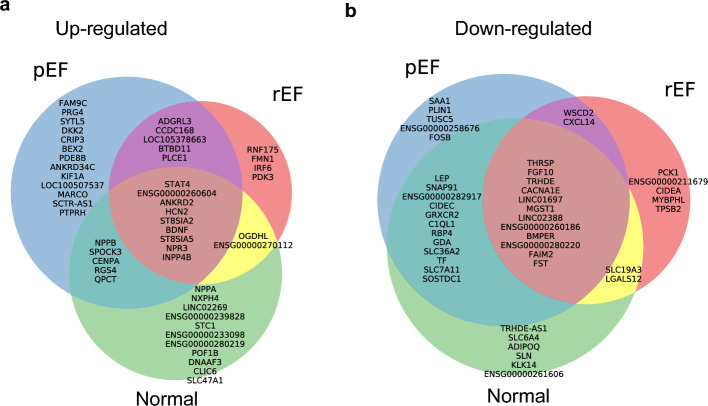
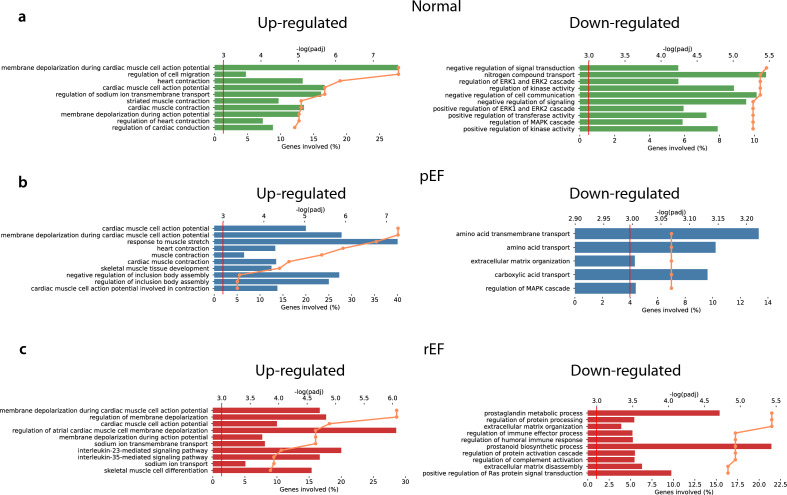
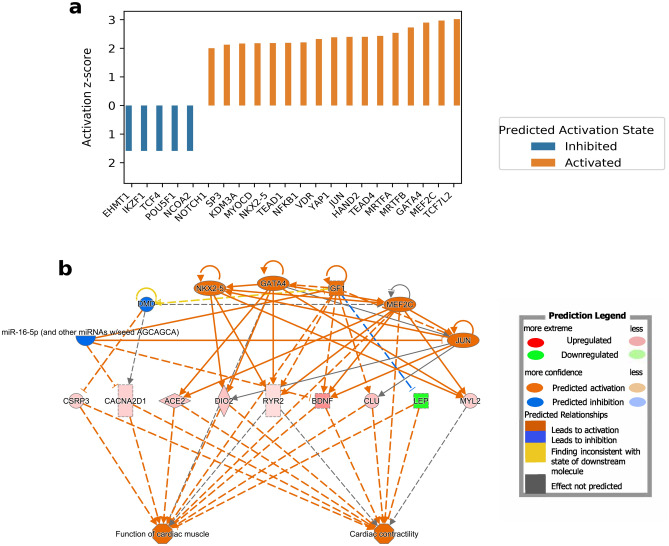
New or mild heart failure (HF) is mainly caused by left ventricular dysfunction. We hypothesised that gene expression differ between the left (LV) and right ventricle (RV) and secondly by type of LV dysfunction. We compared gene expression through myocardial biopsies from LV and RV of patients undergoing elective coronary bypass surgery (CABG). Patients were categorised based on LV ejection fraction (EF), diastolic function and NT-proBNP into pEF (preserved; LVEF ≥ 45%), rEF (reduced; LVEF < 45%) or normal LV function. Principal component analysis of gene expression displayed two clusters corresponding to LV and RV. Up-regulated genes in LV included natriuretic peptides NPPA and NPPB, transcription factors/coactivators STAT4 and VGLL2, ion channel related HCN2 and LRRC38 associated with cardiac muscle contraction, cytoskeleton, and cellular component movement. Patients with pEF phenotype versus normal differed in gene expression predominantly in LV, supporting that diastolic dysfunction and structural changes reflect early LV disease in pEF. DKK2 was overexpressed in LV of HFpEF phenotype, potentially leading to lower expression levels of β-catenin, α-SMA (smooth muscle actin), and enhanced apoptosis, and could be a possible factor in the development of HFpEF. CXCL14 was down-regulated in both pEF and rEF, and may play a role to promote development of HF.
Keywords: Cardiac biopsy; Gene expression; Heart failure; Ischemic heart disease; Left ventricular dysfunction.
© 2024. The Author(s).
Conflict of interest statement
CH reports: consulting fees from Novartis, Roche Diagnostics and AnaCardio, research grants from Bayer and speaker and honoraria from AstraZeneca and Novartis. ME reports: research grants from Novartis Foundation for Medical-Biological Research. HP reports: research grants from AstraZeneca, Novartis, Roche, Stockholm County Council, Vinnova, Swedish Research Council and Swedish Heart–Lung-foundation, speakers’ honoraria from Vifor, AstraZeneca and Novartis. The other authors declare no competing interests.
Figures
Similar articles
-
Transcriptomics of cardiac biopsies reveals differences in patients with or without diagnostic parameters for heart failure with preserved ejection fraction.Sci Rep. 2019 Feb 28;9(1):3179. doi: 10.1038/s41598-019-39445-2. Sci Rep. 2019. PMID: 30816197 Free PMC article.
-
Impaired systolic function by strain imaging in heart failure with preserved ejection fraction.J Am Coll Cardiol. 2014 Feb 11;63(5):447-56. doi: 10.1016/j.jacc.2013.09.052. Epub 2013 Oct 30. J Am Coll Cardiol. 2014. PMID: 24184245 Free PMC article. Clinical Trial.
-
Twist/untwist parameters are promising evaluators of myocardial mechanic changes in heart failure patients with preserved ejection fraction.Clin Cardiol. 2020 Jun;43(6):587-593. doi: 10.1002/clc.23353. Epub 2020 Mar 25. Clin Cardiol. 2020. PMID: 32212277 Free PMC article.
-
[Heart failure with preserved left ventricular ejection fraction].Praxis (Bern 1994). 2013 Oct 16;102(21):1299-307. doi: 10.1024/1661-8157/a001439. Praxis (Bern 1994). 2013. PMID: 24129298 Review. German.
-
Comprehensive Assessment of Heart Failure with Preserved Ejection Fraction Using Cardiac MRI.Heart Fail Clin. 2021 Jul;17(3):447-462. doi: 10.1016/j.hfc.2021.03.006. Heart Fail Clin. 2021. PMID: 34051976 Review.
Cited by
-
Characteristics of gene expression in epicardial adipose tissue and subcutaneous adipose tissue in patients at risk for heart failure undergoing coronary artery bypass grafting.BMC Genomics. 2024 Oct 7;25(1):938. doi: 10.1186/s12864-024-10851-9. BMC Genomics. 2024. PMID: 39375631 Free PMC article.
-
Unlocking the Potential: Angiotensin Receptor Neprilysin and Sodium Glucose Co-Transporter 2 Inhibitors for Right Ventricle Dysfunction in Heart Failure.Medicina (Kaunas). 2024 Jul 9;60(7):1112. doi: 10.3390/medicina60071112. Medicina (Kaunas). 2024. PMID: 39064541 Free PMC article. Review.
-
Ventricular volume asymmetry as a novel imaging biomarker for disease discrimination and outcome prediction.Eur Heart J Open. 2024 Jul 25;4(4):oeae059. doi: 10.1093/ehjopen/oeae059. eCollection 2024 Jul. Eur Heart J Open. 2024. PMID: 39119202 Free PMC article.
-
Effects of tiered cardiac rehabilitation on CRP, TNF-α, and physical endurance in older adults with coronary heart disease.Open Life Sci. 2025 May 20;20(1):20221040. doi: 10.1515/biol-2022-1040. eCollection 2025. Open Life Sci. 2025. PMID: 40417004 Free PMC article.
-
Impact of sodium-glucose cotransporter-2 inhibitors on pulmonary vascular cell function and arterial remodeling.World J Cardiol. 2025 Jan 26;17(1):101491. doi: 10.4330/wjc.v17.i1.101491. World J Cardiol. 2025. PMID: 39866213 Free PMC article. Review.
References
-
- Ponikowski P, et al. 2016 ESC Guidelines for the diagnosis and treatment of acute and chronic heart failure: The Task Force for the diagnosis and treatment of acute and chronic heart failure of the European Society of Cardiology (ESC). Developed with the special contribution of the Heart Failure Association (HFA) of the ESC. Eur. J. Heart Fail. 2016;18:891–975. doi: 10.1002/ejhf.592. - DOI - PubMed
MeSH terms
Grants and funding
LinkOut - more resources
Full Text Sources
Medical
Research Materials
Miscellaneous
