. 2024 Mar 10;22(1):261.
doi: 10.1186/s12967-024-05021-0.

Proteomic analysis of mitochondria associated membranes in renal ischemic reperfusion injury

Affiliations

Proteomic analysis of mitochondria associated membranes in renal ischemic reperfusion injury

Yi Li et al. J Transl Med. .

Abstract

Background: The mitochondria and endoplasmic reticulum (ER) communicate via contact sites known as mitochondria associated membranes (MAMs). Many important cellular functions such as bioenergetics, mitophagy, apoptosis, and calcium signaling are regulated by MAMs, which are thought to be closely related to ischemic reperfusion injury (IRI). However, there exists a gap in systematic proteomic research addressing the relationship between these cellular processes.

Methods: A 4D label free mass spectrometry-based proteomic analysis of mitochondria associated membranes (MAMs) from the human renal proximal tubular epithelial cell line (HK-2 cells) was conducted under both normal (N) and hypoxia/reperfusion (HR) conditions. Subsequent differential proteins analysis aimed to characterize disease-relevant signaling molecules. Gene Ontology (GO) and Kyoto Encyclopedia of Genes and Genomes (KEGG) analysis was applied to total proteins and differentially expressed proteins, encompassing Biological Process (BP), Cell Component (CC), Molecular Function (MF), and KEGG pathways. Further, Protein-Protein Interaction Network (PPI) exploration was carried out, leading to the identification of hub genes from differentially expressed proteins. Notably, Mitofusion 2 (MFN2) and BCL2/Adenovirus E1B 19-kDa interacting protein 3(BNIP3) were identified and subsequently validated both in vitro and in vivo. Finally, the impact of MFN2 on MAMs during hypoxia/reoxygenation was explored through regulation of gene expression. Subsequently, a comparative proteomics analysis was conducted between OE-MFN2 and normal HK-2 cells, providing further insights into the underlying mechanisms.

Results: A total of 4489 proteins were identified, with 3531 successfully quantified. GO/KEGG analysis revealed that MAM proteins were primarily associated with mitochondrial function and energy metabolism. Differential analysis between the two groups showed that 688 proteins in HR HK-2 cells exhibited significant changes in expression level with P-value < 0.05 and HR/N > 1.5 or HR/N < 0.66 set as the threshold criteria. Enrichment analysis of differentially expressed proteins unveiled biological processes such as mRNA splicing, apoptosis regulation, and cell division, while molecular functions were predominantly associated with energy metabolic activity. These proteins play key roles in the cellular responses during HR, offering insights into the IRI mechanisms and potential therapeutic targets. The validation of hub genes MFN2 and BNIP3 both in vitro and vivo was consistent with the proteomic findings. MFN2 demonstrated a protective role in maintaining the integrity of mitochondria associated membranes (MAMs) and mitigating mitochondrial damage following hypoxia/reoxygenation injury, this protective effect may be associated with the activation of the PI3K/AKT pathway.

Conclusions: The proteins located in mitochondria associated membranes (MAMs) are implicated in crucial roles during renal ischemic reperfusion injury (IRI), with MFN2 playing a pivotal regulatory role in this context.

Keywords: Ischemic reperfusion injury; Kidney; Mass spectrometry; Mitochondria associated membranes; Proteomics analysis.


Conflict of interest statement

The authors declare that they have no competing interests.

Figures

Fig. 1
Fig. 1
Comprehensive characterization of total MAM proteins in HK-2 cells. A Principal component analysis (PCA) of the proteome between two groups. The principal component analysis (PCA) plot demonstrates a high level of reproducibility within the three samples in one group, as well as a significant degree of distinction between normal groups (N) and hypoxia/reoxygenation (HR) groups, showing distinct clustering. B Subcellular distribution of proteins identified in total MAM fractions. C Gene Ontology (GO) and Kyoto Encyclopedia of Genes and Genomes (KEGG) enrichment analysis of total proteins, highlighting biological processes (BP), cellular components (CC), molecular functions (MF), and KEGG pathways; top 12 results displayed for each category
Fig. 2
Fig. 2
Differentially expressed proteins and enrichment analysis in N and HR groups. A Volcano plot depicting differential protein expression between N and HR groups, with −log10 (p-value) versus log2 (HR/N ratio). B Top 10 proteins with significant abundance changes in HR/N comparison.BNIP3 is associated with potential engagement in mitochondrial autophagy; SEMA4B may contribute to altered cell migration and apoptosis; RALGAPB implies regulatory involvement in cellular processes through GTP hydrolysis; EPHB1, as a tyrosine kinase, may signify engagement in signaling pathways crucial for cellular adaptation; SAR1A, EIF3M, and PWP2 may affect protein transport and synthesis, respectively; PHF5A may affect mRNA splicing, MFN2:mitochondrial outer membrane protein that participates in mitochondrial fusion and contributes to the maintenance and operation of the mitochondrial network. C GO/KEGG enrichment analysis of differentially expressed proteins; top 12 results for BP, CC, MF, and KEGG pathways displayed. Data expressed as mean ± SEM; significance denoted as *p < 0.05, **p < 0.01, ***p < 0.001
Fig. 3
Fig. 3
Establishment of the protein–protein interaction (PPI) network. AE Identification of top 30 central genes in PPI network via MCC, MNC, EPC, Degree, and Closeness algorithms. F Venn diagram showing common gene identified across all five algorithms
Fig. 4
Fig. 4
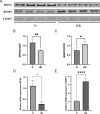
Validation of BNIP3 and MFN2 alterations via western blot (WB) and quantitative real time polymerase chain reaction (qRT-PCR). A Densitometric analysis of MFN2, BNIP3, and CoxIV bands. B, C Relative quantification of MFN2: COXIV and BNIP3: COXIV ratios, indicating significant changes in HR group versus N group. D, E mRNA expression levels of MFN2 and BNIP3. Data expressed as mean ± SEM; significance denoted as *p < 0.05, **p < 0.01, ***p < 0.001, ****p < 0.0001
Fig. 5
Fig. 5
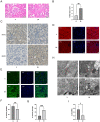
Validation experiments in vivo. A, B HE staining and renal pathology scoring in normal and ischemic reperfusion kidneys. C Immunohistochemical staining for MFN2 and BNIP3 in rat kidney tissues. DG Immunofluorescence staining for MFN2 and BNIP3. H, I Transmission electron microscopy of rat kidney MAMs. Data expressed as mean ± SEM; significance denoted as *p < 0.05, **p < 0.01, ***p < 0.001
Fig. 6
Fig. 6
MAM dynamics in HK-2 cells under various conditions. A Increased MFN2 expression induced by OE-MFN2. B Reduced MFN2 expression via Si-MFN2. C, D Staining of HK-2 cells under N, HR, HR + OE-MFN2 and HR + Si-MFN2 conditions using MitoTracker and ER Tracker, quantification of Manders' coefficient for mitochondria-ER overlap. E, F Transmission electron microscopy analysis of MAMs and mitochondrial damage. Significance denoted as *p < 0.05, **p < 0.01, ***p < 0.001
Fig. 7
Fig. 7
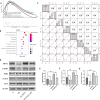
MFN2 regulation of MAM-related mechanisms in HK-2 cells. A Gene set enrichment analysis (GSEA) of proteomics in normal versus OE-MFN2 HK-2 cells. B KEGG analysis of upregulated genes in OE-MFN2 HK-2 cell proteomics. C Correlation analysis of key molecules in the PI3K/AKT pathway with MFN2. DG Expression levels of MFN2, PI3K, p-PI3K, AKT, and p-AKT. Data expressed as mean ± SEM; significance denoted as *p < 0.05, **p < 0.01, ***p < 0.001

References

    1. Boom H, Mallat MJ, de Fijter JW, Zwinderman AH, Paul LC. Delayed graft function influences renal function, but not survival. Kidney Int. 2000;58(2):859–866. doi: 10.1046/j.1523-1755.2000.00235.x. - DOI - PubMed
    1. Saat TC, van Akker EK, Jzermans JNM, Dor FJ, de Bruin RW. Improving the outcome of kidney transplantation by ameliorating renal ischemia reperfusion injury: lost in translation? J Transl Med. 2016;14:20. doi: 10.1186/s12967-016-0767-2. - DOI - PMC - PubMed
    1. Zhao M, Wang Y, Li L, Liu S, Wang C, Yuan Y, Yang G, Chen Y, Cheng J, Lu Y, et al. Mitochondrial ROS promote mitochondrial dysfunction and inflammation in ischemic acute kidney injury by disrupting TFAM-mediated mtDNA maintenance. Theranostics. 2021;11(4):1845–1863. doi: 10.7150/thno.50905. - DOI - PMC - PubMed
    1. Zhang N, Guan C, Liu Z, Li C, Yang C, Xu L, Niu M, Zhao L, Zhou B, Che L, et al. Calycosin attenuates renal ischemia/reperfusion injury by suppressing NF-κB mediated inflammation via PPARγ/EGR1 pathway. Front Pharmacol. 2022;13:970616. doi: 10.3389/fphar.2022.970616. - DOI - PMC - PubMed
    1. Zhao H, Alam A, Soo AP, George AJT, Ma D. Ischemia-reperfusion injury reduces long term renal graft survival: mechanism and beyond. EBioMedicine. 2018;28:31–42. doi: 10.1016/j.ebiom.2018.01.025. - DOI - PMC - PubMed

Publication types

Substances

LinkOut - more resources