. 2024 Apr;300(4):107153.
doi: 10.1016/j.jbc.2024.107153. Epub 2024 Mar 9.

Genome-wide CRISPR activation screen identifies JADE3 as an antiviral activator of NF-kB-dependent IFITM3 expression

Affiliations

Genome-wide CRISPR activation screen identifies JADE3 as an antiviral activator of NF-kB-dependent IFITM3 expression

Moiz Munir et al. J Biol Chem. 2024 Apr.

Abstract

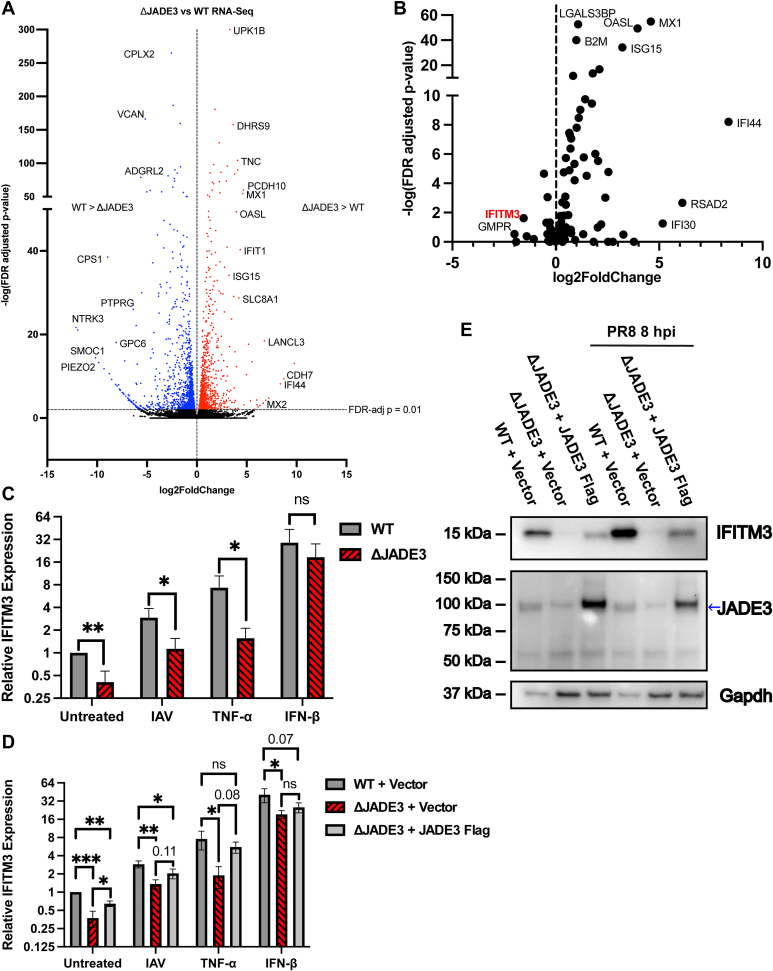
The innate immune system features a web of interacting pathways that require exquisite regulation. To identify novel nodes in this immune landscape, we conducted a gain-of-function, genome-wide CRISPR activation screen with influenza A virus. We identified both appreciated and novel antiviral genes, including Jade family PHD zinc finger 3 (JADE3) a protein involved in directing the histone acetyltransferase histone acetyltransferase binding to ORC1 complex to modify chromatin and regulate transcription. JADE3 is both necessary and sufficient to restrict influenza A virus infection. Our results suggest a distinct function for JADE3 as expression of the closely related paralogs JADE1 and JADE2 does not confer resistance to influenza A virus infection. JADE3 is required for both constitutive and inducible expression of the well-characterized antiviral gene interferon-induced transmembrane protein 3 (IFITM3). Furthermore, we find JADE3 activates the NF-kB signaling pathway, which is required for the promotion of IFITM3 expression by JADE3. Therefore, we propose JADE3 activates an antiviral genetic program involving NF-kB-dependent IFITM3 expression to restrict influenza A virus infection.

Keywords: CRISPR/Cas9 screen; IFITM3; JADE; NF-kB; histone acetylation; inflammation; influenza A virus.


Conflict of interest statement

Conflict of interest The authors declare that they have no conflict of interests with the contents of this article.

Figures

Figure 1
Figure 1
Genome-wide CRISPR activation screen identifies antiviral proteins against influenza A virus.A, schematic of genome-wide CRISPRa screening strategy to identify antiviral genes for influenza a virus (IAV). Sequences of the sgRNAs from cells surviving IAV challenge were quantified and compared to the relative abundance of a mock-infected sample. B, table of significantly enriched genes. STARS algorithm was used to calculate STARS score, p-value, and false discovery rate (FDR). Genes colored in blue have previously been shown to possess anti-IAV activity. FDR scores are shown and color coded for <0.01 (yellow), <0.05 (orange), and <0.25 (gold). JADE3 (bolded) was chosen for additional validation. JADE3, Jade family PHD zinc finger 3; sgRNA, single guide RNA.
Figure 2
Figure 2
Validation of CRISPR activation screen.A, table showing mRNA fold change of indicated gene in HeLa-dCas9 VP64 cells expressing guides (A) or (B) to the indicated gene. Data is shown as the average of three independent experiments. B, cartoon schematic of the validation assay in which HeLa-dCas9 VP64 cells were infected with PR8 mNeon reporter virus and mNeon fluorescence was monitored every 3 h via IncuCyte. C, heat map displaying the number of infected cells per well over a 48 h time course for each cell line expressing the indicated sgRNA construct. Data is the average from three independent experiments. D, number of cells infected with influenza PR8 mNeon at 24 h postinfection from (C). The data are shown as means ± the SEM from three independent experiments, and data were analyzed for statistical differences for each cell line compared to the vector control by one-way ANOVA with Tukey’s multiple-comparison test. ∗p < 0.05; ∗∗p < 0.01; ∗∗∗p < 0.001; and ∗∗∗∗p < 0.0001. ns, not significant; PR8, Puerto Rico/8/1934; sgRNA, single guide RNA.
Figure 3
Figure 3
JADE3 is sufficient and necessary to restrict influenza A infection.A, maximum likelihood phylogenetic tree of JADE3 orthologs. One hundred bootstrap replicates were performed and bootstrap values are indicated. Branch length represents amino acid changes per site. GenBank common names are used for species. Ortholog gene groups for JADE3 (red), JADE1 (purple), and JADE2 (green) are colored. Potential JADE orthologs that do not branch with one of the three JADE proteins are in black. B, representative Western blot from three experiments of JADE3 Flag expression from control and JADE3 Flag transduced A549 cells. C, vector control or JADE3 Flag A549 cells were challenged with WT PR8 at a MOI of 0.01. Infectious virus titer was determined by TCID50 24 h postinfection. Data was analyzed using a paired two-tail t test. D, representative Western blot from three experiments for JADE3 expression in indicated cell lines. Blue arrow indicates expected molecular weight of JADE3. E, A549 WT or A549ΔJADE3 cells were challenged with WT PR8 at a MOI of 0.01. Infectious virus titer was determined by TCID50 24 h postinfection. Data was analyzed using a paired two-tail t test. F, representative Western blot from three experiments for JADE3 expression in indicated cell lines. Blue arrow indicates expected molecular weight of JADE3. G, A549 control or A549ΔJADE3 cells complemented with either a vector control or JADE3 were challenged with WT PR8 at a MOI of 0.01. Infectious virus titer was determined by TCID50 24 h postinfection. Data was analyzed using a one-way ANOVA with Tukey’s multiple comparisons test. All data shown is mean ± SD from three independent experiments. ∗p < 0.05 and ∗∗p < 0.01. JADE3, Jade family PHD zinc finger 3; MOI, multiplicity of infection; ns, not significant; PR8, Puerto Rico/8/1934.
Figure 4
Figure 4
Analysis of JADE3 domains and paralogs antiviral function.A, achematic of JADE3 and its PHDs. Representative Western blot from three experiments of A549 cells transduced with a vector control, JADE3 Flag, or JADE3 lacking both or either PHDs. B, A549 cells expressing either a vector control or the indicated PHD truncations were challenged with WT PR8 at a MOI of 0.01. Infectious virus titer was determined by TCID50 24 h postinfection. C, representative Western blot from three experiments of expression of flag tagged JADE1, JADE2, JADE3 in A549 cells. D, A549 cells expressing different Jade family proteins were challenged with WT PR8 at a MOI of 0.01. Infectious virus titer was determined by TCID50 24 h postinfection. All data shown is mean ± SD from three independent experiments. Data was analyzed using a one-way ANOVA with Dunnett’s multiple comparisons test against the vector control. ∗p < 0.05 and ∗∗p < 0.01. JADE3, Jade family PHD zinc finger 3; MOI, multiplicity of infection; ns, not significant; PHD, plant homeodomain; PR8, Puerto Rico/8/1934.
Figure 5
Figure 5
JADE3 is required for basal and inducible IFITM3 expression.A, volcano plot of RNA-seq of A549ΔJADE3 cells versus WT cells. An FDR adjusted p value <0.01 (dotted line) was considered significant. Data is from three biological replicates. B, scatter plot of ISGs from RNA-seq of A549ΔJADE3 cells versus WT cells. Data is from three biological replicates. IFITM3 is shown in red. C, A549 WT or A549ΔJADE3 cells were either challenged or treated with the labeled condition and IFITM3 mRNA expression was measure by qPCR. Expression was normalized to actin. IAV challenge was done at a MOI of 3 for 8 h. TNF-α and IFN-β treatment was done for 6 h. Data shown is from three independent experiments presented as mean ± SD relative fold change compared to untreated vector control. Data was analyzed using independent two-tail t test for each condition. D, A549 vector control, A549ΔJADE3 complemented with a vector control, or A549ΔJADE3 complemented with JADE3 were either challenged or treated with the labeled condition and IFITM3 mRNA expression was measure by qPCR. Expression was normalized to actin. IAV challenge was done at a MOI of 3 for 8 h. TNF-α and IFN-β treatment was done for 6 h. Data shown is from three independent experiments presented as mean ± SD relative fold change compared to untreated vector control. Data was analyzed using independent one-way ANOVAs with Tukey’s multiple comparisons test for each condition. E, A549 control cells and A549ΔJADE3 cells complemented with either a vector control or JADE3 Flag were challenged with WT PR8 at a MOI of 3. Whole-cell lysis was extracted 8 h postinfection and resolved using SDS-PAGE and probed for IFITM3. Western blot shown is representative of three experiments. ∗p < 0.05 and ∗∗p < 0.01. FDR, false discovery rate; IAV, influenza A virus; IFITM3, interferon-induced transmembrane protein 3; JADE3, Jade family PHD zinc finger 3; MOI, multiplicity of infection; ns, not significant; qPCR, quantitative PCR; TNF, tumor necrosis factor.
Figure 6
Figure 6
Transcriptional profiling reveals that JADE3 activates the TNF/NF-kB signaling pathway.A, principal component analysis scatter plot showing differential gene expression signatures of control, JADE3- or JADE2-expressing cells. PC1 and PC2 corresponding to the principal component 1 and principal component 2. B, volcano plot of RNA-seq of A549 JADE3 Flag cells versus vector control cells. An FDR-adjusted p-value < 0.01 (dotted line) was considered significant. Data is from three biological replicates. C, Venn diagram of differentially expressed genes (DEGs) significantly upregulated by JADE3 Flag versus vector control and JADE2 Flag versus vector control. D, gene set enrichment analysis of genes that were both downregulated in ΔJADE3 cells (FDR-adjusted p value < 0.05) and upregulated in JADE3 Flag cells (FDR-adjusted p value < 0.05). The ten most significantly enriched gene sets are shown. E, gene set enrichment analysis of the 500 most significantly upregulated genes in A549 cells expressing either JADE3 Flag or a vector control. The ten most significantly enriched gene sets are shown. FDR, false discovery rate; JADE3, Jade family PHD zinc finger 3; TNF, tumor necrosis factor.
Figure 7
Figure 7
JADE3expression activates NF-kB p65.A, heat map of RNA-seq normalized read count for select genes involved in canonical TNF-α/NF-kB signaling pathway. Coloring is done relative to each row with higher normalized read counts in red and lower normalized read counts in blue. Each box is one biological replicate. B, vector control or JADE3 Flag A549 cells were lysed and nuclei were fractionated. Whole-cell lysis and nuclear fractions were resolved using SDS-PAGE and probed for NF-kB p65. Image was spliced at dashed line from a single blot. Western blot shown is representative of three experiments. C, top: vector control or JADE3 Flag A549 cells were treated with 20 ng/ml of TNF-α for 15 min and then lysed. Whole cell-lysis was resolved using SDS-PAGE and probed for phosphorylated NF-kB p65 (serine 536). Western blot shown is representative of three experiments. Bottom: P-NF-kB band intensity was quantified and normalized to NF-kB band intensity. Data shown is from three experiments presented as mean ± SD relative fold change compared to vector control. Data was analyzed using independent two-tail t tests. D, top: whole-cell lysis from A549 cells expressing either vector control, JADE3 Flag, or JADE3 Flag lacking the indicated PHDs were resolved using SDS-PAGE and probed for phosphorylated NF-kB p65 (serine 536). Western blot shown is representative of three experiments. Bottom: P-NF-kB band intensity was quantified and normalized to NF-kB band intensity. Data shown is from three experiments presented as mean ± SD relative fold change compared to vector control. Data was analyzed using a one-way ANOVA with Dunnett’s multiple comparisons test. E, left: whole-cell lysis from A549 cells expressing either a vector control or indicated JADE family members were resolved using SDS-PAGE and probed for phosphorylated NF-kB p65 (serine 536). Western blot shown is representative of three experiments. Right: P-NF-kB band intensity was quantified and normalized to NF-kB band intensity. Data shown is from three experiments presented as mean ± SD relative fold change compared to vector control. Data was analyzed using a one-way ANOVA with Dunnett’s multiple comparisons test. ∗p < 0.05 and ∗∗p < 0.01. JADE3, Jade family PHD zinc finger 3; ns, not significant; PHD, plant homeodomain; TNF, tumor necrosis factor.
Figure 8
Figure 8
JADE3 antiviral function requires both NF-kB p65 and IFITM3.A, top: whole-cell lysis from A549 vector control or JADE3-expressing cells transduced with CRISPR/Cas9 to edit NF-kB p65 were resolved using SDS-PAGE and probed for NF-kB P65. KO1 and KO2 denote two unique single guide RNAs used to generate the polyclonal cell lines. Western blot shown is representative of three experiments. Bottom: whole-cell lysis from untreated or 24 h IFN-β–treated A549 vector control or JADE3-expressing cells transduced with CRISPR/Cas9 constructs to edit IFITM3 were resolved using SDS-PAGE and probed for IFITM3. KO1 and KO2 denote two separate polyclonal cell lines expressing individual guides targeting IFITM3. Dashed line denotes location of splicing of two different exposures of the same blot. Western blot shown is representative of three experiments. B, top: whole-cell lysis from A549 vector control or JADE3-expressing cells lacking NF-kB p65 expression were resolved using SDS-PAGE and probed for IFITM3. Western blot shown is representative of three experiments. Bottom: IFITM3 band intensity was quantified and normalized to GAPDH band intensity. Data shown is from three experiments presented as mean ± SD relative fold change compared to vector control. Data was analyzed using a one-way ANOVA with Tukey’s multiple comparisons test. C, A549 vector control or JADE3-Flag cells lacking expression of either NF-kB p65 or IFITM3 were challenged with WT PR8 at a multiplicity of infection of 0.01. Infectious virus titer was determined by TCID50 24 h postinfection. Data shown is mean ± SD from three independent experiments and was analyzed using independent paired two-tail t tests for each knockout. ∗p < 0.05; ∗∗p < 0.01; ∗∗∗p < 0.001; and ∗∗∗∗p < 0.0001. IFITM3, interferon-induced transmembrane protein 3; IFN, interferon; PR8, Puerto Rico/8/1934; JADE3, Jade family PHD zinc finger 3; ns, not significant.
Figure 9
Figure 9
Model of JADE3 antiviral activity through NF-Kb dependent IFITM3 expression. A schematic model of the proposed mechanism for JADE3 antiviral function. JADE3 directs the HBO1 complex to target chromatin. Histone acetylation “opens” chromatin allowing for transcription of target genes. Increased IFITM3 expression in a NF-Kb–dependent manner. IFITM3 inhibits viral entry. HBO1, histone acetyltransferase binding to ORC1; IFITM3, interferon-induced transmembrane protein 3; JADE3, Jade family PHD zinc finger 3.

Update of

References

    1. Medzhitov R. Origin and physiological roles of inflammation. Nature. 2008;454:428–435. - PubMed
    1. Shalem O., Sanjana N.E., Hartenian E., Shi X., Scott D.A., Mikkelson T., et al. Genome-scale CRISPR-Cas9 knockout screening in human cells. Science. 2014;343:84–87. - PMC - PubMed
    1. Wang T., Wei J.J., Sabatini D.M., Lander E.S. Genetic screens in human cells using the CRISPR-Cas9 system. Science. 2014;343:80–84. - PMC - PubMed
    1. Zablocki-Thomas L., Menzies S.A., Lehner P.J., Manel N., Benaroch P. A genome-wide CRISPR screen identifies regulation factors of the TLR3 signalling pathway. Innate Immun. 2020;26:459–472. - PMC - PubMed
    1. Schmid-Burgk J.L., Chauhan D., Schmidt T., Ebert T.S., Reinhardt J., Endl E., et al. A genome-wide CRISPR (clustered regularly interspaced short palindromic repeats) screen identifies NEK7 as an essential component of NLRP3 inflammasome activation. J. Biol. Chem. 2016;291:103–109. - PMC - PubMed

Publication types