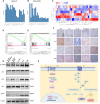
Ce6-modified Fe ions-doped carbon dots as multifunctional nanoplatform for ferroptosis and photodynamic synergistic therapy of melanoma
- PMID: 38462597
- PMCID: PMC10924998
- DOI: 10.1186/s12951-024-02346-2
Ce6-modified Fe ions-doped carbon dots as multifunctional nanoplatform for ferroptosis and photodynamic synergistic therapy of melanoma
Abstract
Background: Despite the higher sensitivity of melanoma towards ferroptosis and photodynamic therapy (PDT), the lack of efficient ferroptosis inducers and the poor solubility of photosensitizers restrict their synergistic strategies. With unique advantages, carbon dots (CDs) are expected to serve as innovative building blocks for combination therapy of cancers.
Results: Herein, an ferroptosis/PDT integrated nanoplatform for melanoma therapy is constructed based on chlorin e6-modified Fe ions-doped carbon dots (Fe-CDs@Ce6). As a novel type of iron-carbon hybrid nanoparticles, the as-prepared Fe-CDs can selectively activate ferroptosis, prevent angiogenesis and inhibit the migration of mouse skin melanoma cells (B16), but have no toxicity to normal cells. The nano-conjugated structures facilitate not only the aqueous dispersibility of Ce6, but also the self-accumulation ability of Fe-CDs@Ce6 within melanoma area without requiring extra targets. Moreover, the therapeutic effects of Fe-CDs@Ce6 are synergistically enhanced due to the increased GSH depletion by PDT and the elevated singlet oxygen (1O2) production efficiency by Fe-CDs. When combined with laser irradiation, the tumor growth can be significantly suppressed by Fe-CDs@Ce6 through cyclic administration. The T2-weighted magnetic resonance imaging (MRI) capability of Fe-CDs@Ce6 also reveals their potentials for cancer diagnosis and navigation therapy.
Conclusions: Our findings indicate the multifunctionality of Fe-CDs@Ce6 in effectively combining ferroptosis/PDT therapy, tumor targeting and MRI imaging, which enables Fe-CDs@Ce6 to become promising biocompatible nanoplatform for the treatment of melanoma.
Keywords: Carbon dots; Ce6; Fe ions-doping; Ferroptosis; Melanoma; Photodynamic therapy.
© 2024. The Author(s).
Conflict of interest statement
The authors declare that they have no competing interests.
Figures


Similar articles
-
Photodynamic therapy of melanoma skin cancer using carbon dot - chlorin e6 - hyaluronate conjugate.Acta Biomater. 2015 Oct;26:295-305. doi: 10.1016/j.actbio.2015.08.027. Epub 2015 Aug 20. Acta Biomater. 2015. PMID: 26297888
-
Ferroptosis boosted oral cancer photodynamic therapy by carrier-free Sorafenib-Ce6 self-assembly nanoparticles.J Control Release. 2024 Feb;366:798-811. doi: 10.1016/j.jconrel.2023.12.056. Epub 2024 Jan 25. J Control Release. 2024. PMID: 38184236
-
Ce6-Modified Carbon Dots for Multimodal-Imaging-Guided and Single-NIR-Laser-Triggered Photothermal/Photodynamic Synergistic Cancer Therapy by Reduced Irradiation Power.ACS Appl Mater Interfaces. 2019 Feb 13;11(6):5791-5803. doi: 10.1021/acsami.8b19042. Epub 2019 Jan 30. ACS Appl Mater Interfaces. 2019. PMID: 30648846
-
Carbon Dots in Photodynamic Therapy: The Role of Dopant and Solvent on Optical and Photo-Responsive Properties.Chemistry. 2024 Sep 25;30(54):e202400885. doi: 10.1002/chem.202400885. Epub 2024 Sep 9. Chemistry. 2024. PMID: 39032088 Review.
-
Ferroptosis: A novel cell death modality as a synergistic therapeutic strategy with photodynamic therapy.Photodiagnosis Photodyn Ther. 2025 Feb;51:104463. doi: 10.1016/j.pdpdt.2024.104463. Epub 2024 Dec 28. Photodiagnosis Photodyn Ther. 2025. PMID: 39736368 Review.
Cited by
-
Comprehensive landscape of cell death mechanisms: from molecular cross-talk to therapeutic innovation in oncology.Front Cell Dev Biol. 2025 Jul 16;13:1611055. doi: 10.3389/fcell.2025.1611055. eCollection 2025. Front Cell Dev Biol. 2025. PMID: 40741332 Free PMC article. Review.
-
Oxidative stress induced paclitaxel-derived carbon dots inhibit glioblastoma proliferation and EMT process.J Nanobiotechnology. 2025 Apr 23;23(1):310. doi: 10.1186/s12951-025-03406-x. J Nanobiotechnology. 2025. PMID: 40269908 Free PMC article.
-
Theranostic Applications of Taurine-Derived Carbon Dots in Colorectal Cancer: Ferroptosis Induction and Multifaceted Antitumor Mechanisms.Int J Nanomedicine. 2025 Jun 16;20:7613-7635. doi: 10.2147/IJN.S516926. eCollection 2025. Int J Nanomedicine. 2025. PMID: 40546797 Free PMC article.
-
Characterization and application of fluorescent hydrogel films with superior mechanical properties in detecting iron(Ⅲ) ions and ferroptosis in oral cancer.Front Bioeng Biotechnol. 2025 Jan 14;12:1526877. doi: 10.3389/fbioe.2024.1526877. eCollection 2024. Front Bioeng Biotechnol. 2025. PMID: 39877268 Free PMC article.
-
Engineering of Green Carbon Dots for Biomedical and Biotechnological Applications.Molecules. 2024 Sep 23;29(18):4508. doi: 10.3390/molecules29184508. Molecules. 2024. PMID: 39339503 Free PMC article. Review.
References
-
- Bajpai VK, Khan I, Shukla S, Kang SM, Aziz F, Tripathi KM, Saini D, Cho HJ, SuHeo N, Sonkar SK, et al. Multifunctional N-P-doped carbon dots for regulation of apoptosis and autophagy in B16F10 melanoma cancer cells and in vitro imaging applications. Theranostics. 2020;10:7841–7856. doi: 10.7150/thno.42291. - DOI - PMC - PubMed
-
- Winkler JK, Fink C, Toberer F, Enk A, Deinlein T, Hofmann-Wellenhof R, Thomas L, Lallas A, Blum A, Stolz W, Haenssle HA. Association between surgical skin markings in dermoscopic images and diagnostic performance of a deep learning convolutional neural network for melanoma recognition. JAMA Dermatol. 2019;155:1135–1141. doi: 10.1001/jamadermatol.2019.1735. - DOI - PMC - PubMed
MeSH terms
Substances
Grants and funding
LinkOut - more resources
Full Text Sources
Medical
Research Materials

